Question:
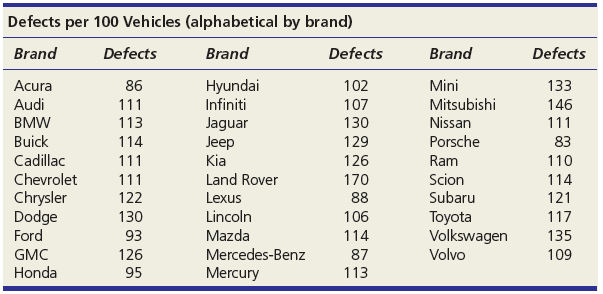
(a) Make a stem-and-leaf plot for the number of defects per 100 vehicles for these 32 brands. (b) Make a dot plot of the defects data. (c) Describe these two displays. (Hint: Refer to center, variability, and shape.)
Transcribed Image Text:
Defects per 100 Vehicles (alphabetical by brand) brand Defects brand Defects brand Defects Hyundai Infiniti 102 Mini Mitsubishi Nissan Porsche Acura 86 133 Audi 111 107 146 BMW 113 Jaguar Jeep Kia 130 111 Buick 129 126 114 83 Cadillac 111 Ram 110 Chevrolet Land Rover 170 Scion Subaru 111 114 Chrysler Dodge Ford 122 Lexus Lincoln Mazda 88 121 130 106 117 Toyota Volkswagen 93 114 135 GMC 126 Mercedes-Benz 87 Volvo 109 Honda 95 Mercury 113
> Let C be the event that a randomly chosen adult has some college education. Let M be the event that a randomly chosen adult is married. Given P(C) = .4, P(M) = .5 and P(C ∩ M) = .24, find each probability. a. P(C9). b. P(C ∪ M). c. P(M | C). d. P(C | M).
> Prof. Green gave three exams last semester. Scores were normally distributed on each exam. Below are scores for 10 randomly chosen students on each exam. (a) Find the 95 percent confidence interval for the mean score on each exam. (b) Do the confidence i
> Let S be the event that a randomly chosen female aged 18–24 is a smoker. Let C be the event that a randomly chosen female aged 18–24 is a Caucasian. Given P(S) = .246, P(C) = .830, and P(S ∩ C) = .232, find each probability. a. P(S9). b. P(S ∪ C). c. P(S
> Are these events collectively exhaustive or not? Explain. a. A 5 college grad, B 5 some college, C 5 no college b. A 5 born in the United States, B 5 born in Canada, C 5 born in Mexico c. A 5 full-time student, B 5 part-time student, C 5 not enrolled as
> Are these characteristics of a student at your university mutually exclusive or not? Explain. a. A 5 works 20 hours or more, B 5 majoring in accounting b. A 5 born in the United States, B 5 born in Canada c. A 5 owns a Toyota, B 5 owns a Honda
> CitiBank recorded the number of customers to use a downtown ATM during the noon hour on 32 consecutive workdays. (a) Find the mean, median, and mode. (b) Do these measures of center agree? Explain. (c) Make a histogram or dot plot. (d) Are the data symme
> Prof. Hardtack gave four Friday quizzes last semester in his 10-student senior tax accounting class. (a) Find the mean, median, and mode for each quiz. (b) Do these measures of center agree? Explain. (c) For each data set, note strengths or weaknesses of
> Scores are shown for the most recent state civil service exam taken by 24 applicants for positions in law enforcement. (a) Calculate the mean, median, and mode. (b) Is the distribution skewed? Explain. (c) Is the mode a useful measure of center for this
> Days on the market are shown for the 36 most recent home sales in the city of Sonando Hills. (a) Calculate the mean, median, and mode. (b) Is the distribution skewed? Explain. (c) Is the mode a useful measure of center for this data set? 18 70 52 17
> For each data set, which best indicates a “typical” data value (mean, median, either)? a. MPG for 7 Honda Civics: 21.8, 24.1, 24.6, 26.2, 28.4, 35.2, 36.3 b. Number of riders in 8 cars: 1, 1, 1, 1, 1, 1, 4, 6 c. D
> For each data set, which best indicates a “typical” data value (mean, median, either)? a. Days on campus by 11 students: 1, 1, 2, 2, 3, 3, 3, 4, 4, 5, 5 b. P/E ratios of 6 stocks: 1.5, 6.5, 6.6, 7.3, 8.2, 9.1 c. Textbooks in 9 backpacks: 0, 0, 0, 0, 0,
> The mean collection period for accounts receivable at Ephemeral Products is 18.5 days with a standard deviation of 4.8 days. (a) What is the standardized z-score for an account that is paid in 30 days? (b) Is that account an outlier? (c) How many days (t
> A random sample of 16 pharmacy customers showed the waiting times below (in minutes). Find a 90 percent confidence interval for μ, assuming that the sample is from a normal population. 21 22 22 17 21 17 23 20 20 24 9 22 16 21 22 21
> The mean monthly rent of students at Oxnard University is $875 with a standard deviation of $219. (a) John’s rent is $1,325. What is his standardized z-score? (b) Is John’s rent an outlier? (c) How high would the rent have to be to qualify as an outlier?
> For each data set, is the mode a good measure of center? Explain. a. GMAT scores (8 MBA applicants): 490, 495, 542, 587, 599, 622, 630, 641 b. Exam grades (12 students): F, D, C, C, C, C, C, C, B, B, A, A c. Body Mass Index (7 Army recruits): 18.6, 20.2
> Prof. Hardtack gave four Friday quizzes last semester in his senior tax accounting class. A random sample of 10 student scores is shown for each quiz. (a) Find the sample mean, standard deviation, and coefficient of variation for each quiz. (b) How do th
> (a) Find the coefficient of variation for prices of these three stocks. (b) Which stock has the greatest relative variation? (c) To measure variability, why not just compare the standard deviations? Stock A: X = $24.50, s = 5.25 Stock B: x= $147.25,
> For each data set: (a) Find the mean. (b) Find the standard deviation, treating the data as a sample. (c) Find the standard deviation, treating the data as a population. (d) What does this exercise show about the two formulas? Data Set A: 6, 7, 8 Data Se
> (a) Find the mean and standard deviation for each sample. (b) What does this exercise show about the standard deviation? Sample A: 6, 7, 8 Sample B: 61, 62, 63 Sample C: 1,000, 1,001, 1,002
> Estimate the mean from the following table of grouped data and frequencies. From То 2 6. 7 6. 10 12 10 14 3 14 18 2 18 22 1 Total 25 ν ν ν ν ν
> Estimate the mean from this table of grouped data and frequencies: From То 20 20 40 12 40 60 18 60 80 9 Total 44 v v v v
> For each data set, is the mode a good measure of center? Explain. a. Genders of 12 CEOS: М, М, F, M, F, М, М, М, F, M, M, М b. Ages of 10 college freshmen: c. Ages of 8 MBA students: 17, 17, 18, 18, 18, 18, 18, 18, 19, 20 24, 26, 27, 28, 30, 31, 33,
> For a sample of (X, Y) data values, the covariance is 48.724, the standard deviation of X is 11.724, and the standard deviation of Y is 8.244. (a) Find the sample correlation coefficient. (b) What does the sample correlation coefficient suggest about the
> A random sample of 25 items is drawn from a population whose standard deviation is unknown. The sample mean is x bar = 850 and the sample standard deviation is s = 15. Use Appendix D to find the values of Student’s t. a. Construct an interval estimate o
> Spirit Airlines kept track of the number of empty seats on flight 308 (DEN–DTW) for 10 consecutive trips on each weekday except Friday. (a) Sort the data for each day. (b) Find the mean, median, mode, midrange, geometric mean, and 10 percent trimmed mean
> For each X-Y data set (n 5 12): (a) Make a scatter plot. (b) Find the sample correlation coefficient. (c) Is there a linear relationship between X and Y? If so, describe it. Note: Use Excel or MegaStat or MINITAB if your instructor permits. Data Set
> An executive’s telephone log showed the lengths of 65 calls initiated during the last week of July. (a) Use Excel to find the quartiles. What do they tell you? (b) Find the midhinge. What does it tell you? (c) Make a box plot and interp
> CitiBank recorded the number of customers to use a downtown ATM during the noon hour on 32 consecutive workdays. (a) Use Excel to find the quartiles. What do they tell you? (b) Find the midhinge. What does it tell you? (c) Make a box plot and interpret i
> The city of Sonando Hills has 8 police officers. In January, the work-related medical expenses for each officer were 0, 0, 0, 0, 0, 0, 150, 650. (a) Calculate the mean, median, mode, midrange, and geometric mean. (b) Which measure of center would you use
> The Comer-Correr Taco Wagon is only open from 11:00 a.m. to 2:00 p.m. on Saturday. The owner kept track of the number of customers served on Saturday for 60 weeks. (a) Visually estimate the quartiles Q1, Q2, Q3. (b) Approximately how many customers were
> In the Excel function = TRIMMEAN(Data,.10), how many observations would be trimmed from each end of the sorted data array named Data if (a) n = 41, (b) n = 66, and (c) = 83?
> (a) For each data set, find the median, midrange, and geometric mean. (b) Are they reasonable measures of central tendency? Explain. a. Exam scores (9 students) b. GPAS (8 students) c. Class absences (12 students) 42, 55, 65, 67, 68, 75, 76, 78, 94
> On Friday night, the owner of Chez Pierre in downtown Chicago noted the amount spent for dinner for 28 four-person tables. (a) Find the mean, median, and mode. (b) Do these measures of center agree? Explain. (c) Make a histogram or dot plot. (d) Are the
> (a) For each data set, find the mean, median, and mode. (b) Discuss anything about the data that affects the usefulness of each statistic as a measure of center. 0, 0, 0, 0, 0, 1, 2, 3, 3, 5, 5, 15 a. Class absences (12 students): b. Exam scores (9
> A random sample of 10 items is drawn from a population whose standard deviation is unknown. The sample mean is xbar = 270 and the sample standard deviation is s = 20. Use Appendix D to find the values of Student’s t. a. Construct an interval estimate for
> An executive’s telephone log showed the lengths of 65 calls initiated during the last week of July. (a) Use Excel or MegaStat to sort and standardize the data. (b) Based on the standardized z scores, are there outliers? Unusual data val
> CitiBank recorded the number of customers to use a downtown ATM during the noon hour on 32 consecutive workdays. (a) Use Excel or MegaStat to sort and standardize the data. (b) Based on the Empirical Rule, are there outliers? Unusual data values? (c) Com
> Find the original data value corresponding to each standardized z-score. a. Student GPAs: Bob's z-score b. Weekly work hours: Sarah's z-score c. Bowling scores: Dave's z-score z = +1.71, µ = 2.98, ở = 0.36 z+118 , μ = 21.6, σ = 7.1 z-1.35, μ = 150,
> In a regional high school swim meet, women’s times (in seconds) in the 200-yard freestyle ranged from 109.7 to 126.2. Estimate the standard deviation, using the Empirical Rule.
> Convert each individual X data value to a standardized Z value and interpret it. a. Class exam: b. Student GPA: c. Weekly study hours: John's scor is 91,μ = 79, σ5 Mary's GPA is 3.18, µ = 2.87, o = 0.31 Jaime studies 18 hours, u = 15.0, o = 5.0
> Convert each individual data value to a standardized z-score. Is it an outlier? a. Ages of airline passengers: x = 92, μ = 46, σ = 13 b. Accounting exam scores: x = 70, μ = 81, σ = 6 c. Condo rental vacancy days: x = 28, μ = 22, σ = 7
> For each frequency distribution, suggest “nice” bins. Did your choice agree with Sturges’ Rule? If not, explain. a. Last week’s MPG for 35 student vehicles (xmin = 9.4, xmax = 38.7). b. Ages of 50 airplane passengers (xmin = 12, xmax = 85). c. GPAs of 2
> (a) Make a frequency distribution and histogram for the 2007 annual compensation of 40 randomly chosen CEOs (millions of dollars). (b) Describe the shape of the histogram. (c) Identify any unusual values. (Source: www.forbes.com.) 5.33 18.3 24.55 9.
> (a) Make a frequency distribution and histogram for the monthly off-campus rent paid by 30 students. (b) Repeat the exercise, using a different number of bins. Which is preferred? Why? 730 730 730 930 700 570 690 1,030 740 620 720 670 560 740 650 66
> (a) Make a frequency distribution and histogram (using appropriate bins) for these 28 observations on the amount spent for dinner for four in downtown Chicago on Friday night. (b) Repeat the exercise, using a different number of bins. Which is preferred
> For each value of d.f. look up the value of Student’s t in Appendix D for the stated level of confidence. How close is the t-value to the corresponding z-value (at the bottom of the column for d.f. = ∞ ) ? a. d.f. = 40, 95 percent confidence b. d.f. = 80
> There is a 70 percent chance that an airline passenger will check bags. In the next 16 passengers that check in for their flight at Denver International Airport, find the probability that (a) all will check bags; (b) fewer than 10 will check bags; (c) at
> (a) The table shows raw scores on a state civil service exam taken by 24 applicants for positions in law enforcement. Construct a frequency distribution and histogram, using nice (round) bin limits. (b) Describe the distribution and note any unusual feat
> (a) The table shows the number of days on the market for the 36 recent home sales in the city of Sonando Hills. Construct a frequency distribution and histogram, using nice (round) bin limits. (b) Describe the distribution and note any unusual features.
> What kind of survey (mail, telephone, interview, web, direct observation) would you recommend that a small laundry and dry cleaning business use for each of the following purposes, and why? a. To estimate the proportion of customers preferring opening h
> What kind of survey (mail, telephone, interview, web, direct observation) would you recommend for each of the following purposes, and why? What problems might be encountered? a. To estimate the proportion of students at your university who would prefer
> What sources of error might you encounter if you want to know (a) about the dating habits of college men, so you go to a dorm meeting and ask students how many dates they have had in the last year; (b) how often people attend religious services, so you s
> (a) Use Excel to prepare a 2-D pie chart for these web-surfing data. Modify the default colors, fonts, etc., as you judge appropriate to make the display effective. (b) Right-click the chart area, select Chart Type, and change to an exploded 2-D pie char
> (a) Use Excel to prepare a 2-D stacked column chart for television sales by year. Modify the colors, fonts, etc., to make the display effective. (b) Change your graph to a 3-D stacked column chart. Modify the chart if necessary to make it attractive. (c)
> Below are sorted data showing average spending per customer (in dollars) at 74 Noodles & Company restaurants. (a) Construct a frequency distribution. Explain how you chose the number of bins and the bin limits. (b) Make a histogram and describe its a
> (a) Make a stem-and-leaf plot for these 24 observations on the number of customers who used a downtown CitiBank ATM during the noon hour on 24 consecutive workdays. (b) Make a dot plot of the ATM data. (c) Describe these two displays. (Hint: Refer to cen
> Use the sample information x bar = 2.4, σ = 0.15, n = 9 to calculate the following confidence intervals for μ assuming the sample is from a normal population: (a) 90 percent confidence; (b) 95 percent confidence; (c) 99 percent confidence. (d) Describe h
> Which measurement level (nominal, ordinal, interval, ratio) is each of the following variables? Explain. a. Number of hits in Game 1 of the next World Series. b. Baltimore’s standing in the American League East (among fi ve teams). c. Field position of
> (a) Would the measurement level for the data collected from this Microsoft® survey question be nominal, ordinal, interval, or ratio? (b) Would a “6” response be considered twice as good as a â€
> Which measurement level (nominal, ordinal, interval, ratio) is the response to each question? If you think that the level of measurement is ambiguous, explain why. a. How would you describe your level of skill in using Excel? (check one) ❏ Low ❏ Medium
> When Pennsylvania repealed a law that required motorcycle riders to wear helmets, a news headline reported, “Deaths Soar After Repeal of Helmet Law.” After reading the story, Bill said, “But it’s just a correlation, not causation.” Do you agree with Bill
> Which measurement level (nominal, ordinal, interval, ratio) is each of the following variables? Explain. a. Number of passengers on Delta Flight 833. b. Waiting time (minutes) after gate pushback before Delta Flight 833 takes off. c. Brand of cell phone
> What logical or ethical problems do you see in these hypothetical scenarios? a. Dolon Privacy Consultants concludes that its employees are not loyal because a few samples of employee e-mails contained comments critical of the company’s management. b. Ca
> Which measurement level (nominal, ordinal, interval, ratio) is each of the following variables? Explain. a. Number of employees in the Walmart store in Hutchinson, Kansas. b. Number of merchandise returns on a randomly chosen Monday at a Walmart store.
> “Smokers are much more likely to speed, run red lights, and get involved in car accidents than nonsmokers.” (a) Can you think of reasons why this statement might be misleading? Hint: Make a list of six factors that you think would cause car accidents. Is
> A lottery winner told how he picked his six-digit winning number (5-6-8-10-22-39): number of people in his family, birth date of his wife, school grade of his 13-year-old daughter, sum of his birth date and his wife’s, number of years of marriage, and ye
> A study found that radar detector users have lower accident rates, wear their seat belts more, and even vote more than nonusers. (a) Assuming that the study is accurate, do you think there is cause-and- effect? (b) If everyone used radar detectors, would
> Find the interval within which 90 percent of the sample means would be expected to fall, assuming that each sample is from a normal population. a. μ = 100, σ = 12, n = 36 b. μ = 2,000, σ = 150, n = 9 c. μ = 500, σ = 10, n = 25
> A National Health Interview Survey conducted by the U.S. Centers for Disease Control reported that using a cell phone instead of a landline appeared to double a person’s chances of binge drinking. “I guess I’d better give up my cell phone,” said Bob. Whi
> (a) Make a frequency distribution and histogram for the 2007 annual compensation of 40 randomly chosen CEOs (millions of dollars). (b) Describe the shape of the histogram. (c) Identify any unusual values. (Source: www.forbes.com.) 5.33 18.3 24.55 9.
> Using your favorite web browser, enter the search string “business code of ethics.” List five examples of features that a business ethics code should have.
> The U.S. Public Interest Research Group Education Fund, USPIRG, recently published a report titled The Campus Credit Card Trap: A Survey of College Students about Credit Card Marketing. You can find this report and more information about campus credit ca
> (a) The table shows raw scores on a state civil service exam taken by 24 applicants for positions in law enforcement. Construct a frequency distribution and histogram, using nice (round) bin limits. (b) Describe the distribution and note any unusual feat
> (a) The table shows the number of days on the market for the 36 recent home sales in the city of Sonando Hills. Construct a frequency distribution and histogram, using nice (round) bin limits. (b) Describe the distribution and note any unusual features.
> (a) Should the average business school graduate expect to use computers to manipulate data, or is this a job better left to specialists? (b) What problems arise when an employee is weak in quantitative skills? Based on your experience, is that common?
> Give an example of how statistics might be useful to the person in the scenario. a. A personnel executive is examining job turnover by gender in different restaurants in a fast food chain. b. An intranet manager is studying e-mail usage rates by employe
> Give an example of how statistics might be useful to the person in the scenario. a. An auditor is looking for inflated broker commissions in stock transactions. b. An industrial marketer is representing her firm’s compact, new low-power OLED screens to t
> The Scottsdale fire department aims to respond to fire calls in 4 minutes or less, on average. State the hypotheses you would use if you had reason to believe that the fire department’s claim is not being met. Hint: Remember that sample data are used as
> The mean life of a certain computer hard disk in continual use is 8 years. (a) How long a warranty should be offered if the vendor wants to ensure that not more than 10 percent of the hard disks will fail within the warranty period? (b) Not more than 20
> Repeat the previous exercise, using α = .05. For each true value of μ, is the power higher or lower? Previous exercise: For a certain wine, the mean pH (a measure of acidity) is supposed to be 3.50 with a known standard deviation of σ = .10. The qualit
> What is the consequence of a false positive in a weekly inspection of a nuclear plant’s cooling system? Hint: The null hypothesis is the status quo (things are OK).
> For a certain wine, the mean pH (a measure of acidity) is supposed to be 3.50 with a known standard deviation of σ = .10. The quality inspector examines 25 bottles at random to test whether the pH is too low, using a left-tailed test at α = .01. (a) What
> Repeat the previous exercise, using α = .05. For each true value of π, is the power higher or lower? Previous exercise: A quality expert inspects 400 items to test whether the population proportion of defectives exceeds .03, using a right-tailed test a
> A quality expert inspects 400 items to test whether the population proportion of defectives exceeds .03, using a right-tailed test at α = .10. (a) What is the power of this test if the true proportion of defectives is π = .04? (b) If the true proportion
> A coin was flipped 12 times and came up heads 10 times. (a) Would we be justified in assuming that the sample proportion p is normally distributed? Explain. (b) Calculate a p-value for the observed sample outcome, using the normal distribution. At the .0
> The recent default rate on all student loans is 5.2 percent. In a recent random sample of 300 loans at private universities, there were 9 defaults. (a) Does this sample show sufficient evidence that the private university loan default rate is below the r
> To encourage telephone efficiency, a catalog call center issues a guideline that at least half of all telephone orders should be completed within 2 minutes. Subsequently, a random sample of 64 telephone calls showed that only 24 calls lasted 2 minutes or
> To combat antibiotic resistance, the Quality Improvement Consortium recommends a throat swab to confirm strep throat before a physician prescribes antibiotics to children under age 5. In a random sample of 60 children who received antibiotics for throat
> In a hospital’s shipment of 3,500 insulin syringes, 14 were unusable due to defects. (a) At α = .05, is this sufficient evidence to reject future shipments from this supplier if the hospital’s quality standard requires 99.7 percent of the syringes to be
> Between 2 a.m. and 4 a.m. at an all-night pizza parlor, the mean time between arrival of telephone pizza orders is 20 minutes. (a) Find the median wait for pizza order arrivals. (b) Explain why the median is not equal to the mean. (c) Find the upper quar
> Calculate the test statistic and p-value for each sample. a. H0: π < .60 versus H1: π > .60, α = .05, x = 56, n = 80 b. H0: π = .30 versus H1: π ≠ .30, α = .05, x = 18, n = 40 c. H0: π > .10 versus H1: π < .10, α = .01, x = 3, n = 100
> Interpret each p-value in your own words: a. p-value = .387, H0: π > .20, H1: π < .20, α = .10 b. p-value = .043, H0: π < .90, H1: π > .90, α = .05 c. p-value = .0012, H0: π = .50, H1: π ≠ .50, α = .01
> At Oxnard University, a sample of 18 senior accounting majors showed a mean cumulative GPA of 3.35 with a standard deviation of 0.25. (a) At α = .05 in a two-tailed test, does this differ significantly from 3.25 (the mean GPA for all business school seni
> The average age of a part-time seasonal employee at a Vail Resorts ski mountain has historically been 37 years. A random sample of 50 part-time seasonal employees in 2010 had a sample mean age of 38.5 years with a sample standard deviation equal to 16 ye
> A hotel installs smoke detectors with adjustable sensitivity in all public guest rooms. (a) State the null and alternative hypotheses. (b) Define Type I and II errors. (c) What are the consequences of each type of error, and to whom?
> The average weight of a package of rolled oats is supposed to be at least 18 ounces. A sample of 18 packages shows a mean of 17.78 ounces with a standard deviation of 0.41 ounce. (a) At the 5 percent level of significance, is the true mean smaller than t
> Which type of data (cross-sectional or time series) is each variable? a. Scores of 50 students on a midterm accounting exam last semester. b. Bob’s scores on 10 weekly accounting quizzes last semester. c. Average score by all takers of the state’s CPA e
> Sarah and Bob share a 1,000-minute cell phone calling plan. (a) Make a stacked dot plot to compare the lengths of cell phone calls by Sarah and Bob during the last week. (b) Describe what the dot plots tell you. Sarah’s calls: 1, 1, 1, 1, 2, 3, 3, 3, 5,
> Noodles & Company is interested in testing whether their new menu design helps reduce the average order time for their customers. Suppose that the average order time prior to the introduction of their new menu was 1.2 minutes. Write the hypotheses for a
> A manufacturer claims that its compact fluorescent bulbs contain an average of 2.5 mg of mercury. Write the hypotheses for a two-tailed test, using the manufacturer’s claim about the mean as the null hypothesis.

