Question: Find the first 40 terms of the
Find the first 40 terms of the sequence defined by
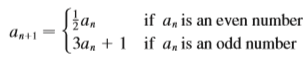
and a1 = 11. Do the same if a1 = 25. Make a conjecture about this type of sequence.
Transcribed Image Text:
if a, is an even number | 3a, + 1 if a, is an odd number
> Find the vertex, focus, and directrix of the parabola and sketch its graph. x2 = 6y
> Plot the point whose polar coordinates are given. Then find two other pairs of polar coordinates of this point, one with r > 0 and one with r (a) (1, 7/4) (b) (-2, 37/2) (c) (3, –7/3)
> Using the data from Exercise 29, find the distance traveled by the planet Mercury during one complete orbit around the sun. (If your calculator or computer algebra system evaluates definite integrals, use it. Otherwise, use Simpson’s Rule.) Data from Ex
> The distance from the dwarf planet Pluto to the sun is 4.43 × 10⁹ km at perihelion and 7.37 × 10⁹ km at aphelion. Find the eccentricity of Pluto’s orbit.
> The planet Mercury travels in an elliptical orbit with eccentricity 0.206. Its minimum distance from the sun is 4.6 × 10⁷ km. Find its maximum distance from the sun.
> Comet Hale-Bopp, discovered in 1995, has an elliptical orbit with eccentricity 0.9951. The length of the orbit’s major axis is 356.5 AU. Find a polar equation for the orbit of this comet. How close to the sun does it come? Dean Ket
> The orbit of Halley’s comet, last seen in 1986 and due to return in 2061, is an ellipse with eccentricity 0.97 and one focus at the sun. The length of its major axis is 36.18 AU. [An astronomical unit (AU) is the mean distance between the earth and the s
> Jupiter’s orbit has eccentricity 0.048 and the length of the major axis is 1.56 × 10⁹ km. Find a polar equation for the orbit
> The orbit of Mars around the sun is an ellipse with eccentricity 0.093 and semi major axis 2.28 × 10⁸ km. Find a polar equation for the orbit.
> Test the series for convergence or divergence. E tan(1/n) n-1
> Show that a conic with focus at the origin, eccentricity e, and directrix y = -d has polar equation ed r = 1- e sin0
> Show that a conic with focus at the origin, eccentricity e, and directrix y = d has polar equation ed r = 1 + e sin 0
> Show that a conic with focus at the origin, eccentricity e, and directrix x = -d has polar equation ed 1- e cos 0
> (a) Find the eccentricity, (b) identify the conic, (c) give an equation of the directrix, and (d) sketch the conic. 4 r = 2 + 3 cos 0
> (a) Find the eccentricity, (b) identify the conic, (c) give an equation of the directrix, and (d) sketch the conic. 3 r = 4 - 8 cos 0
> (a) Find the eccentricity, (b) identify the conic, (c) give an equation of the directrix, and (d) sketch the conic. 1 3 – 3 sin0
> Test the series for convergence or divergence. 1 A 2 + sin k
> (a) Find the eccentricity, (b) identify the conic, (c) give an equation of the directrix, and (d) sketch the conic. 6 + 2 cos 0
> (a) Find the eccentricity, (b) identify the conic, (c) give an equation of the directrix, and (d) sketch the conic. 5 r = 2 – 4 cos 0
> (a) Find the eccentricity, (b) identify the conic, (c) give an equation of the directrix, and (d) sketch the conic. r = 3 + 3 sin 0
> (a) Find the eccentricity, (b) identify the conic, (c) give an equation of the directrix, and (d) sketch the conic. 1 r = 2 + sin 0
> (a) Find the eccentricity, (b) identify the conic, (c) give an equation of the directrix, and (d) sketch the conic. 4 r = 5 - 4 sin 0
> Write a polar equation of a conic with the focus at the origin and the given data. Hyperbola, eccentricity 2, directrix r = -2 sec0
> Write a polar equation of a conic with the focus at the origin and the given data. Parabola, vertex (3, 7/2)
> Write a polar equation of a conic with the focus at the origin and the given data. Ellipse, eccentricity 0.6, directrix r = 4 csc 0
> Write a polar equation of a conic with the focus at the origin and the given data. Ellipse, eccentricity, vertex (2, 1) TT
> Write a polar equation of a conic with the focus at the origin and the given data. Hyperbola, eccentricity 3, directrix x 3
> Test the series for convergence or divergence. E(-1)" cos(1/n²) n-
> Write a polar equation of a conic with the focus at the origin and the given data. Hyperbola, eccentricity 1.5, directrix y = 2
> Write a polar equation of a conic with the focus at the origin and the given data. Parabola, directrix x = -3
> Write a polar equation of a conic with the focus at the origin and the given data. Ellipse, eccentricity , directrix x= 4
> The size of an undisturbed fish population has been modeled by the formula where pn is the fish population after n years and a and b are positive constants that depend on the species and its environment. Suppose that the population in year 0 is p0 > 0
> (a) Show that if / then / is convergent and / (b) If a1 = 1 and / find the first eight terms of the sequence /. Then use part (a) to show that /This gives the continued fraction expansion lima-a Aza L and lim,o arn+1 = L,
> Let a and b be positive numbers with a > b. Let a1 be their arithmetic mean and b1 their geometric mean: Repeat this process so that, in general, (a) Use mathematical induction to show that (b) Deduce that both / are convergent. (c) Show that / Gauss
> Test the series for convergence or divergence. K – 1 Σ k(VR + 1) k-1
> (a) Use a graph to guess the value of the limit (b) Use a graph of the sequence in part (a) to find the smallest values of N that correspond to / = 0.1 and / = 0.001 in Definition 2. n' lim 0 n!
> (a) Let a1 = a, a2 = f(a), a3 = f(a2) = f(f(an)) ,……. , = an+1 = f(an), where f is a continuous function. If / (b) Illustrate part (a) by taking / and estimating the value of L to five decimal places.
> (a) Fibonacci posed the following problem: Suppose that rabbits live forever and that every month each pair produces a new pair which becomes productive at age 2 months. If we start with one newborn pair, how many pairs of rabbits will we have in the nth
> Show that the sequence defined by satisfies 0 1 aj = 2 an+1 3 - an
> Show that the sequence defined by is increasing and an aj = 1 An+1 = 3 an
> Find the limit of the sequence 2, /2, v2 /2 /2
> Determine whether the sequence is increasing, decreasing, or not monotonic. Is the sequence bounded? а, — п3 — Зп + 3 n
> Determine whether the sequence is increasing, decreasing, or not monotonic. Is the sequence bounded? а, — 3 — 2пе 2ne
> Test the series for convergence or divergence. In n E(-1)":
> Determine whether the sequence is increasing, decreasing, or not monotonic. Is the sequence bounded? (-1)" а, — 2 + n
> Determine whether the sequence is increasing, decreasing, or not monotonic. Is the sequence bounded? а, — п(-1)"
> Determine whether the sequence is increasing, decreasing, or not monotonic. Is the sequence bounded? 1-n an 2 + n
> Determine whether the sequence is increasing, decreasing, or not monotonic. Is the sequence bounded? 1 an 2n + 3
> Determine whether the sequence is increasing, decreasing, or not monotonic. Is the sequence bounded? а, cos n
> A fish farmer has 5000 catfish in his pond. The number of catfish increases by 8% per month and the farmer harvests 300 catfish per month. (a) that the catfish population Pn after n months is given recursively by (b) How many catfish are in the pond afte
> Test the series for convergence or divergence. (-1)"-1 Vn - 1 R-2
> If you deposit $100 at the end of every month into an account that pays 3% interest per year compounded monthly, the amount of interest accumulated after n months is given by the sequence (a) Find the first six terms of the sequence. (b) How
> If $1000 is invested at 6% interest, compounded annually, then after n years the investment is worth an = 1000(1.06)n dollars. (a) Find the first five terms of the sequence /. (b) Is the sequence convergent or divergent? Explain.
> (a) Determine whether the sequence defined as follows is convergent or divergent: (b) What happens if the first term is a1 = 2? aj = 1 An+1 = 4 - a, for n> 1
> Use a graph of the sequence to decide whether the sequence is convergent or divergent. If the sequence is convergent, guess the value of the limit from the graph and then prove your guess. (See the margin note on page 699 for advice on graphing sequences
> Use a graph of the sequence to decide whether the sequence is convergent or divergent. If the sequence is convergent, guess the value of the limit from the graph and then prove your guess. (See the margin note on page 699 for advice on graphing sequences
> Use a graph of the sequence to decide whether the sequence is convergent or divergent. If the sequence is convergent, guess the value of the limit from the graph and then prove your guess. (See the margin note on page 699 for advice on graphing sequences
> Use a graph of the sequence to decide whether the sequence is convergent or divergent. If the sequence is convergent, guess the value of the limit from the graph and then prove your guess. (See the margin note on page 699 for advice on graphing sequences
> Use a graph of the sequence to decide whether the sequence is convergent or divergent. If the sequence is convergent, guess the value of the limit from the graph and then prove your guess. (See the margin note on page 699 for advice on graphing sequences
> Use a graph of the sequence to decide whether the sequence is convergent or divergent. If the sequence is convergent, guess the value of the limit from the graph and then prove your guess. (See the margin note on page 699 for advice on graphing sequences
> Use a graph of the sequence to decide whether the sequence is convergent or divergent. If the sequence is convergent, guess the value of the limit from the graph and then prove your guess. (See the margin note on page 699 for advice on graphing sequences
> Test the series for convergence or divergence. • 3. 5. .... (2n – 1) 2.5.8... (Зп — 1) (Зл — R-1
> Find the Taylor polynomial T3(x) for the function f centered at the number a. Graph f and T3 on the same screen. f(x) = tan-'x, а—1
> Explain why species that overlap a great deal in their fundamental niches have a high probability of competing. Now explain why species that overlap a great deal in their realized niches and live in the same area probably do not compete significantly.
> Researchers have characterized the niches of Darwin’s finches by beak size (which correlates with diet) and the niches of salt marsh grasses by position in the intertidal zone. How would you characterize the niches of sympatric canid species such as red
> Explain how self-thinning in field populations of plants can be used to support the hypothesis that intraspecific competition a common occurrence among natural plant populations is.
> How can the results of greenhouse experiments on competition help us understand the importance of competition among natural populations? How can a researcher enhance the correspondence of results between greenhouse experiments and the field situation?
> Design a greenhouse (glasshouse) experiment to test for intraspecific competition within a population of herbaceous plants. Specify the species of plant, the volume (or size of pot) and source of soil, the potentially limiting resource you will focus on
> How is plant allocation to roots versus shoots similar to plant regulation of temperature and water? Consider discussing these processes under the more general heading of homeostasis. (Hint: Homeostasis is the maintenance of a relatively constant intern
> Apply Winemiller’s model to plants. If you were to construct a strictly quantitative classification of plant life histories using Winemiller and Rose’s approach, what information would you need about the plants include
> Using what you know about the trade-off between seed number and seed size (e.g., fig. 12.7) and patterns of variation among plants, predict the relative number of seeds produced by the various plant growth forms and dispersal strategies liste
> Once established, Rio Grande cottonwoods can live to be well over 100 years old. However, they experience very high rates of mortality as seeds, which only germinate in conditions that occur very unpredictably in time and space. Female cottonwood trees p
> Grime’s proposed classification of environments based on intensity of disturbance and stress resulted in four environments, three of which he proposed were inhabitable by plants and one of which was not. That fourth environment shows high intensity of di
> Review the long-term atmospheric CO 2 record as revealed by studies of air trapped in ice cores. What is the evidence that burning of fossil fuels is responsible for recent increases in atmospheric CO 2 concentrations?
> Below about 600 to 1,000 m in the oceans there is no sunlight. However, many of the fish and invertebrates at these depths have eyes. In contrast, fish living in caves are often blind. What selective forces could maintain eyes in populations of deepsea f
> The studies by Shine and Charnov (1992) and Gunderson (1997) addressed important questions of concern to life history ecologists and their work provided robust answers to those questions. However, the methods they employed differed substantially from tho
> Plant ecologists using experimental studies have verified that seedlings growing from larger seeds have a better chance of surviving environmental challenges such as deep shade, drought, physical injury, and competition from other plants. Explain how gro
> Under what conditions should natural selection favor production of many small offspring versus the production of a few well provisioned offspring?
> The discussion of seed size and number focused mainly on the advantages associated with large seeds. However, research by Westoby, Leishman, and Lord has revealed that the plants from widely separated geographic regions produce a wide variety of seed siz
> What factors will determine the earth’s carrying capacity for Homo sapiens? Explain why the earth’s long-term (thousands of years) carrying capacity for the human population may be much lower than the projected population size for the year 2050. Now argu
> Where on earth is human population density highest? Where is it lowest? Where on earth do no people live? Where are human populations growing the fastest? Where are they approximately stable?
> Population biologists may refer to abiotic factors, such as temperature and moisture, as density-independent because such factors can affect population processes independently of local population density. At the same time, biotic factors, such as disease
> Both abiotic and biotic factors influence birthrates and death rates in populations. Make a list of abiotic and biotic factors that are potentially important regulators of natural populations.
> What is the relationship between per capita rate of increase, r, and the intrinsic rate of increase, rmax? In chapter 10, we estimated r from the life tables and fecundity schedules of two species. How would you estimate rmax?
> Skole and Tucker (1993) documented the rate and extent of recent deforestation in the Amazon Basin in Brazil. This is a prominent example of the land cover changes that likely threaten biological diversity. However, scientists have documented agricultura
> In question 3, you thought about how the logistic growth equation produces a sigmoidal growth curve. Now, let’s think about nature. What is it about the natural environment that produces sigmoidal growth? Pick a real organism living in an environment wit
> How do you build the logistic model for population growth from the exponential model? What part of the logistic growth equation produces the sigmoidal growth curve?
> While populations of gray and blue whales have grown rapidly, the North Atlantic right whale population remains dangerously small despite many decades of complete protection. Assuming that differences in population growth rates are determined by whale li
> For what types of organisms is the geometric model of population growth appropriate? For what types of organisms is the exponential model of population growth appropriate? In what circumstances would a population grow exponentially? In what circumstances
> C. S. Holling (1959) observed predator numerical responses to changes in prey density. He attributed the numerical responses to changes in the reproductive rates of the predators. Discuss a hypothetical example of reproductive-rate numerical response by
> From a life table and a fecundity schedule, you can estimate the geometric rate of increase, l, the average reproductive rate, R0 , the generation time, T, and the per capita rate of increase, r. That is a lot of information about a population. What mini
> What values of R0 indicate that a population is growing, stable, or declining? What values of r indicate a growing, stable, or declining population?
> Concept 10.5 says that we can use the information in life tables and fecundity schedules to estimate some characteristics of populations (R0, T, r). Why does Concept 10.5 use the word “estimate” rather than “calculate”? In putting together your answer, t
> Draw hypothetical age structures for growing, declining, and stable populations. Explain how the age structure of a population with highly episodic reproduction might be misinterpreted as indicating population decline. How might population ecologists avo
> Population ecologists have assumed that populations of species with very high reproductive rates, those with offspring sometimes numbering in the millions per female, must have a type III survivorship curve even though very few survivorship data exist fo
> Ecologists predict that global diversity is threatened by land use change and by the reductions in habitat area and the fragmentation that accompany land use change. Vitousek (1994) suggested that land use change may be the greatest current threat to bio
> Of the three survivorship curves, type III has been the least documented by empirical data. Why is that? What makes this pattern of survivorship difficult to study?
> Compare cohort and static life tables. What are the main assumptions of each? In what situations or for what organisms would it be practical to use either?
> Outline Müller’s (1954, 1974) colonization cycle. If you were studying the colonization cycle of the freshwater snail Neritina latissima, how would you follow colonization waves upstream? How would you verify that these colonization waves gain individual
> Can the analyses by Damuth (1981) and by Peters and Wassenberg (1983) be combined with that of Rabinowitz (1981) to make predictions about the relationship of animal size to its relative rarity? What two attributes of rarity, as defined by Rabinowitz, ar

