Question: Graph the region R bounded by the
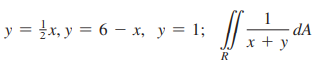
Graph the region R bounded by the graphs of the indicated equations. Describe R in set notation with double inequalities, and evaluate the indicated integral.
> refer to the following transition matrix P and its powers: Find the probability of going from state B to state C in two trials.
> use the given information to draw the transition diagram and find the transition matrix. A Markov chain has three states, A, B, and C. The probability of going from state A to state B in one trial is 1. The probability of going from state B to state A in
> use the given information to draw the transition diagram and find the transition matrix. A Markov chain has two states, A and B. The probability of going from state A to state A in one trial is .6, and the probability of going from state B to state B in
> are there unique values of a, b, and c that make P a transition matrix? If so, complete the transition matrix and draw the corresponding transition diagram. If not, explain why.
> are there unique values of a, b, and c that make P a transition matrix? If so, complete the transition matrix and draw the corresponding transition diagram. If not, explain why.
> are there unique values of a, b, and c that make P a transition matrix? If so, complete the transition matrix and draw the corresponding transition diagram. If not, explain why.
> discuss the validity of each statement. If the statement is always true, explain why. If not, give a counterexample. The constant function k(x) = 0 is an antiderivative of the constant function (x) = p.
> is there a unique way of filling in the missing probabilities in the transition diagram? If so, complete the transition diagram and write the corresponding transition matrix. If not, explain why.
> is there a unique way of filling in the missing probabilities in the transition diagram? If so, complete the transition diagram and write the corresponding transition matrix. If not, explain why.
> is there a unique way of filling in the missing probabilities in the transition diagram? If so, complete the transition diagram and write the corresponding transition matrix. If not, explain why.
> Could the given matrix be the transition matrix of a Markov chain?
> Could the given matrix be the transition matrix of a Markov chain?
> Could the given matrix be the transition matrix of a Markov chain?
> Could the given matrix be the transition matrix of a Markov chain?
> Find the transition diagram that corresponds to the transition matrix of Problem 21. Matrix of Problem 21:
> Find the transition matrix that corresponds to the transition diagram of Problem 15. Diagram from Problem 15:
> use the transition diagram to find S1 and S2 for the indicated initial state matrix S0.
> Find each indefinite integral and check the result by differentiating.
> use the transition diagram to find S1 and S2 for the indicated initial state matrix S0.
> use the transition diagram to find S1 and S2 for the indicated initial state matrix S0.
> use the transition matrix to find S1 and S2 for the indicated initial state matrix S0.
> use the transition matrix to find S1 and S2 for the indicated initial state matrix S0.
> use the transition matrix to find S1 and S2 for the indicated initial state matrix S0.
> Use the transition diagram To find S1 and S2 for the indicated initial state matrix S0.
> Use the transition diagram To find S1 and S2 for the indicated initial state matrix S0.
> Use the transition diagram To find S1 and S2 for the indicated initial state matrix S0.
> Use the transition matrix find S1 and S2 for the indicated initial state matrix S0.
> Use the transition matrix find S1 and S2 for the indicated initial state matrix S0.
> Is F(x) = (ex – 10)(ex + 10) an antiderivative of ( (x) = 2e2x ? Explain.
> Use the transition matrix find S1 and S2 for the indicated initial state matrix S0.
> graph the region R bounded by the graphs of the equations. Use set notation and double inequalities to describe R as a regular x region and a regular y region and as a regular x region or a regular y region, whichever is simpler.
> graph the region R bounded by the graphs of the equations. Use set notation and double inequalities to describe R as a regular x region and a regular y region.
> evaluate each iterated integral.
> evaluate each iterated integral.
> evaluate each iterated integral.
> Repeat Problem 57 for the region bounded by y = 0 and y = 5 - 0.2x2 . Data from Problem 57: An industrial plant is located on the lakefront of a city. Let (0, 0) be the coordinates of the plant. The city's residents live in the region R bounded by y = 0
> The floor of a concert hall is the region bounded by x = 0 and x = 100 - 0.04y2. The ceiling lies on the graph of ((x, y) = 50 - 0.0025x2 . (Each unit on the x, y, and z axes represents one foot.) Find the volume of the concert hall (in cubic feet). The
> The floor of an art museum gallery is the region bounded by x = 0, x = 40, y = 0, and y = 50 - 0.3x. The ceiling lies on the graph of ((x, y) = 25 - 0.125x. (Each unit on the x, y, and z axes represents one foot.) Find the volume of the atrium (in cubic
> use a graphing calculator to graph the region R bounded by the graphs of the indicated equations. Use approximation techniques to find intersection points correct to two decimal places. Describe R in set notation with double inequalities, and evaluate th
> Find each indefinite integral and check the result by differentiating.
> use a graphing calculator to graph the region R bounded by the graphs of the indicated equations. Use approximation techniques to find intersection points correct to two decimal places. Describe R in set notation with double inequalities, and evaluate th
> use a graphing calculator to graph the region R bounded by the graphs of the indicated equations. Use approximation techniques to find intersection points correct to two decimal places. Describe R in set notation with double inequalities, and evaluate th
> reverse the order of integration for each integral. Evaluate the integral with the order reversed. Do not attempt to evaluate the integral in the original form.
> reverse the order of integration for each integral. Evaluate the integral with the order reversed. Do not attempt to evaluate the integral in the original form.
> find the volume of the solid under the graph of ((x, y) over the region R bounded by the graphs of the indicated equations. Sketch the region R; the solid does not have to be sketched.
> find the volume of the solid under the graph of ((x, y) over the region R bounded by the graphs of the indicated equations. Sketch the region R; the solid does not have to be sketched.
> Evaluate each integral. Graph the region of integration, reverse the order of integration, and then evaluate the integral with the order reversed.
> Evaluate each integral. Graph the region of integration, reverse the order of integration, and then evaluate the integral with the order reversed.
> Evaluate each integral. Graph the region of integration, reverse the order of integration, and then evaluate the integral with the order reversed.
> Is F(x) = an antiderivative of ((x)= 13x - 223 ? Explain.
> Graph the region R bounded by the graphs of the indicated equations. Describe R in set notation with double inequalities, and evaluate the indicated integral.
> Graph the region R bounded by the graphs of the indicated equations. Describe R in set notation with double inequalities, and evaluate the indicated integral.
> use the description of the region R to evaluate the indicated integral.
> use the description of the region R to evaluate the indicated integral.
> use the description of the region R to evaluate the indicated integral.
> Give a verbal description of the region R and determine whether R is a regular x region, a regular y region, both, or neither.
> Give a verbal description of the region R and determine whether R is a regular x region, a regular y region, both, or neither.
> Evaluate each integral
> Evaluate each integral
> graph the region R bounded by the graphs of the equations. Use set notation and double inequalities to describe R as a regular x region and a regular y region and as a regular x region or a regular y region, whichever is simpler.
> Find each indefinite integral and check the result by differentiating.
> Find each antiderivative. Then use the antiderivative to evaluate the definite integral.
> find each antiderivative.
> find each antiderivative.
> find each antiderivative.
> Repeat Problem 57 for a group with mental ages between 6 and 14 years and chronological ages between 8 and 10 years. Data from Problem 57: The intelligence quotient Q for a person with mental age x and chronological age y is given by In a group of sixth
> Repeat Problem 55 for cars weighing between 2,000 and 2,500 pounds and traveling at speeds between 40 and 50 miles per hour. Data from Problem 55: Under ideal conditions, if a person driving a car slams on the brakes and skids to a stop, the length of t
> Repeat Problem 53 if the boundaries of the town form a rectangle 8 miles long and 4 miles wide and the concentration of particulate matter is given by C = 64 - 3d2 Data from Problem 54: A heavy industrial plant located in the center of a small town emi
> Repeat Problem 51 for a square habitat that measures 12 feet on each side, where the insect concentration is given by Data from Problem 51: In order to study the population distribution of a certain species of insect, a biologist has constructed an arti
> Repeat Problem 49 for Data from Problem 49: If an industry invests x thousand labor-hours, 10 ≤ x ≤ 20, and $y million, 1 ≤ y ≤ 2, in the production of N thousand units of a
> Repeat Problem 47 if 6 ≤ y ≤ 10 and 0.7 ≤ x ≤ 0.9. Data from Problem 47: Suppose that Congress enacts a onetime-only 10% tax rebate that is expected to infuse $y billion, 5 ≤ y ≤ 7, into the economy. If every person and every corporation is expected to
> Is F(x) = x ln x - x + e an antiderivative of ((x) = ln x? Explain.
> Find the dimensions of the square S centered at the origin for which the average value of ((x, y) = x2ey over S is equal to 100.
> (A) Find the average values of the functions (B) Does the average value of k(x, y) = xn + yn over the rectangle increase or decrease as n increases? Explain. (C) Does the average value of k(x, y) = xn + yn over the rectangle increase or decrease as
> Evaluate each double integral . Select the order of integration carefully; each problem is easy to do one way and difficult the other.
> Evaluate each double integral . Select the order of integration carefully; each problem is easy to do one way and difficult the other.
> find the volume of the solid under the graph of each function over the given rectangle.
> find the volume of the solid under the graph of each function over the given rectangle.
> find the average value of each function over the given rectangle.
> find the average value of each function over the given rectangle.
> Use both orders of iteration to evaluate each double integral.
> Use both orders of iteration to evaluate each double integral.
> Find each indefinite integral and check the result by differentiating.
> could the given matrix be the transition matrix of an absorbing Markov chain?
> Evaluate each iterated integral. (See the indicated problem for the evaluation of the inner integral.)
> Evaluate each iterated integral. (See the indicated problem for the evaluation of the inner integral.)
> Evaluate each iterated integral. (See the indicated problem for the evaluation of the inner integral.)
> Evaluate each iterated integral. (See the indicated problem for the evaluation of the inner integral.)
> Evaluate each iterated integral. (See the indicated problem for the evaluation of the inner integral.)
> Find each antiderivative. Then use the antiderivative to evaluate the definite integral.
> Find each antiderivative. Then use the antiderivative to evaluate the definite integral.
> Find each antiderivative. Then use the antiderivative to evaluate the definite integral.
> Find each antiderivative. Then use the antiderivative to evaluate the definite integral.
> find the least squares line. Graph the data and the least squares line.
> Is F(x) = 12x + 521x - 62 an antiderivative of ((x) = 4x - 7? Explain.
> find the least squares line. Graph the data and the least squares line.
> Refer to the n = 5 data points (x1, y1) = (0, 4), (x2, y2) = (1, 5), (x3, y3) = (2, 7), (x4, y4) = (3, 9), and (x5, y5) = (4, 13). Calculate the indicated sum or product of sums.
> Refer to the n = 5 data points (x1, y1) = (0, 4), (x2, y2) = (1, 5), (x3, y3) = (2, 7), (x4, y4) = (3, 9), and (x5, y5) = (4, 13). Calculate the indicated sum or product of sums.
> Refer to the n = 5 data points (x1, y1) = (0, 4), (x2, y2) = (1, 5), (x3, y3) = (2, 7), (x4, y4) = (3, 9), and (x5, y5) = (4, 13). Calculate the indicated sum or product of sums.
> Data on U.S. organic food sales (in billions of dollars) are given in the table for the years 2005 through 2015. (A) Find the least-squares line for the data using x = 0 for 2000. (B) Use the least-squares line to estimate U.S. organic food sales in 2

