Question: In each chapter of this book, we
In each chapter of this book, we use a a fictitious company, Performance Lawn Equipment (PLE), within a case exercise for applying the tools and techniques introduced in the chapter.31 To put the case in perspective, we first provide some background about the company, so that the applications of business analytic tools will be more meaningful.
PLE, headquartered in St. Louis, Missouri, is a privately owned designer and producer of traditional lawn mowers used by homeowners. In the past ten years, PLE has added another key product, a medium-size diesel power lawn tractor with front and rear power takeoffs, Class I three-point hitches, four-wheel drive, power steering, and full hydraulics. This equipment is built primarily for a niche market consisting of large estates, including golf and country clubs, resorts, private estates, city parks, large commercial complexes, lawn care service providers, private homeowners with five or more acres, and government (federal, state, and local) parks, building complexes, and military bases. PLE provides most of the products to dealerships, which, in turn, sell directly to end users. PLE employs 1,660 people world-wide. About half the workforce is based in St. Louis; the remainder is split among their manufacturing plants.
In the United States, the focus of sales is on the eastern seaboard, California, the Southeast, and the south central states, which have the greatest concentration of customers. Outside the United States, PLE’s sales include a European market, a growing South American market, and developing markets in the Pacific Rim and China. Both end users and dealers have been established as important customers for PLE. Collection and analysis of end-user data showed that satisfaction with the products depends on high quality, easy attachment/dismount of implements, low maintenance, price value, and service.
For dealers, key requirements are high quality, parts and feature availability, rapid restock, discounts, and timeliness of support. PLE has several key suppliers: Mitsitsiu, Inc., the sole source of all diesel engines; LANTO Axles, Inc., which provides tractor axles; Schorst Fabrication, which provides subassemblies; Cuberillo, Inc, supplier of transmissions; and Specialty Machining, Inc., a supplier of precision machine parts.
To help manage the company, PLE managers have developed a “balanced scorecard†of measures. These data, which are summarized shortly, are stored in the form of a Microsoft Excel workbook (Performance Lawn Equipment) accompanying this book. The database contains various measures captured on a monthly or quarterly basis and is used by various managers to evaluate business performance. Data for each of the key measures are stored in a separate worksheet. A summary of these worksheets is given next:
■Dealer Satisfaction, measured on a scale of 1–5 (1 = poor, 2 = less than average, 3 = average, 4 = above average, and 5 = excellent). Each year, dealers in each region are surveyed about their overall satisfaction with PLE. The worksheet contains summary data from surveys for the past five years.
â– End-User Satisfaction, measured on the same scale as dealers. Each year, 100 users from each region are surveyed. The worksheet contains summary data for the past five years.
■Customer Survey, results from a survey for customer ratings of specific attributes of PLE tractors: quality, ease of use, price, and service on the same 1–5 scale. This sheet contains 200 observations of customer ratings.
■Complaints, which shows the number of complaints registered by all customers each month in each of PLE’s five regions (North America, South America, Europe, the Pacific, and China).
â– Mower Unit Sales and Tractor Unit Sales, which provide sales by product by region on a monthly basis. Unit sales for each region are aggregated to obtain world sales figures.
â– Industry Mower Total Sales and Industry Tractor Total Sales, which list the number of units sold by all producers by region.
â– Unit Production Costs, which provides monthly accounting estimates of the variable cost per unit for manufacturing tractors and mowers over the past five years.
â– Operating and Interest Expenses, which provides monthly administrative, depreciation, and interest expenses at the corporate level.
■On-Time Delivery, which provides the number of deliveries made each month from each of PLE’s major suppliers, the number on time, and the percent on time.
â– Defects After Delivery, which shows the number of defects in supplier-provided material found in all shipments received from suppliers.
â– Time to Pay Suppliers, which provides measurements in days from the time the invoice is received until payment is sent.
â– Response Time, which gives samples of the times taken by PLE customer-service personnel to respond to service calls by quarter over the past two years.
â– Employee Satisfaction, which provides data for the past four years of internal surveys of employees to determine their overall satisfaction with their jobs, using the same scale used for customers. Employees are surveyed quarterly, and results are stratified by employee category: design and production, managerial, and sales/administrative support.
In addition to these business measures, the PLE database contains worksheets with data from special studies:
â– Engines, which lists 50 samples of the time required to produce a lawn mower blade using a new technology.
â– Transmission Costs, which provides the results of 30 samples each for the current process used to produce tractor transmissions and two proposed new processes.
â– Blade Weight, which provides samples of mower blade weights to evaluate the consistency of the production process.
â– Mower Test, which lists test results of mower functional performance after assembly for 30 samples of 100 units each.
â– Employee Retention, data from a study of employee duration (length of hire) with PLE. The 40 subjects were identified by reviewing hires from ten years prior and identifying those who were involved in managerial positions (either hired into management or promoted into management) at some time in this ten year period.
â– Shipping Cost, which gives the unit shipping cost for mowers and tractors from existing and proposed plants for a supply chain design study.
â– Fixed Cost, which lists the fixed cost to expand existing plants or build new facilities, also as part of the supply chain design study.
â– Purchasing Survey, which provides data obtained from a third-party survey of purchasing managers of customers of Performance Lawn Care.
Elizabeth Burke has recently joined the PLE management team to oversee production operations. She has reviewed the types of data that the company collects and has assigned you the responsibility to be her chief analyst in the coming weeks. She has asked you to do some preliminary analysis of the data for the company.
1. First, she would like you to edit the worksheets Dealer Satisfaction and End-User Satisfaction to display the total number of responses to each level of the survey scale across all regions for each year.
2. Second, she wants a count of the number of failures in the worksheet Mower Test.
3. Next, Elizabeth has provided you with prices for PLE products for the past five years:
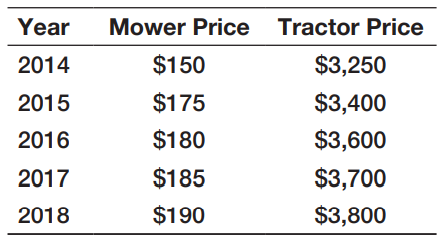
Create a new worksheet to compute gross revenues by month and region, as well as worldwide totals, for each product using the data in Mower Unit Sales and Tractor Unit Sales.
4. Finally, she wants to know the market share for each product and region by month based on the PLE and industry sales data, and the average market share by region over the five years.
Summarize all your findings in a report to Ms. Burke.
> The time required to play a game of Battleship™ is uniformly distributed between 20 and 60 minutes. a. Find the expected value and variance of the time to complete the game. b. What is the probability of finishing within 30 minutes? c. What is the probab
> The number and frequency of hurricanes over a certain ocean, annually from 1945 through 2020, is shown here. For instance, this means that no hurricanes occurred during 6 of these years, only one hurricane occurred in 16 of these years, and so on. a. Fin
> A life insurance consultant sells three life insurance policies on an average per week for which she receives a fee. Use Poisson’s distribution to calculate the probability that in a given week she will sell a. some policies. b. two or more policies but
> A transport company is inspecting 80 trucks it owns. The inspection determines that the probability of trucks failing the inspection is 0.25. Find the probability that not more than 10 trucks failed the inspection. What is the probability that 75 or more
> The background for this case was introduced in Chapter 2. This is a continuation of the case in Chapter 4. For this part of the case, compute confidence intervals for means and proportions and analyze the sampling errors, possibly suggesting larger sampl
> A popular resort hotel has 300 rooms and is usually fully booked. About 7% of the time a reservation is canceled before the 6:00 p.m. deadline with no penalty. What is the probability that at least 285 rooms will be occupied? Use the binomial distributio
> A glass jar contains 10 balls with labels of numbers 1 to 10. Two balls are randomly selected from the glass jar without replacement. a. Determine the number of combinations possible in the sample space. List all possible elements of the sample space. b.
> During one 12-week period, a particular mutual fund outperformed the S&P 500 index 37 out of 60 days. Find the probability that it would perform as well or better again.
> A major application of analytics in marketing is determining customer retention. Suppose that the probability of a long-distance carrier’s customer leaving for another carrier from one month to the next is 0.16. What distribution models the retention of
> From a bag full of colored balls (red, blue, green, and orange), a few are picked out and replaced. This is done 1,000 times and the number of times each colored ball is picked out is, blue balls = 300, red balls =200, green balls = 450, and orange balls
> Padini Concept, a local retail store in Malaysia, recorded the number of shoes purchased by customers (1 pairs, 2 pairs and 3 pairs) based on the number of clothes purchased (1, 2, and 3) for a random sample of 250 customers. The following data was recor
> The number of children per family was determined and summarized in the following table. Find the expected number, variance, and standard deviation of the number of children per family.
> A consumer products company found that 44% of successful products also received favorable results from test market research, whereas 11% had unfavorable results but nevertheless were successful. That is, P(successful product and favorable test market) =
> The students at Skövde University, Sweden, have elected five candidates to represent them on the college management council. The committee summarized the age and gender of the members as follows: This group of student representatives decide
> Based on the scenario in Problem 3, what is the probability of first selecting ball 1 and then selecting ball 3? Will it be different if the first ball is replaced in the glass jar? Explain the difference between these two scenarios. Data from Problem 3
> PLE has developed a prototype for a new snow blower for the consumer market. This can exploit the company’s expertise in small-gasoline-engine technology and also balance seasonal demand cycles in the North American and European markets to provide additi
> A survey of shopping habits found the percentage of respondents that use technology for shopping as shown in Figure 5.30. For example, 17.39% only use online coupons; 21.74% use online coupons and check prices online before shopping, and so on. a. What i
> A grocery shop is taking stock of its inventory. The shopkeeper found that out of 120 tins with damaged labels, there are 50 tins of beans, 20 tins of sardines, 35 tins of processed meat, and the rest are tins of soup. a. Find the probability that the ti
> Sue and Dave always spend their evenings together, either cycling or playing computer games. On an evening with good weather, the probability that Sue prefers cycling is 0.7 and for Dave it is 0.4. Find the probability that on a particular fine evening,
> In the past week, an ice-cream kiosk sold 15 cups of chocolate flavor, 22 cups of vanilla, and 13 cups of strawberry. a. Estimate the probability of sale of each flavor for the following week. b. Define the definition of probability used to determine the
> Use the Histogram tool to construct frequency distributions and histograms for weekly usage and waiting time in the Excel file Car Sharing Report. Do not group the data into bins.
> A community health status survey obtained the following demographic information from the respondents: Compute the relative frequencies and cumulative relative frequencies of the age groups.
> Airbnb is an online marketplace for arranging or offering lodging, primarily homestays, or tourism experiences. Airbnb provides a platform for hosts to accommodate guests with short term lodging and tourism-related activities. Guests can search for lodgi
> Use the Manufacturing Measurements Data Excel file to compute sample means, assuming that each row in the data file represents a sample from the manufacturing process. Plot the sample means on a line chart, compute the standard deviation of the sample me
> The Excel file Employee Selection contains role of employees in an organization, along with other specifics—gender, salary, years of education, date of birth, and whether they are citizens of the country. Analyze the data using all the tools that have be
> The Excel file Auto Survey contains a sample of data about vehicles owned, whether they were purchased new or used, and other types of data. Use the appropriate statistical tools to analyze these data. Summarize the observations that you can make from th
> One of PLE’s manufacturing facilities produces metal engine housings from sheet metal for both mowers and tractors. Production of each product consists of five steps: stamping, drilling, assembly, painting, and packaging to ship to its
> Use the COUNTIF function to construct frequency distributions for gender, preferred genre, and influence, develop column charts to express the results visually, and compute the relative frequencies based on the data in the Excel file Video Streaming Serv
> Use the following approaches to analyze the survey data in the Excel file Insurance Survey. ■ Frequency distributions and histograms for the ratio variables (age, years employed, and satisfaction) ■ Descriptive statistical measures for the ratio variable
> Suppose that the average height of all professional basketball players is 6 feet with standard deviation of 5 feet. A player of interest to you is 5.5 feet. Would you consider this player as the outlier? Why
> For the Excel file TV Viewing Survey, is there a significant correlation between (1) the number of TVs in a home and the hours of viewing per week, and (2) age and hours of viewing per week?
> The Excel file House Sales lists a sample of the area (in sq. ft) and prices (in dollars) of various houses. Compute the covariance and correlation between the area and prices.
> Use the Excel file Test Scores and Sales, developed by nine salespersons during the past year, to find the coefficient of correlation between the test scores and sales.
> Find the correlation between weekly food expenditure and monthly household income in the Excel file Food Expenditure.
> For the Peoples Choice Bank database, use PivotTables to find the average transaction amount for each account and branch.
> Use the Excel file Graduation Employment to analyze the average salary and the average percentage of failure rate in interviews among the graduates from the different colleges. What conclusions do you reach?
> Using PivotTables, find the mean and standard deviation of sales by region in the Sales Transactions database.
> The CFO at Performance Lawn Equipment, Brian Ferguson, wishes to design a minimum variance portfolio of index funds to invest some of the firm’s cash reserves. The funds selected for consideration and their variance covariance matrix an
> In the Excel file Debt and Retirement Savings, use a PivotTable to find the mean and standard deviation of income, long-term debt, and retirement savings for both single and married individuals.
> Use a PivotTable to find the mean annual income by level of education for the data in the Excel file Education and Income.
> The Excel file Sample Sales provides sample data on the sales representatives’ record. Create a PivotTable to find the following: a. Cross-tabulation of region versus item. b. Mean units, unit cost, and accumulative sales in each region by item. State th
> Create a PivotTable to find the mean and standard deviation of the amount of travel expenses for each sales representative in the Excel file Travel Expenses.
> In the Excel file Postal Services, find the proportion of the number of items delivered to Portland, New York, and Chicago for six days in four consecutive weeks.
> A teacher recorded the amount of time taken by 21 students to complete a sprint race, to the nearest second, as follows: ■ Two students: between 51 and less than 56 seconds ■ Seven students: between 56 and less than 61 seconds ■ Eight students: between 6
> The amount of time it took 25 respondents to solve a particular task has been recorded in the following table: Develop a table to estimate the sample mean and sample standard deviation of the time using formulas.
> we asked you to use the Histogram tool to construct frequency distributions and histograms for weekly usage and waiting time in the Excel file Car Sharing Report without grouping the data into bins. Use your results and formulas to find the mean and sam
> Construct a frequency distribution for education in the Excel file Voter. Develop a table to estimate the sample mean and sample variance using formulas. Check your results using Excel functions with the original data.
> The Data worksheet in the Excel file Airport Service Times lists a large sample of the time in seconds to process customers at a ticket counter. The second worksheet shows a frequency distribution and histogram of the data. a. Summarize the data using th
> Elizabeth Burke wants to develop a model to more effectively plan production for the next year. Currently, PLE has a planned capacity of producing 9,100 mowers each month, which is approximately the average monthly demand over the previous year. However,
> The Holtz Corporation acquired 80 percent of the 100,000 outstanding voting shares of Devine, Inc., for $7.20 per share on January 1, 2020. The remaining 20 percent of Devine’s shares also traded actively at $7.20 per share before and a
> On January 1, 2020, Paloma Corporation exchanged $1,710,000 cash for 90 percent of the outstanding voting stock of San Marco Company. The consideration transferred by Paloma provided a reasonable basis for assessing the total January 1, 2020, fair value
> Nascent, Inc., acquires 60 percent of Sea-Breeze Corporation for $414,000 cash on January 1, 2018. The remaining 40 percent of the Sea-Breeze shares traded near a total value of $276,000 both before and after the acquisition date. On January 1, 2018, Sea
> The following are several account balances taken from the records of Karson and Reilly as of December 31, 2021. A few asset accounts have been omitted here. All revenues, expenses, and dividend declarations occurred evenly throughout the year. Annual tes
> Miller Company acquired an 80 percent interest in Taylor Company on January 1, 2019. Miller paid $664,000 in cash to the owners of Taylor to acquire these shares. In addition, the remaining 20 per- cent of Taylor shares continued to trade at a total valu
> On January 1, 2019, Telconnect acquires 70 percent of Bandmor for $490,000 cash. The remaining 30 percent of Bandmor’s shares continued to trade at a total value of $210,000. The new subsidiary reported common stock of $300,000 on that
> Posada Company acquired 7,000 of the 10,000 outstanding shares of Sabathia Company on January 1, 2019, for $840,000. The subsidiary’s total fair value was assessed at $1,200,000 although its book value on that date was $1,130,000. The $70,000 fair value
> On January 1, 2021, Morey, Inc., exchanged $178,000 for 25 percent of Amsterdam Corporation. Morey appropriately applied the equity method to this investment. At January 1, the book values of Amsterdam’s assets and liabilities approxima
> On January 1, 2020, Holland Corporation paid $8 per share to a group of Zeeland Corporation shareholders to acquire 60,000 shares of Zeeland’s outstanding voting stock, representing a 60 per- cent ownership interest. The remaining 40,00
> On January 1, 2019, Parflex Corporation exchanged $344,000 cash for 90 percent of Eagle Corporation’s outstanding voting stock. Eagle’s acquisition date balance sheet follows: On January 1, 2019, Parflex prepared the f
> Go to https://about.usc.edu/files/2017/12/USC-Financial-Report-2017.pdf to find the 2017 financial statements for the University of Southern California. Required The financial statements for the University begin on page 11. Use those financial statements
> Plaza, Inc., acquires 80 percent of the outstanding common stock of Stanford Corporation on January 1, 2021, in exchange for $900,000 cash. At the acquisition date, Stanford’s total fair value, including the noncontrolling interest, was
> On January 1, 2020, Palka, Inc., acquired 70 percent of the outstanding shares of Sellinger Company for $1,141,000 in cash. The price paid was proportionate to Sellinger’s total fair value, although at the acquisition date, Sellinger ha
> On January 1, Patterson Corporation acquired 80 percent of the 100,000 outstanding voting shares of Soriano, Inc., in exchange for $31.25 per share cash. The remaining 20 percent of Soriano’s shares continued to trade for $30 both befor
> On January 1, 2021, Johnsonville Enterprises, Inc., acquired 80 percent of Stayer Company’s out- standing common shares in exchange for $3,000,000 cash. The price paid for the 80 percent owner- ship interest was proportionately representative of the fair
> On January 1, 2020, Harrison, Inc., acquired 90 percent of Starr Company in exchange for $1,125,000 fair-value consideration. The total fair value of Starr Company was assessed at $1,200,000. Harrison computed annual excess fair-value amortization of $8,
> On January 1, 2021, Ackerman Company acquires 80% of Seidel Company for $1,712,000 in cash consideration. The remaining 20 percent noncontrolling interest shares had an acquisition-date estimated fair value of $428,000. Seidel’s acquisition-date total bo
> Stockholders’ equity: a. $80,000 b. $90,000 c. $95,000 d. $130,000 (AICPA adapted)
> Noncurrent liabilities: a. $110,000 b. $104,000 c. $90,000 d. $50,000
> Current liabilities: a. $50,000 b. $46,000 c. $40,000 d. $30,000
> Noncurrent assets: a. $130,000 b. $134,000 c. $138,000 d. $140,000
> Vitous Ltd. began operations on January 1, 2018, and uses IFRS to prepare its consolidated financial statements. Although not required to do so, to facilitate comparisons with companies in the United States, Vitous keeps its books in U.S. dollars ($), an
> Current assets: a. $105,000 b. $102,000 c. $100,000 d. $90,000
> What amount is reported for trademarks in the 2021 consolidated balance sheet? a. $508,000 b. $514,000 c. $520,000 d. $540,000
> In 2021, assuming K-Tech has declared no dividends, what are the noncontrolling interest’s share of the subsidiary’s income and the ending balance of the noncontrolling interest in the subsidiary? a. $26,000 and $230,000 b. $28,800 and $252,000 c. $34,40
> What is the 2021 consolidated net income before allocation to the controlling and noncontrolling interests? a. $400,000 b. $486,000 c. $491,600 d. $500,000
> Amie, Inc., has 100,000 shares of $2 par value stock outstanding. Prairie Corporation acquired 30,000 of Amie’s shares on January 1, 2018, for $120,000 when Amie’s net assets had a total fair value of $350,000. On July 1, 2021, Prairie bought an addition
> Goodwill recognized in a business combination must be allocated across a firm’s identified reporting units. For a consolidated entity with multiple reporting units, when is goodwill considered to be impaired? a. When any individual reporting unit’s carry
> How would the answer to problem (5) change if the parent had applied the initial value method rather than the equity method? a. No effect: The method the parent uses is for internal reporting purposes only and has no impact on consolidated totals. b. The
> Angela Corporation (a private company) acquired all of the outstanding voting stock of Eddy Tech, Inc., on January 1, 2021, in exchange for $9,000,000 in cash. At the acquisition date, Eddy Tech’s stockholders’ equity
> Briefly discuss the cost savings that may result from a private company electing to amortize good- will as opposed to annual impairment testing.
> On January 1, Palisades, Inc., acquired 100 percent of Sherwood Company’s common stock for a fair value of $120,000,000 in cash and stock. The carrying amounts of Sherwood’s assets and liabilities equaled their fair va
> Go to the website www.sec.gov and, under the Filings heading, click on “Filings” and then click on “Company Filing Search.” Enter the name of a well-known company such as Facebook. A list of available documents should be shown for that company. Required
> On January 1, 2020, Procise Corporation acquired 100 percent of the outstanding voting stock of GaugeRite Corporation for $1,980,000 cash. On the acquisition date, GaugeRite had the following balance sheet: At the acquisition date, the following allocati
> Tyler Company acquired all of Jasmine Company’s outstanding stock on January 1, 2019, for $206,000 in cash. Jasmine had a book value of only $140,000 on that date. However, equipment (having an eight-year remaining life) was undervalued
> Allen Company acquired 100 percent of Bradford Company’s voting stock on January 1, 2017, by issuing 10,000 shares of its $10 par value common stock (having a fair value of $14 per share). As of that date, Bradford had stockholders&acir
> Branson paid $465,000 cash for all of the outstanding common stock of Wolfpack, Inc., on January 1, 2020. On that date, the subsidiary had a book value of $340,000 (common stock of $200,000 and retained earnings of $140,000), although various unrecorded
> On January 1, 2021, Brooks Corporation exchanged $1,183,000 fair-value consideration for all of the outstanding voting stock of Chandler, Inc. At the acquisition date, Chandler had a book value equal to $1,105,000. Chandler’s individual
> The following are selected accounts and balances for Mergaronite Company and Hill, Inc., as of December 31, 2021. Several of Mergaronite’s accounts have been omitted. Credit balances are indicated by parentheses. Dividends were declared
> On January 1, 2020, Pinnacle Corporation exchanged $3,200,000 cash for 100 percent of the out- standing voting stock of Strata Corporation. On the acquisition date, Strata had the following balance sheet: At the acquisition date, Strata’
> Giant acquired all of Small’s common stock on January 1, 2017, in exchange for cash of $770,000. On that day, Small reported common stock of $170,000 and retained earnings of $400,000. At the acquisition date, $90,000 of the fair-value
> Following are separate financial statements of Michael Company and Aaron Company as of December 31, 2021 (credit balances indicated by parentheses). Michael acquired all of Aaron’s outstanding voting stock on January 1, 2017, by issuing
> Patrick Corporation acquired 100 percent of O’Brien Company’s outstanding common stock on January 1 for $550,000 in cash. O’Brien reported net assets with a carrying amount of $350,000 at that time. S
> Go to the website www.cedarfair.com and click on “Investors,” then “Investor Information,” “Financial Reports,” and “Annual Reports.” Then click on “2017 Annual Report on 10-K” to access the 2017 Form 10-K annual report for Cedar Fair, L.P. Review the fi
> On January 1, 2020, Prestige Corporation acquired 100 percent of the voting stock of Stylene Corporation in exchange for $2,030,000 in cash and securities. On the acquisition date, Stylene had the following balance sheet: At the acquisition date, the boo
> On January 3, 2019, Persoff Corporation acquired all of the outstanding voting stock of Sea Cliff, Inc., in exchange for $6,000,000 in cash. Persoff elected to exercise control over Sea Cliff as a wholly owned subsidiary with an independent accounting sy
> Allison Corporation acquired all of the outstanding voting stock of Mathias, Inc., on January 1, 2020, in exchange for $5,875,000 in cash. Allison intends to maintain Mathias as a wholly owned subsidiary. Both companies have December 31 fiscal year-ends.
> Foxx Corporation acquired all of Greenburg Company’s outstanding stock on January 1, 2019, for $600,000 cash. Greenburg’s accounting records showed net assets on that date of $470,000, although equipment with a 10-year
> The following are selected account balances from Penske Company and Stanza Corporation as of December 31, 2021: On January 1, 2021, Penske acquired all of Stanza’s outstanding stock for $680,000 fair value in cash and common stock. Pens
> Adams, Inc., acquires Clay Corporation on January 1, 2020, in exchange for $510,000 cash. Immediately after the acquisition, the two companies have the following account balances. Clay’s equipment (with a five-year remaining life) is ac
> Assume that Chapman Company acquired Abernethy’s common stock by paying $520,000 in cash. All of Abernethy’s accounts are estimated to have a fair value approximately equal to present book values. Chapman uses the partial equity method to account for its

