Question: Match the parametric equations with the graphs
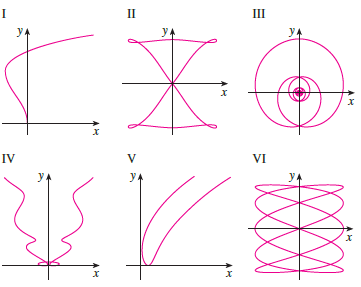
Match the parametric equations with the graphs labeled I-VI. Give reasons for your choices. (Do not use a graphing device.)
Transcribed Image Text:
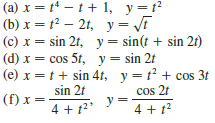
II III у. у. IV V VI y. y. (a) x = t – t + 1, y=t? JE (b) x = t2 – 2t, y = (c) x= sin 2t, y = sin(t + sin 21) (d) x = cos 5t, y= sin 2t (e) x =t+ sin 4t, y = t + cos 3t sin 2t (f) x =- 4 + 12 cos 21 y = 4 + t?
> (a). Find parametric equations for the path of a particle that moves counterclockwise halfway around the circle (x – 2)2 + y2 = 4, from the top to the bottom. (b). Use the equations from part (a) to graph the semicircular path.
> Graph members of the family of functions f (x) = ln (x2 -c) for several values of c. How does the graph change when changes?
> A small-appliance manufacturer finds that it costs $9000 to produce 1000 toaster ovens a week and $12,000 to produce 1500 toaster ovens a week. (a). Express the cost as a function of the number of toaster ovens produced, assuming that it is linear. Then
> Life expectancy improved dramatically in the 20th century. The table gives the life expectancy at birth (in years) of males born in the United States. Use a scatter plot to choose an appropriate type of model. Use your model to predict the life span of a
> Find an expression for the function whose graph consists of the line segment from the point (-2, 2) to the point (-1, 0) together with the top half of the circle with center the origin and radius 1.
> Determine whether is even, odd, or neither even nor odd. (a). f (x) = 2x5 – 3x2 + 2 (b). f (x) = x3 – x7 (c). f (x) = e-x2 (d). f (x) = 1 + sin x
> The graph of f is given. Draw the graphs of the following functions. 1 (а) у — /(x — 8) (c) у — 2 — f(u) (e) y =f-(x) (b) у — —f(x) (d) у — /) — 1 (f) y = f-(x + 3)
> Suppose that the graph of f is given. Describe how the graphs of the following functions can be obtained from the graph of f. (а) у — f() + 8 (с) у — 1 + 2f(х) (е) у — —f(») (b) у —f(x + 8) (d) у — f(x — 2) — 2 (f) y =f-(x)
> (a). What is an even function? How can you tell if a function is even by looking at its graph? (b). What is an odd function? How can you tell if a function is odd by looking at its graph?
> The graph of is given. (a). State the value of g (2). (b). Why is one-to-one? (c). Estimate the value of g-1 (2). (d). Estimate the domain of g-1. (e). Sketch the graph of g-1. 0 1
> (a). If we shift a curve to the left, what happens to its reflection about the line y = x? In view of this geometric principle, find an expression for the inverse of g (x) = f (x + c), where f is a one-to-one function. (b). Find an expression for the inv
> Starting with the graph of y = ln x, find the equation of the graph that results from (a). shifting 3 units upward (b). shifting 3 units to the left (c). reflecting about the x-axis (d). reflecting about the y-axis (e). reflecting about the line y = x (f
> Let f be the function whose graph is given. f (a). Estimate the value of f (2). (b). Estimate the values of such that f (x) = 3. (c). State the domain of f. (d). State the range of f. (e). On what interval is f increasing? (f). Is f one-to-one? Explain
> (a). What is a one-to-one function? How can you tell if a function is one-to-one by looking at its graph? (b). If f is a one-to-one function, how is its inverse function defined? How do you obtain the graph of f-1 from the graph of f?
> (a). If g (x) = x6 + x4, x > 0 use a computer algebra system to find an expression for g-1 (x). (b). Use the expression in part (a) to graph y = g (x), y = x, and y = g-1 (x) on the same screen.
> Graph the function f (x) = √x3 + x2 + x + 1 and explain why it is one-to-one. Then use a computer algebra system to find an explicit expression for f-1(x). (Your CAS will produce three possible expressions. Explain why two of them are irrelevant in this
> Suppose that f has domain A and g has domain B. (a). What is the domain of f + g? (b). What is the domain of fg? (c). What is the domain of f/g?
> Starting with the graph of y = ex, find the equation of the graph that results from (a) reflecting about the line y = 4 (b) reflecting about the line x = 2
> Compare the functions f (x) = x0.1 and g (x) = in x by graphing both f and g in several viewing rectangles. When does the graph of f finally surpass the graph of g?
> Graph the given functions on a common screen. How are these graphs related? у 3 3, у— 10+, у-()', у— (Э)"
> Use Formula 10 to graph the given functions on a common screen. How are these graphs related? y = ln x, y = log10 x, y = ex, y = 10x
> Use Formula 10 to graph the given functions on a common screen. How are these graphs related? y = log1.5 x, y = ln x, y = log10 x, y = log50 x
> Graph several members of the family of functions f (x) = 1 /1 + aebx where a > 0. How does the graph change when changes? How does it change when a change?
> Let f(x) = √1-x2, o < x < 1 (a). Find f-1. How is it related to f? (b). Identify the graph of f and explain your answer to part (a).
> A bacterial culture starts with 500 bacteria and doubles in size every half hour. (a). How many bacteria are there after 3 hours? (b). How many bacteria are there after t hours? (c). How many bacteria are there after 40 minutes? (d). Graph the population
> Make a rough sketch of the graph of each function. Do not use a calculator. Just use the graphs given in Figures 12 and 13 and, if necessary, the transformations of Section 1.3. Figures 12: Figures 13: (a). y = ln (-x) (b). y = ln |x| y y= log,
> Make a rough sketch of the graph of each function. Do not use a calculator. Just use the graphs given in Figures 12 and 13 and, if necessary, the transformations of Section 1.3. Figures 12: Figures 13: (a). y = log10(x + 5) (b). y = -ln x y y=
> Investigate the family of curves defined by the parametric equations x = cos t, y = sin t – sin ct, where c > 0. Start by letting be a positive integer and see what happens to the shape as c increases. Then explore some of the possibilities that occur wh
> The curves with equations x = a sin nt, y = b cos t is called Lissajous figures. Investigate how these curves vary when a, b, and n vary. (Take n to be a positive integer.)
> The swallowtail catastrophe curves are defined by the parametric equations x = 2ct - 4t3, y = -ct2 + 3t4. Graph several of these curves. What features do the curves have in common? How do they change when c increases?
> Graph the given functions on a common screen. How are these graphs related? у %3е*, у—е", у38%, у- 8*
> Investigate the family of curves defined by the parametric equations x = t2, y = t3 - ct. How does the shape change c as increases? Illustrate by graphing several members of the family.
> If a projectile is fired with an initial velocity of meters per second at an angle a above the horizontal and air resistance is assumed to be negligible, then its position after seconds is given by the parametric equations where is the acceleration due
> Suppose that the position of one particle at time is given by x1 = 3 sin t y1 = 2 cos t 0 (a). Graph the paths of both particles. How many points of intersection are there? (b). Are any of these points of intersection collision points? In other words,
> A curve, called a witch of Maria Agnesi, consists of all possible positions of the point P in the figure. Show that parametric equations for this curve can be written as Sketch the curve. x = 2a cot e y = 2a sin?e y у. C y = 2a --- at
> If and are fixed numbers, find parametric equations for the curve that consists of all possible positions of the point P in the figure, using the angle θ as the parameter. Then eliminate the parameter and identify the curve. \b
> Let P be a point at a distance d from the center of a circle of radius r. The curve traced out by P as the circle rolls along a straight line is called a trochoid. (Think of the motion of a point on a spoke of a bicycle wheel.) The cycloid is the special
> Under ideal conditions a certain bacteria population is known to double every three hours. Suppose that there are initially 100 bacteria. (a). What is the size of the population after 15 hours? (b). What is the size of the population after t hours? (c).
> Compare the curves represented by the parametric equations. How do they differ? (а) х — 1, у—-2 (c) х — е', у—е (b) х — cos t, у%3D sec?t
> Compare the curves represented by the parametric equations. How do they differ? (a) x = t³, y=t? (c) х — е 3, у— е 21 (b) х — 1, у—
> Use a graphing calculator or computer to reproduce the picture. -y 4+ 2+ 3 8
> Graph the given functions on a common screen. How are these graphs related? у 3 2", у3е*, у-5", у— 20*
> Use a graphing calculator or computer to reproduce the picture. y. 2- 2.
> The half-life of bismuth-210, 210Bi, is 5 days. (a). If a sample has a mass of 200 mg, find the amount remaining after 15 days. (b). Find the amount remaining after t days. (c). Estimate the amount remaining after 3 weeks. (d). Use a graph to estimate th
> Find parametric equations for the path of a particle that moves along the circle x2 + (y -1)2 = 4 in the manner described. (a). Once around clockwise, starting at (2, 1) (b). Three times around counterclockwise, starting at (2, 1) (c). Halfway around cou
> Use a graphing device and the result of Exercise 29(a) to draw the triangle with vertices A (1, 1), B (4, 2), and C (1, 5). Exercise 29(a): (a). Show that the parametric equations x = x1 + (x2 -x1) t y = y1 + (y2 – y1) t where 0 < t < 1, describe the l
> (a). Show that the parametric equations x = x1 + (x2 -x1) t y = y1 + (y2 – y1) t where 0 < t < 1, describe the line segment that joins the points p1 (x1, y1) and p2 (x2, y2). (b). Find parametric equations to represent the line segment from (-2, 7) to (3
> Graph the curves y = x3 – 4x and x = y3 -4y and find their points of intersection correct to one decimal place.
> Compare the functions f (x) = x5 and g (x) = 5x by graphing both functions in several viewing rectangles. Find all points of intersection of the graphs correct to one decimal place. Which function grows more rapidly when is large?
> What happens if b = 1 and is irrational? Experiment with an irrational number like √2 or e -2. Take larger and larger values for and speculate on what would happen if we were to graph the hypocycloid for all real values of θ.
> Now try b = 1 and a = n/d, a fraction where n and d have no common factor. First let n = 1 and try to determine graphically the effect of the denominator d on the shape of the graph. Then let n vary while keeping d constant. What happens when n = d + 1?
> Use a graphing device to draw the graphs of hypocycloids with a positive integer and b = 1. How does the value of a affect the graph? Show that if we take a = 4, then the parametric equations of the hypocycloid reduce to This curve is called a hypocycl
> (a). What is a function? What are its domain and range? (b). What is the graph of a function? (c). How can you tell whether a given curve is the graph of a function?
> (a). Suppose f is a one-to-one function with domain A and range B. How is the inverse function f-1 defined? What is the domain of f-1? What is the range of f-1? (b). If you are given a formula for f, how do you find a formula for f-1? (c). If you are giv
> The formula C = 5/9 (F – 32), where F > -459.67, expresses the Celsius temperature C as a function of the Fahrenheit temperature F. Find a formula for the inverse function and interpret it. What is the domain of the inverse function?
> Graph the given functions on a common screen. How are these graphs related? у%3D 0.9%, у%3D 0.6, у%3D 0.3+, у%3 0.1*
> Use the Law of Exponents to rewrite and simplify the expression. (a) 2-8 1 (b) 4)
> If f is a one-to-one function such that f (2) = 9, what is f-1 (9)
> Use the graphs of x = f (t) and y = g (t) to sketch the parametric curve x = f (t), y = g (t). Indicate with arrows the direction in which the curve is traced as increases. XA y.
> A function is given by a table of values, a graph, a formula, or a verbal description. Determine whether it is one-to-one. f (t) is your height at age t.
> A function is given by a table of values, a graph, a formula, or a verbal description. Determine whether it is one-to-one. f (t) is the height of a football t seconds after kickoff.
> A function is given by a table of values, a graph, a formula, or a verbal description. Determine whether it is one-to-one. g (x) = 1/x
> A function is given by a table of values, a graph, a formula, or a verbal description. Determine whether it is one-to-one. f (x) = 10 - 3x
> (a). What is a one-to-one function? (b). How can you tell from the graph of a function whether it is one-to-one?
> (a). How is the number e defined? (b). What is an approximate value for e? (c). What is the natural exponential function?
> (a). Write an equation that defines the exponential function with base a > 0. (b). What is the domain of this function? (c). If a ≠ 1, what is the range of this function? (d). Sketch the general shape of the graph of the exponential function for each of
> Use the Law of Exponents to rewrite and simplify the expression. (a) x*+2 (b) Jab
> If you graph the function f (x) = 1 - e1/x /1 + e1/x you’ll see that f appears to be an odd function. Prove it.
> The table gives the population of the United States, in millions, for the years 1900–2000. Use a graphing calculator with exponential regression capability to model the US population since 1900. Use the model to estimate the population
> Use the graphs of x = f (t) and y = g (t) to sketch the parametric curve x = f (t), y = g (t). Indicate with arrows the direction in which the curve is traced as increases. y
> Investigate the possible shapes for epicycloids. Use methods similar to Problems 2–4.
> Use a graphing calculator with exponential regression capability to model the population of the world with the data from 1950 to 2000 in Table 1 on page 56. Use the model to estimate the population in 1993 and to predict the population in the year 2010.
> An isotope of sodium, 24Na, has a half-life of 15 hours. A sample of this isotope has mass 2 g. (a). Find the amount remaining after 60 hours. (b). Find the amount remaining after t hours. (c). Estimate the amount remaining after 4 days. (d). Use a graph
> Use the Law of Exponents to rewrite and simplify the expression. (бу) (b) 2y5 (а) Б'(2)*
> Use a graph to estimate the values of such that ex > 1,000,000,000.
> Compare the functions f (x) = x10 and g (x) = ex by graphing both f and g in several viewing rectangles. When does the graph of g finally surpass the graph of f?
> Suppose the graphs of f (x) = x2 and g (x) = 2x are drawn on a coordinate grid where the unit of measurement is 1 inch. Show that, at a distance 2 ft to the right of the origin, the height of the graph of f is 48 ft but the height of the graph of is abou
> Suppose you are offered a job that lasts one month. Which of the following methods of payment do you prefer? I. One million dollars at the end of the month. II. One cent on the first day of the month, two cents on the second day, four cents on the third
> If f (x) = 5x, show that f (x + h) - f (x)/h = 5x (5h – 1)/h
> Find the exponential function f (x) = Cax whose graph is given. (-1, 3) (1. §)
> When a camera flash goes off, the batteries immediately begin to recharge the flash’s capacitor, which stores electric charge given by Q (t) = Q0 (1 – e-t/a). (The maximum charge capacity is Q0 and is measured in seconds.) (a). Find the inverse of this f
> Use the graphs of x = f (t) and y = g (t) to sketch the parametric curve x = f (t), y = g (t). Indicate with arrows the direction in which the curve is traced as increases. y. 1+ -1
> If a bacteria population starts with 100 bacteria and doubles every three hours, then the number of bacteria after hours is n – f (t) = 100 ∙ 2t/3. (a). Find the inverse of this function and explain its meaning. (b). When will the population reach 50,00
> Find the exponential function f (x) = Cax whose graph is given. y4 (3, 24), (1, 6)
> Find the domain of each function. (a). g (t) = sin (e-t) (b). g (t) = √1 - 2t
> Find (a) the domain of f and (b) f-1 and its domain. f (x) = ln (2 + ln x)
> Find (a) the domain of f and (b) f-1 and its domain. f (x) = √3 - e2x
> Solve each inequality for x. (a). 2 < ln x < 9 (b). e2-3x > 4
> Solve each inequality for x. (a). ex > 10 (b). ln x > -1
> Solve each equation for x. (a). ln (ln x) = 1 (b). eax = Cebx, where a ≠ b
> Solve each equation for x. (a). 2x-5 = 3 (b). ln x + ln (x – 1) = 1
> Solve each equation for x. (a). ln (x2 – 1) = 3 (b). e2x – 3ex + 2 = 0
> Match the graphs of the parametric equations x = f (t) and y = g (t) in (a)–(d) with the parametric curves labeled I–IV. Give reasons for your choices. (a) I YA 2+ 1- 1 1 II 2. + III 2 t (d) IV 2+ 2 t 2 х
> Solve each equation for x. (a). e7-4x = 6 (b). ln (3x -10) = 2
> Use the Law of Exponents to rewrite and simplify the expression. (a). 84/3 (b). x (3x2)3
> Find the domain of each function. (a). f (x) = 1 – ex2 /1 – e1-x2 (b). f (x) = 1 + x/e cos x
> Make a rough sketch of the graph of the function. Do not use a calculator. Just use the graphs given in Figures 3 and 13 and, if necessary, the transformations of Section 1.3. Figures 3: Figures 13: y = e |x| y4 10 4" 1.5 1 y y = e* m=1
> Suppose that the graph of y = log2x is drawn on a coordinate grid where the unit of measurement is an inch. How many miles to the right of the origin do we have to move before the height of the curve reaches ft?
> Make a rough sketch of the graph of the function. Do not use a calculator. Just use the graphs given in Figures 3 and 13 and, if necessary, the transformations of Section 1.3. Figures 3: Figures 13: y = -2-x y4 10 4" 1.5 1 y y = e* m=1
> Make a rough sketch of the graph of the function. Do not use a calculator. Just use the graphs given in Figures 3 and 13 and, if necessary, the transformations of Section 1.3. Figures 3: Figures 13: y = (0.5) x - 2 y4 10 4" 1.5 1 y y = e* m=1

