Question: Part A Walmart Stores (Walmart) is the
Part A
Walmart Stores (Walmart) is the world’s largest retailer. It employs an ‘‘everyday low price’’ strategy and operates stores as three business segments: Walmart Stores U.S., International, and Sam’s Club.
1. Walmart Stores U.S.: This segment represented 62.3% of all 2015 sales and operates stores in three different formats: Discount stores (104,000 average square feet), Supercenters (178,000 average square feet), and Neighborhood Markets (42,000 average square feet). Each format carries a variety of clothing, housewares, electronic equipment, pharmaceuticals, health and beauty products, sporting goods, and similar items, and Supercenters include a full-line supermarket.28 Walmart U.S. stores are in all 50 states; Washington, D.C.; and Puerto Rico. Discount stores are in 41 states, Supercenters are in 49 states, and Neighborhood Markets are in 31 states. Customers also can purchase many items through the company’s website at www.walmart.com.
2. International: The International segment includes wholly owned subsidiaries in Argentina, Brazil, Canada, Chile, China, India, Japan, and the United Kingdom; majority-owned subsidiaries are in Africa, Central America, and Mexico. The merchandising strategy for the International segment is similar to that of the Walmart U.S. segment.
3. Sam’s Clubs: Sam’s Clubs are membership club warehouses that operate in 48 states. The average Sam’s Club is approximately 134,000 square feet, and customers can purchase many items through the company’s website at www.samsclub.com. These warehouses offer bulk displays of brand name merchandise, including hard goods, some soft goods, institutional-size grocery items, and certain private-label items. Gross margins for Sam’s Clubs stores are lower than those of the U.S. and International segments.
Walmart uses centralized purchasing through its home office for substantially all of its merchandise. It distributes products to its stores through regional distribution centers. During fiscal 2015, the proportion of merchandise channeled through its regional distribution centers was as follows: Walmart Discount Stores, Supercenters, and Neighborhood Markets 79%
Sam’s Club (nonfuel) ……………………………….69%
International …………………………………………….77%
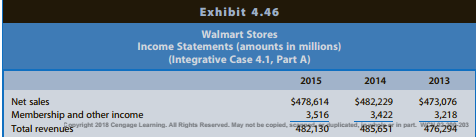
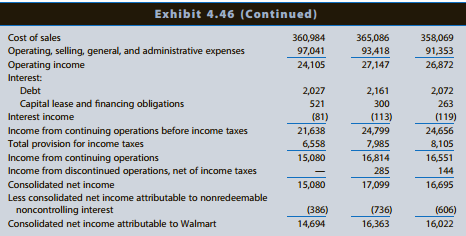
Exhibit 4.43 sets out various operating data for Walmart for 2013 through 2015. Exhibit 4.44 presents segment data. Exhibit 4.45 presents comparative balance sheets for Walmart for 2012 through 2015 (an extra year to enable average balance computations when necessary), Exhibit 4.46 presents comparative income statements for 2013 through 2015, and Exhibit 4.47 presents comparative statements of cash flows for 2013 through 2015. Exhibit 4.48 presents selected financial statement ratios for Walmart for 2013 through 2015. The statutory income tax rate is 35%.
REQUIRED:
a. What are the likely reasons for the changes in Walmart’s rate of ROA during the three-year period? Analyze the financial ratios to the maximum depth possible.
b. What are the likely reasons for the changes in Walmart’s rate of ROCE during the three-year period?
Note: Requirements c and d require coverage of material from Chapter 5.
c. How has the short-term liquidity risk of Walmart changed during the three-year period?
d. How has the long-term solvency risk of Walmart changed during the three-year period?
Exhibit 4.43:
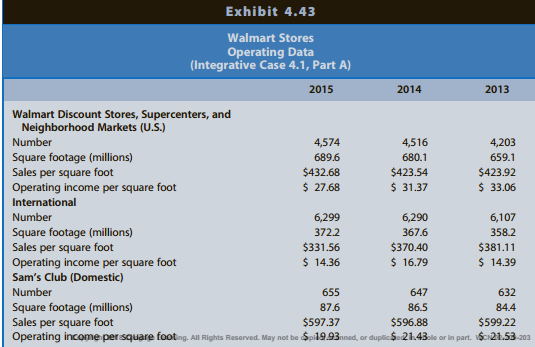
Exhibit 4.44:

Exhibit 4.45:
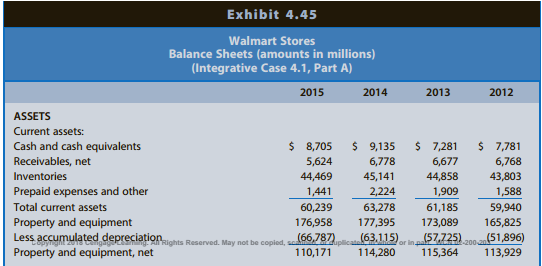
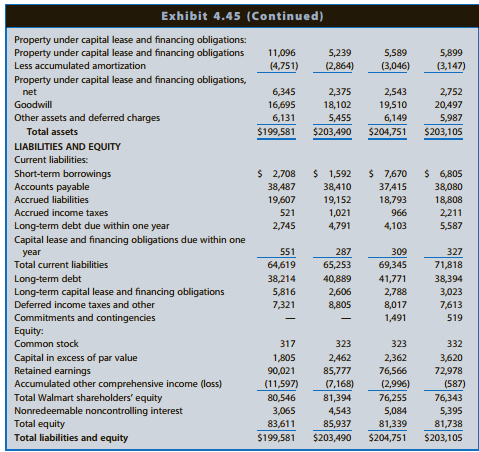
Exhibit 4.46:
Part B:
Part A of Integrative Case 4.1 analyzed the profitability and risk of Walmart Stores for its fiscal years 2013, 2014, and 2015. Part B of this case compares the profitability and risk ratios of Walmart and two other leading discount retailers, Carrefour and Target, for their 2013 through 2015 fiscal years…………..
Transcribed Image Text:
> Why do firms choose to streamline their supply chains? Describe two or three ways a firm might go about streamlining their supply chains.
> What are the benefits of owning a franchise? What are the drawbacks?
> Compare and contrast the two types of channel conflict. Why is channel conflict damaging to all parties?
> Describe the three levels of distribution intensity. Give an example of a product in each level.
> Some marketers argue that search marketing is a more effective means of using the Web to advertise than traditional pop-up or banner ads. Research the concept of search marketing. What are some of the benefits of using search marketing?
> Describe the two concepts that influence materials handling choices. Give an example of a product that would be appropriate for each.
> What is a marketing intermediary? What is the intermediary’s role?
> Describe the different ways companies can organize to develop new products.
> What are the five stages of the consumer adoption process?
> Describe the different product development strategies.
> What is category management and what role does it play in the success of a product line?
> What role does packaging play in helping create brand loyalty and brand equity?
> What are the characteristics of an effective brand name?
> Identify and briefly describe the different types of brands.
> List the six steps in the new-product development process.
> Who are typical online buyers and sellers? What are some of the strategic implications of these facts to online marketers?
> Pop-up ads, those unsolicited messages that sometimes pop onto your computer screen and block the site or information you’re looking for until you close or respond to them, are inexpensive to produce and cost nearly nothing to send. But they are so annoy
> Sunbeam Corporation manufactures and sells a variety of small household appliances, including toasters, food processors, and waffle grills. Exhibit 3.21 presents a statement of cash flows for Sunbeam for Year 5, Year 6, and Year 7. After experiencing dec
> Sirius XM Radio Inc. is a satellite radio company, formed from the merger of Sirius and XM in 2008. Exhibit 3.20 presents a statement of cash flows for Sirius XM Radio for 2006, 2007, and 2008. Sirius XM and its predecessor, Sirius, realized revenue grow
> Gap Inc. operates chains of retail clothing stores under the names of Gap, Banana Republic, and Old Navy. Exhibit 3.19 presents the statement of cash flows for Gap for Year 0 to Year 4 Exhibit 3.19: REQUIRED: Discuss the relations between net income a
> Tesla Motors manufactures high-performance electric vehicles that are extremely slick looking. Exhibit 3.18 presents the statement of cash flows for Tesla Motors for 2010 through 2012. Exhibit 3.18: REQUIRED: Discuss the relations among net income, cas
> Texas Instruments primarily develops and manufactures semiconductors for use in technology-based products for various industries. The manufacturing process is capital-intensive and subject to cyclical swings in the economy. Because of overcapacity in the
> Flight Training Corporation is a privately held firm that provides fighter pilot training under contracts with the U.S. Air Force and the U.S. Navy. The firm owns approximately 100 Lear jets that it equips with radar jammers and other sophisticated elect
> Nojiri Pharmaceutical Industries develops, manufactures, and markets pharmaceutical products in Japan. The Japanese economy experienced recessionary conditions in recent years. In response to these conditions, the Japanese government increased the propor
> Exhibit 3.25 presents common-size statements of cash flows for eight firms in various industries. All amounts in the common-size statements of cash flows are expressed as a percentage of cash flow from operations. In constructing the common-size percenta
> The Coca-Cola Company (Coca-Cola) manufactures and markets a variety of beverages. Exhibit 3.16 presents a statement of cash flows for Coca-Cola for three years. Exhibit 3.16: REQUIRED: Discuss the relations between net income and cash flow from operat
> BTB Electronics Inc. manufactures parts, components, and processing equipment for electronics and semiconductor applications in the communications, computer, automotive, and appliance industries. Its sales tend to vary with changes in the business cycle
> Massachusetts Stove Company manufactures wood-burning stoves for the heating of homes and businesses. The company has approached you, as chief lending officer for the Massachusetts Regional Bank, seeking to increase its loan from the current level of $93
> Alfa Romeo incurs direct cash costs of $30,000 in manufacturing a red convertible automobile during 2016. Assume that it incurs all of these costs in cash. Alfa Romeo sells this automobile to you on January 1, 2017, for $45,000. You pay $5,000 immediatel
> Assume Southern Copper Corporation (SCCO) acquired mining equipment for $100,000 cash on January 1, 2016. The equipment had an expected useful life of four years and zero salvage value. SCCO calculates depreciation using the straight-line method over the
> Refer to Problem 2.12. Assume that Walmart has accounted for the value of the land at acquisition cost and sells the land on December 31, 2018, for a two-year note receivable with a present value of $180,000 instead of for cash. The note bears interest a
> Assume Walmart acquires a tract of land on January 1, 2016, for $100,000 cash. On December 31, 2016, the current market value of the land is $150,000. On December 31, 2017, the current market value of the land is $120,000. The firm sells the land on Dece
> The financial statements of Nike, Inc., reveal the information regarding income taxes shown in Exhibit 2.13. REQUIRED: a. Assuming that Nike had no significant permanent differences between book income and taxable income, did income before taxes for fin
> Prepaid Legal Services (PPD) is a company that sells insurance for legal expenses. Customers pay premiums in advance for coverage over some specified period. Thus, PPD obtains cash but has unearned revenue until the passage of time over the specified per
> The financial statements of ABC Corporation, a retail chain, reveal the information for income taxes shown in Exhibit 2.11. REQUIRED: a. Assuming that ABC had no significant permanent differences between book income and taxable income, did income before
> Components of the deferred tax asset of Biosante Pharmaceuticals, Inc., are shown in Exhibit 2.10. The company had no deferred tax liabilities. REQUIRED: a. At the end of 2008, the largest deferred tax asset is for net operating loss carryforwards. (Net
> Exhibit 1.18 represents common-size income statements and balance sheets for seven firms that operate at various stages in the value chain for the pharmaceutical industry. These common-size statements express all amounts as a percentage of sales revenue.
> Effective financial statement analysis requires an understanding of a firm’s economic characteristics. The relations between various financial statement items provide evidence of many of these economic characteristics. Exhibit 1.17 pres
> Exhibit 5.26 presents risk ratios for Walmart for 2014 and 2013. Exhibits 1.19, 1.20, and 1.21 in Chapter 1 present the financial statements for Walmart. REQUIRED: a. Compute the values of each of the ratios in Exhibit 5.26 for Walmart for 2015. Walmart
> Effective financial statement analysis requires an understanding of a firm’s economic characteristics. The relations between various financial statement items provide evidence of many of these economic characteristics. Exhibit 1.16 (pag
> Effective financial statement analysis requires an understanding of a firm’s economic characteristics. The relations between various financial statement items provide evidence of many of these economic characteristics. Exhibit 1.15 (pag
> In this chapter, we evaluated shares of common equity in Starbucks using the value-to-book approach, market multiples, and reverse engineering. The Coca-Cola Company competes directly with Starbucks. The data in Chapter 12 include the actual amounts for
> The Coca-Cola Company is a global soft-drink beverage company that is a direct competitor with Starbucks. The data in Chapter 12 include the actual amounts for 2015 and projected amounts for Year þ1 to Year þ6 for the income statements, balance sheets, a
> Exhibit 14.10 presents data on market-to-book (MB) ratios, ROCE, the cost of equity capital, and price-earnings (PE) ratios for seven pharmaceutical companies. (Note that PE ratios for these firms typically fall in the 30–35 range.) Exh
> Exhibit 13.6 in Chapter 13 present selected hypothetical data from projected financial statements for Steak ‘n Shake for Year þ1 to Year þ11. The amounts for Year þ11 reflect a long-term grow
> The Coca-Cola Company is a global soft drink beverage company (ticker: KO) that is a primary and direct competitor with Starbucks. The data in Chapter 12’s Exhibits 12.14, 12.15, and 12.16 (pages 806–809) include the a
> Exhibit 13.6 presents selected hypothetical data from projected financial statements for Steak ‘n Shake for Year þ1 to Year þ11. The amounts for Year þ11 reflect a long-term growth assumption
> Dick’s Sporting Goods is a chain of full line sporting goods retail stores offering a broad assortment of brand name sporting goods equipment, apparel, and footwear. Dick’s Sporting Goods had its initial public offerin
> The 3M Company is a global diversified technology company active in the following product markets: consumer and office; display and graphics; electronics and communications; health care; industrial; safety, security, and protection services; and transpor
> Partial forecasts of financial statements for Watson Corporation appear in Exhibit 10.7 (income statement), Exhibit 10.8 (balance sheet), and Exhibit 10.9 (statement of cash flows). Selected amounts have been omitted, as have all totals (indicated by XXX
> Barnes & Noble sells books, magazines, music, and videos through retail stores and online. For a retailer like Barnes & Noble, inventory is a critical element of the business, and it is necessary to carry a wide array of titles. Inventories const
> Sony Corporation manufactures and markets consumer electronics products. Assume the following are selected income statement data for 2014 and 2015 (amounts in billions of yen): REQUIRED: a. Estimate the variable cost as a percentage of sales for the co
> Intel is a global leader in manufacturing microprocessors, which is very capital-intensive. The production processes in microprocessor manufacturing require sophisticated technology, and the technology changes rapidly, particularly with each new generati
> The Home Depot is a leading specialty retailer of hardware and home improvement products and is the second-largest retail store chain in the United States. It operates large warehouse-style stores. In 2014 and 2015, The Home Depot invested in five new st
> The Coca-Cola Company is a global soft drink beverage company (ticker: KO) that is a primary and direct competitor with Starbucks. The following data for Coca-Cola include the actual amounts for 2015 and the projected amounts for Years þ1
> Royal Dutch Shell (Shell) is a petroleum and petrochemicals company. It engages primarily in the exploration, production, and sale of crude oil and natural gas and the manufacture, transportation, and sale of petroleum and petrochemical products. The com
> he data in Exhibit 11.3 on industry median betas suggest that firms in the following three sets of related industries have different degrees of systematic risk Exhibit 11.3: REQUIRED: a. For each matched pair of industries, describe factors that char
> Disclosures related to income taxes for The Coca-Cola Company (Coca-Cola) for 2006–2008 appear in Exhibit 9.9. REQUIRED: a. Why are Coca-Cola’s average tax rates so low? b. Is it likely that Coca-Cola has recognized a
> Kentucky Gold (KG) holds 10,000 gallons of whiskey in inventory on October 31, 2017, that costs $225 per gallon. KG contemplates selling the whiskey on March 31, 2018, when it completes the aging process. Uncertainty about the selling price of whiskey on
> Prime Contractors (Prime) is a privately owned company that contracts with the U.S. government to provide various services under multiyear (usually five-year) contracts. Its principal services are as follows: Refuse: Picks up and disposes of refuse from
> Lynn Construction enters into a firm purchase commitment for equipment to be delivered on June 30, 2017, for a price of 10,000 GBP. It simultaneously signs a forward foreign exchange contract for 10,000 GBP. The forward rate on June 30, 2017, for settlem
> The following information relates to a firm’s pension plan. Prior service cost due to 2017 amendment ………………………………..$ 60,000 PBO, January 1, 2017 ……………………………………………………………….1,000,000 FMV, January 1, 2017 ………………………………………………………………1,200,000 Settlement interes
> A large manufacturer of truck and car tires recently changed its cost-flow assumption method for inventories at the beginning of 2017. The manufacturer has been in operation for almost 40 years, and for the last decade it has reported moderate growth in
> On January 1, 2017, assume that Turner Construction Company agreed to construct an observatory for Dartmouth College for $120 million. Dartmouth College must pay $60 million upon signing and $30 million in 2018 and 2019. Expected construction costs are $
> Refer to Problem 8.25 for Stebbins Corporation for Year 1, its first year of operations. Exhibit 8.31 shows the amounts for the Canadian subsidiary for Year 2. The average exchange rate during Year 2 was C$1:US$0.82, and the exchange rate on December 31,
> Stebbins Corporation established a wholly owned Canadian subsidiary on January 1, Year 1, by contributing US$500,000 for all of the subsidiary’s common stock. The exchange rate on that date was C$1:US$0.90 (that is, one Canadian dollar
> Foreign Sub is a wholly owned subsidiary of U.S. Domestic Corporation. U.S. Domestic Corporation acquired the subsidiary several years ago. The financial statements for Foreign Sub for 2017 in its own currency appear in Exhibit 8.29. The exchange rates b
> Exhibit 8.26 presents the separate financial statements at December 31, 2018, of Prestige Resorts and its 80%-owned subsidiary Booking, Inc. Two years earlier on January 1, 2017, Prestige acquired 80% of the common shares of Booking for $1,170 million in
> On December 31, 2017, Pace Co. paid $3,000,000 to Sanders Corp. shareholders to acquire 100% of the net assets of Sanders Corp. Pace Co. also agreed to pay former Sanders shareholders $200,000 in cash if certain earnings projections were achieved over th
> Ormond Co. acquired all of the outstanding common stock of Daytona Co. on January 1, 2017. Ormond Co. gave shares of its common stock with a fair value of $312 million in exchange for 100% of the Daytona Co. common stock. Daytona Co. will remain a legall
> Exhibit 3.32 presents a statement of cash flows for Walmart for fiscal 2015, 2014, and 2013. This statement matches the Walmart statement of cash flows in Appendix A, and is an expanded version of the statement of cash flows for Walmart shown in Exhibit
> Lexington Corporation acquired all of the outstanding common stock of Chalfont, Inc., on January 1, 2016. Lexington gave shares of its no par common stock with a market value of $504 million in exchange for the Chalfont common stock. Chalfont will remain
> Bed and Breakfast (B&B), an Italian company operating in the Tuscany region, follows IFRS and has made the choice to re measure long-lived assets at fair value. B&B purchased land in 2016 for E150,000. At December 31 of the next four years, the land is w
> Alpha Computer Systems (ACS) designs, manufactures, sells, and services networked computer systems; associated peripheral equipment; and related network, communications, and software products. Exhibit 8.32 presents geographic segment data. ACS conducts s
> Exhibit 8.21 presents selected financial statement data for three chemical companies: Monsanto Company, Olin Corporation, and NewMarket Corporation. (NewMarket was formed from a merger of Ethyl Corporation and Afton Chemical Corporation.) Exhibit 8.21:
> Part A. Floral Delivery, Inc. (FD) acquired a fleet of vans on January 1, 2017, by issuing a $500,000, four-year, 4% fixed rate note, with interest payable annually on December 3. FD has the option to repay the note prior to maturity at the note’s fair v
> Exhibit 6.18 presents selected financial statement data for Enron Corporation as originally reported for 1997, 1998, 1999, and 2000. In 2001, Enron restated its financial statements for earlier years because it reported several items beyond the limits of
> Sunbeam Corporation manufactures and sells a variety of small household appliances, including toasters, food processors, and waffle grills. Exhibit 6.17 presents a statement of cash flows for Sunbeam for Year 5, Year 6, and Year 7. After experiencing dec
> Intel Corporation’s consolidated income statement appears in Exhibit 6.16. Note 15, which follows, explains the source of the restructuring charges, the breakdown of the charges into employee-related costs and asset impairments, and th
> Vulcan Materials Company, a member of the S&P 500 Index, is the nation’s largest producer of construction aggregates, a major producer of asphalt mix and concrete, and a leading producer of cement in Florida. Exhibit 6.15 presents V
> Henry Company is a marketer of branded foods to retail and foodservice channels. Exhibit 6.14 presents Henry’s income statements for Year 10, Year 11, and Year 12. Exhibit 6.14: Notes to the financial statements reveal the following
> Exhibits 1.19–1.21 of Integrative Case 1.1 (Chapter 1) present the financial statements for Walmart for 2012–2015. In addition, the website for this text contains Walmart’s December 31, 2015, Form 10-
> Recent years have witnessed some of the most significant accounting scandals in history. For each scandal listed in Exhibit 6.13, identify how balance sheet quality and earnings quality were impaired. Exhibit 6.13: Exhibit 6.13 Accounting Scandals
> Exhibit 5.23 presents selected financial data for The Tribune Company and The Washington Post Company for fiscal 2006 and 2007. The Washington Post Company is an education and media company. It owns, among others, Kaplan, Inc.; Cable ONE Inc.; Newsweek m
> Exhibit 5.22 presents selected financial data for ABC Auto and XYZ Comics for fiscal Year 5 and Year 6. ABC Auto manufactures automobile components that it sells to automobile manufacturers. Competitive conditions in the automobile industry in recent yea
> Exhibit 5.21 presents selected financial data for Best Buy Co., Inc., and Circuit City Stores, Inc., for fiscal 2008 and 2007. Best Buy and Circuit City operate as specialty retailers offering a wide range of consumer electronics, service contracts, prod
> Sun Microsystems, Inc., develops, manufactures, and sells computers for network systems. Exhibit 5.20 presents selected financial data for Sun Microsystems for each of the five years ending June 30, Year 1, to June 30, Year 5. The company did not go bank
> VF Corporation is an apparel company that owns recognizable brands like Timberland, Vans, Reef, and 7 For All Mankind. Exhibit 5.18 and 5.19 present balance sheets and income statements, respectively, for Year 1 and Year 2. (VF Corporation previously had
> Delta Air Lines, Inc., is one of the largest airlines in the United States. It has operated on the verge of bankruptcy for several years. Exhibit 5.17 presents selected financial data for Delta Air Lines for each of the five years ending December 31, 200
> Exhibit 5.16 presents risk ratios for Coca-Cola for Year 1 through Year 3. Exhibit 5.16: REQUIRED: a. Assess the changes in the short-term liquidity risk of Coca-Cola between Year 1 and Year 3. b. Assess the changes in the long-term solvency risk of C
> Refer to the financial statement data for Abercrombie & Fitch in Problem 4.25 in Chapter 4. Exhibit 5.15 presents risk ratios for Abercrombie & Fitch for fiscal Year 3 and Year 4. Financial statement in 4.25: Exhibit 5.15: REQUIRED: a. Comp
> Exhibit 5.24 presents balance sheets for Year 2 and Year 3 for Whole Foods Market, Inc.; Exhibit 5.25 presents income statements for Year 1 through Year 3. Exhibit 5.24: Exhibit 5.25: REQUIRED: a. For Year 3, prepare the standard decomposition of RO
> Nike, Inc.’s principal business activity involves the design, development, and worldwide marketing of athletic footwear, apparel, equipment, accessories, and services for serious and recreational athletes. Nike boasts that it is the largest seller of ath
> Refer to the financial statement data for Hasbro in Problem 4.24 in Chapter 4. Exhibit 5.14 presents risk ratios for Hasbro for Year 2 and Year 3. Financial statement in 4.24: Exhibit 5.14: REQUIRED: a. Calculate these ratios for Year 4. b. Assess t
> Kelly Services (Kelly) places employees at clients’ businesses on a temporary basis. It segments its services into (1) commercial, (2) professional and technical, and (3) international. Kelly recognizes revenues for the amount bille
> Selected data for The Hershey Company for Year 1 through Year 3 appear in Exhibit 4.29. Exhibit 4.29: REQUIRED: a. Compute ROA and its decomposition for Year 2 and Year 3. Assume a tax rate of 35%. b. Compute ROCE and its decomposition for Year 2 and
> In Integrative Case 10.1, we projected financial statements for Walmart Stores for Years +1 through +5. The data in Chapter 12 include the actual amounts for 2015 and the projected amounts for Year þ1 to Year þ5 for the income statements, balance sheets,
> In Integrative Case 10.1, we projected financial statements for Walmart Stores, Inc. (Walmart), for Years þ1 through þ5. The data in Chapter 12 include the actual amounts for 2015 and the projected amounts for Year þ1 to Year þ5 for the income statements
> Holmes Corporation is a leading designer and manufacturer of material handling and processing equipment for heavy industry in the United States and abroad. Its sales have more than doubled, and its earnings have increased more than six fold in the past f
> In Integrative Case 10.1, we projected financial statements for Walmart Stores, Inc. (Walmart), for Years þ1 through þ5. In this portion of the Walmart Integrative Case, we use the projected financial statements from Integra

