Question: Sandford Tile Company makes ceramic and porcelain
Sandford Tile Company makes ceramic and porcelain tile for residential and commercial use. They produce three different grades of tile (for walls, residential flooring, and commercial flooring), each of which requires different amounts of materials and production time, and generates different contributions to profit. The following information shows the percentage of materials needed for each grade and the profit per square foot.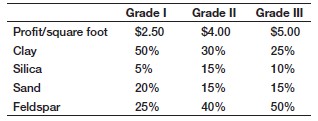
Each week, Sanford Tile receives raw-material shipments, and the operations manager must schedule the plant to efficiently use the materials to maximize profitability. Currently, inventory consists of 6,000 pounds of clay, 3,000 pounds of silica, 5,000 pounds of sand, and 8,000 pounds of feldspar. Because demand varies for the different grades, marketing estimates that at most 8,000 square feet of Grade III tile should be produced, and that at least 1,500 square feet of Grade I tiles are required. Each square foot of tile weighs approximately 2 pounds.
a. Develop a linear optimization model to determine how many of each grade of tile the company should make next week to maximize profit contribution.
b. Implement your model on a spreadsheet and find an optimal solution.
c. Explain the sensitivity information for the objective coefficients. What happens if the profit on Grade I is increased by $0.05?
d. If an additional 500 pounds of feldspar is available, how will the optimal solution be affected?
e. Suppose that 1,000 pounds of clay are found to be of inferior quality. What should the company do?
f. Use the auxiliary variable cells technique to handle the bound constraints and generate all shadow prices
> Identify each of the variables in the Excel file Credit Approval Decisions as categorical, ordinal, interval, or ratio and explain why
> A gasoline mini-mart orders 25 copies of a monthly magazine. Depending on the cover story, demand for the magazine varies. The gasoline mini-mart purchases the magazines for $1.50 and sells them for $4.00. Any magazines left over at the end of the month
> The director of a nonprofit ballet company in a medium-sized U.S. city is planning its next fundraising campaign. In recent years, the program has found the following percentages of donors and gift levels:Develop a spreadsheet model to calculate the tota
> A stockbroker calls on potential clients from referrals. For each call, there is a 10% chance that the client will decide to invest with the firm. Fifty-five percent of those interested are found not to be qualified, based on the brokerage firm’s screeni
> Develop a spreadsheet model for gasoline usage scenario, Problem 4 in Chapter 1, using the data provided. Apply the principles of spreadsheet engineering in developing your model.Problem 4 in Chapter 1Suggest some metrics that a manager of a fast-food re
> A manager needs to identify some information from the Purchase Orders Excel file but has only the order number. Modify the Excel file to use the VLOOKUP function to find the item description and cost per order for the following order numbers: Aug11008, S
> For the Colleges and Universities data, use XLMiner to find four clusters using each of the other clustering methods (see Figure 10.13); compare the results with Example 10.6.Figure 10.13,,,
> For the four clusters identified in Example 10.6, find the average and standard deviations of each numerical variable for the schools in each cluster and compare them with the averages and standard deviations for the entire data set. Does the clustering
> For the Excel file Colleges and Universities, normalize each column of the numerical data (i.e., compute a z-score for each of the values) and then compute the Euclidean distances between the following schools: Amherst, Cal Tech, and Duke
> A sample of 20 international students attending an urban U.S. university found that the average amount budgeted for expenses per month was $1612.50 with a standard deviation of $1179.64. Find a 95% confidence interval for the mean monthly expense budget
> In the Excel file Restaurant Sales, determine if the variance of weekday sales is the same as that of weekend sales for each of the three variables (lunch, dinner, and delivery)
> Compute the Euclidean distance between the following sets of points:a. (2,5) and (8,4)b. (2, -1, 3) and (8, 15, -5)
> Construct a variable plot for all the variables in the Excel file Banking Data
> Classify each of the data elements in the Sales Transactions database (Figure 1.1) as categorical, ordinal, interval, or ratio data and explain why
> Construct a scatterplot matrix for Median Income, Median Home Value, Median Household Wealth, and Average Bank Balance in the Excel file Banking Data. What conclusions can you reach?
> Use PivotTables to construct a cross-tabulation for the purpose of the loan and credit risk in the Excel file Credit Risk Data. Illustrate the results on a PivotChart
> In the Excel file Banking Data, apply the following data visualization tools:a. Use data bars to visualize the relative values of Median Home Value.b. Use color scales to visualize the relative values of Median Household Wealth.c. Use an icon set to show
> Construct a parallel coordinates chart for Median Income, Median Home Value, Median Household Wealth, and Average Bank Balance in the Excel file Banking Data. What conclusions can you reach?
> The Excel file Myatt Steak House provides 5 years of data on key business results for a restaurant. Identify the leading and lagging measures, find the correlation matrix, and propose a cause-and-effect model using the strongest correlations
> The Excel file Automobile Options provides data on options ordered together for a particular model of automobile. Develop a market basket analysis using the XLMiner association rules procedure with the input parameters support = 6 and confidence = 80
> Use the Excel file Banking Data.a. Construct a boxplot for the Median Income, Median Home Value, Median Household Wealth, and Average Bank Balance.b. What observations can you make about these data?
> A sample of 33 airline passengers found that the average check-in time is 2.167. Based on long-term data, the population standard deviation is known to be 0.48. Find a 95% confidence interval for the mean check-in time. Use the appropriate formula and ve
> For the PC Purchase Data, identify association rules with the following input parameters for the XLMiner association rules procedure:a. Support = 3; confidence = 90,b. Support = 7; confidence = 90,c. Support = 3; confidence = 70,d. Support = 7; confidenc
> The Excel file Credit Risk Data provides a database of information about loan applications, along with a classification of credit risk in column L. Convert the categorical data into numerical codes as appropriate. Then apply logistic regression to classi
> Using the data in the Excel file Student Grades, which represent exam scores in one section of a large statistics course, test the hypothesis that the variance in grades is the same for both tests
> The Excel file Credit Risk Data provides a database of information about loan applications along with a classification of credit risk in column L. Convert the categorical data into numerical codes as appropriate. Sample 200 records from the data set. The
> Suggest some metrics that a manager of a fast-food restaurant, such as McDonald’s or Chipotle, might want to collect. Describe how the manager might use the data to facilitate better decisions
> Fruity Juices, Inc., produces five different flavors of fruit juice: apple, cherry, pomegranate, orange, and pineapple. Each batch of product requires processing in three departments (blending, straining, and bottling). The relevant data (per 1,000-gallo
> The Excel file Credit Risk Data provides a database of information about loan applications along with a classification of credit risk in column L. Convert the categorical data into numerical codes as appropriate. Sample 200 records from the data set. The
> Use logistic regression to classify the new data in the Excel file Credit Approval Decisions Coded using only credit score and years of credit history as input variables
> Use discriminant analysis to classify the new data in the Excel file Credit Approval Decisions Coded using only credit score and years of credit history as input variables
> Construct cross-tabulations of Gender versus Carrier and Type versus Usage in the Excel file Cell Phone Survey. What might you conclude from this analysis?
> Figure 13.33 shows the Solver sensitivity report for the ColPal Products scenario in Problem 2. Using only the information in the sensitivity report, answer the following questions.Figure 13.33Sensitivity Report for ColPal Productsa. Suppose that the exp
> The background for this case was introduced in Chapter 1. This is a continuation of the case in Chapter 4. For this part of the case, compute confidence intervals for means and proportions, and analyze the sampling errors, possibly suggesting larger samp
> Figure 13.32 shows the Solver sensitivity report for Valencia Products in Problem 1. Using only the information in the sensitivity report, answer the following questions.Figure 13.32Sensitivity Report for Valencia Productsa. Explain why the reduced cost
> Figure 13.31 shows the sensitivity report after solving the Crebo Manufacturing model (Example 13.12) using Solver. Using only the information in the sensitivity report, answer the following questions.Figure 13.31Sensitivity Report for Crebo Manufacturin
> For the investment situation in Problem 4, apply the same logic as we did for the Crebo Manufacturing model in the text to find the optimal solution. Compare your answer with the Solver solution.In Problem 4A business student has $2,500 available from a
> For ColPal Products in Problem 2, modify the data in the model to create a problem with each of the followinga. Alternative optimal solutionsb. An unbounded solutionc. InfeasibilityIn Problem 2A brand manager for ColPal Products must determine how much t
> The Hansel Corporation, located in Bangalore, India, makes plastics materials that are mixed with various additives and reinforcing materials before being melted, extruded, and cut into small pellets for sale to other manufacturers. Four grades of plasti
> For Valencia Products in Problem 1, modify the data in the model to create a problem with each of the following.a. Alternative optimal solutionsb. An unbounded solutionc. InfeasibilityIn Problem 1Valencia Products makes automobile radar detectors and ass
> For the Burger Office Equipment model in Problem 3, graph the constraints and identify the feasible region. Then identify each of the corner points and show how increasing the objective function value identifies the optimal solution.In Problem 3Burger Of
> Apply three different colors of data bars to lunch, dinner, and delivery sales in the Excel file Restaurant Sales to visualize the relative amounts of sales. Then sort the data (hint: use a custom sort) by the day of the week beginning on Sunday. Compare
> Use the k-NN algorithm to classify the new data in the Excel file Credit Approval Decisions Coded using only credit score and years of credit history as input variables
> The Excel file Store and Regional Sales Database provides sales data for computers and peripherals showing the store identification number, sales region, item number, item description, unit price, units sold, and month when the sales were made during the
> For ColPal model in Problem 2, graph the constraints and identify the feasible region. Then identify each of the corner points and show how increasing the objective function value identifies the optimal solution.In Problem 2A brand manager for ColPal Pro
> Use Analytic Solver Platform to simulate the Outsourcing Decision Model under the assumptions that the production volume will be triangular with a minimum of 800, maximum of 1,700, and most likely value of 1,400, and that the unit supplier cost is normal
> The State of Ohio Department of Education has a mandated ninth-grade proficiency test that covers writing, reading, mathematics, citizenship (social studies), and science. The Excel file Ohio Education Performance provides data on success rates (defined
> Consider the data in the Excel file Nuclear Power. Use simple linear regression to forecast the data. What would be the forecasts for the next 3 years?
> Consider the data in the Excel file Consumer Price Index.a. Use simple linear regression to forecast the data. What would be the forecasts for the next 2 years?b. Use the double exponential smoothing procedure in XLMiner to find forecasts for the next 2
> Consider the prices for the DJ Industrials in the Excel file Closing Stock Prices. The data appear to have a linear trend over the time period provided.a. Use simple linear regression to forecast the data. What would be the forecasts for the next 3 days?
> For the data in the Excel file Gasoline Prices do the following:a. Develop spreadsheet models for forecasting prices using simple moving average and simple exponential smoothing.b. Compare your results to the outputs from Excel’s Data Analysis tools.c. U
> The Excel file Closing Stock Prices provides data for four stocks and the Dow Jones Industrials Index over a 1-month period.a. Develop spreadsheet models for forecasting each of the stock prices using simple 2-period moving average and simple exponential
> The Excel file Unemployment Rates provides data on monthly rates for 4 years. Compare 3- and 12-month moving average forecasts using the MAD criterion. Explain why the 3-month model yields better results
> The Excel file Energy Production & Consumption provides data on production, imports, exports, and consumption. Develop line charts for each variable and identify key characteristics of the time series (e. g., trends or cycles). Are any of these time seri
> Cluster the records in the Excel file Ten Year Survey. Create up to five clusters and analyze the results to draw conclusions about the survey
> Data in the Excel File Microprocessor Data shows the demand for one type of chip used in industrial equipment from a small manufacturer.a. Construct a chart of the data. What appears to happen when a new chip is introduced?b. Develop a causal regression
> For the data in the Excel file New Account Processing, perform chi-square tests for independence to determine if certification is independent of gender, and if certification is independent of having prior industry background
> Choose an appropriate forecasting technique for the data in the Excel file Treasury Yield Rates and find the best forecasting model. Explain how you would use the model to forecast and how far into the future it would be appropriate to forecast
> Use Excel’s filtering capability to(1) Extract all orders for control panels,(2) All orders for quantities of less than 500 units, and(3) All orders for control panels with quantities of less than 500 units in the Purchase Orders database
> Shafer Office Supplies has four distribution centers, located in Atlanta, Lexington, Milwaukee, and Salt Lake City, and ships to 12 retail stores, located in Seattle, San Francisco, Las Vegas, Tuscon, Denver, Charlotte, Minneapolis, Fayetteville, Birming
> Using the data in the Excel file Computer Repair Times, determine if the company can claim that its average repair time is less than 15 days
> Choose an appropriate forecasting technique for the data in the Excel file Prime Rate and find the best forecasting model. Explain how you would use the model to forecast and how far into the future it would be appropriate to forecast
> Choose an appropriate forecasting technique for the data in the Excel file Mortgage Rates and find the best forecasting model. Explain how you would use the model to forecast and how far into the future it would be appropriate to forecast
> Search the Conference Board’s Web site to find economic forecasts and reports about their business cycle indicators. Write a short report about your findings
> Choose an appropriate forecasting technique for the data in the Excel file Federal Funds Rates and find the best forecasting model. Explain how you would use the model to forecast and how far into the future it would be appropriate to forecast
> Choose an appropriate forecasting technique for the data in the Excel file DJIA December Close and find the best forecasting model. Explain how you would use the model to forecast and how far into the future it would be appropriate to forecast
> Choose an appropriate forecasting technique for the data in the Excel file Coal Consumption and find the best forecasting model. Explain how you would use the model to forecast and how far into the future it would be appropriate to forecast
> Apply cluster analysis to the Excel file Sales Data, using the input variables Percent Gross Profit, Industry Code, and Competitive Rating. Create four clusters and draw conclusions about the groupings
> Financial analysts often use the following model to characterize changes in stock prices:Pt = P0e(µ-0.5σ2)t+σZ√tWhereP0 = current stock pricePt = price at time tµ = mean (logarithmic) change of the stock price per unit timeσ = (logarithmic) standard devi
> The Excel file Olympic Track and Field Data provides the gold medal-winning distances for the high jump, discus, and long jump for the modern Olympic Games. Develop forecasting models for each of the events. What do your models predict for the next Olymp
> Construct an appropriate chart to show the proportion of funds in each investment category in the Excel file Retirement Portfolio
> The Excel file CD Interest Rates provides annual average interest rates on 6-month certificate of deposits. Compare the Holt-Winters additive and multiplicative models using XLMiner with the default parameters and a season of 6 years. Why does the multip
> Use the Holt-Winters no-trend model to find the best model to find forecasts for the next 12 months in the Excel file Housing Starts
> Use the Holt-Winters no-trend model to find the best model to forecast the next year of electricity usage in the Excel file Gas & Electric
> Create an Excel workbook with worksheet templates (similar to the Excel workbook Confidence Intervals) for one-sample hypothesis tests for means and proportions. Apply your templates to the example problems in this chapter. (For subsequent problems, you
> In the Purchase Orders database, conduct a Pareto analysis of the Cost per order data. What conclusions can you reach?
> Develop a multiple regression model with categorical variables that incorporate seasonality for forecasting housing starts beginning in June 2006 using the data in the Excel file Housing Starts
> Develop a multiple regression model with categorical variables that incorporate seasonality for forecasting sales using the last three years of data in the Excel file New Car Sales
> Develop a multiple regression model with categorical variables that incorporate seasonality for forecasting the temperature in Washington, D.C., using the data for years 1999 and 2000 in the Excel file Washington DC Weather. Use the model to generate for
> Set up an Excel worksheet to apply formulas (8.5) and (8.6) to compute the values of b0 and b1 for the data in the Excel file Home Market Value and verify that you obtain the same values as in Examples 8.4 and 8.5
> For the new-product model in Problem 9 of Chapter 11, suppose that the first-year sales volume is normally distributed with a mean of 100,000 units and a standard deviation of 10,000. Use the NORM.INV function and a one-way data table to conduct a Monte
> A recent MBA graduate, Dara, has gained control over custodial accounts that her parents had established. Currently, her money is invested in four funds, but she has identified several other funds as options for investment. She has $100,000 to invest wit
> Apply cluster analysis to the numerical data in the Excel file Credit Approval Decisions. Analyze the clusters and determine if cluster analysis would be a useful classification method for approving or rejecting loan applications
> Using the results of fitting the Home Market Value regression line in Example 8.4, compute the errors associated with each observation using formula (8.3) and construct a histogram
> Using the data in the Excel file Student Grades, construct a scatter chart for midterm versus final exam grades and add a linear trendline. What is the regression model? If a student scores 70 on the midterm, what would you predict her grade on the final
> Using the data in the Excel file Weddings construct scatter charts to determine whether any linear relationship appears to exist between(1) The wedding cost and attendance,(2) The wedding cost and the value rating, and(3) The couple’s income and wedding
> Use XLMiner and best subsets with stepwise selection to find the best model points per game for the National Football League data (see Problem 23).In Problem 23Use the p-value criterion to find a good model for predicting the number of points scored per
> For the Excel file Cereal Data, use XLMiner and best subsets with backward selection to find the best model
> The Excel file Investment Returns provides sample data for the annual return of the S&P 500, and monthly returns of a stock portfolio and bond portfolio. Construct histograms for each data set and use Analytic Solver Platform to find the best fitting dis
> Using the data in the Excel file Demographics, determine if a linear relationship exists between unemployment rates and cost of living indexes by constructing a scatter chart. Visually, do there appear to be any outliers? If so, delete them and then find
> Sort the data in the Excel file Automobile Quality from highest to lowest number of problems per 100 vehicles using the sort capability in Excel
> The Helicopter Division of Aerospatiale is studying assembly costs at its Marseilles plant. Past data indicates the following labor hours per helicopter:Helicopter Number __________Labor Hours1 ………………………………………………………………… 2,0002 ………………………………………………………………… 1
> Korey is a business student at State U. She has just completed a course in decision models, which had a midterm exam, a final exam, individual assignments, and class participation. She earned an 86% on the midterm, 94% on the final, 93% on the individual
> Suppose that a manufacturer can produce a part for $10.00 with a fixed cost of $5,000. The manufacturer can contract with a supplier in Asia to purchase the part at a cost of $12.00, which includes transportation.a. If the anticipated production volume i
> Elizabeth Burke wants some detailed statistical information about much of the data in the PLE database. In particular, she wants to know the following:a. The mean satisfaction ratings and standard deviations by year and region in the worksheets Dealer Sa
> Cost functions are often nonlinear with volume because production facilities are often able to produce larger quantities at lower rates than smaller quantities. Using the following data, apply simple linear regression, and examine the residual plot. What
> Use XLMiner to generate a simple random sample of 10 records from the Excel file Banking Data
> For the House Sales data described in Problem 25, develop a regression model for selling price as a function of lot cost and region, incorporating an interaction term. What would be the predicted price for a home in either the South or the Midwest with a
> A national homebuilder builds single-family homes and condominium-style townhouses. The Excel file House Sales provides information on the selling price, lot cost, type of home, and region of the country (M = Midwest, S = South) for closings during one m
> Use the p-value criterion to find a good model for predicting the number of points scored per game by football teams using the data in the Excel file National Football League

