Question: StatCrunch did a survey asking respondents how
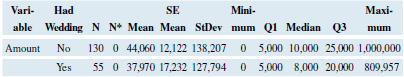
StatCrunch did a survey asking respondents how much they thought should be spent on a wedding and whether or not they had already had a wedding. The following table shows Minitab descriptive statistics for wedding costs. Compare the means and the standard deviations for those who had a wedding and those who had not. Which group thought more should be spent on a wedding? Which group had more variation in its responses?
Descriptive Statistics: Amount Statistics
> The following dotplot shows the distribution of passing rates for the bar exam law schools in the United States in. The five number summary is 0.60, 0.84, 0.90, 0.94, 1.00 Draw the boxplot and explain how you determined where the whiskers go.
> The dotplot shows the distribution of the heights (in feet) of a sample of roller coasters. The five-number summary of the data is given in the following table. Sketch a boxplot of the data. Explain how you determined the length of the whiskers.
> Data at this text’s website show the gas taxes for each of the 50 states and the District of Columbia. A summary of the data is shown in the following table. Should the maximum and minimum values of this data set be considered potential
> Data at this text’s website show the number of central public libraries in each of the 50 states and the District of Columbia. A summary of the data is shown in the following table. Should the maximum and minimum values of this data set
> Match each of the histograms (X, Y, and Z) with the corresponding boxplot (C, M, or P). Explain your reasoning.
> Name two measures of the center of a distribution, and state the conditions under which each is preferred for describing the typical value of a single data set.
> Data was collected on the industrial energy consumption per capita (in million BTUs) for all the states. A summary of the data is shown in the following table. (Source: eia.gov) Summary statistics: a. What percentage of the states consumed fewer than 47
> Data was collected on the total energy consumption per capita (in million BTUs) for all the states. A summary of the data is shown in the following table. (Source: eia.gov) Summary statistics: a. What percentage of the states consumed more than 390 mill
> A student shared data from the Stat Crunch Friend Data Application. Data on gender and number of wall posts for a sample of friends are shown below. (Source: Stat Crunch, Facebook Friend Data, posted 2/13/14) a. Is the format of this data set stacked or
> Use the data in Exercise 3.44, find and interpret the median domestic gross of the top five DC movies.
> Use the data in Exercise 3.43, find and interpret the median domestic gross of the top seven Marvel movies.
> The top seven movies based on DC comic book characters for the U.S. box office as of fall 2017 are shown in the following table, rounded to the nearest hundred million. (Source: ultimatemovieranking.com) a. Find and interpret the median in context. b. Fi
> The top ten movies based on Marvel comic book characters for the U.S. box office as of fall 2017 are shown in the following table, with domestic gross rounded to the nearest hundred million. (Source: ultimatemovieranking.com) a. Sort the domestic gross i
> Name two measures of the variation of a distribution, and state the conditions under which each measure is preferred for measuring the variability of a single data set.
> Data on residential energy consumption per capita (measured in million BTU) had a mean of 70.8 and a standard deviation of 7.3 for the states east of the Mississippi River. Assume that the distribution of residential energy use if approximately unimodal
> The histogram shows the number of runs scored by major league baseball teams for three seasons. The distribution is roughly unimodal and symmetric, with a mean of 687 and a standard deviation of 66 runs. An interval one standard deviation above and below
> Assume that women’s heights have a distribution that is symmetric and unimodal, with a mean of 64 inches and a standard deviation of 2.5 inches. a. What women’s height corresponds with a z-score of -1.00? b. Professional basketball player Evelyn Akhator
> Assume that men’s heights have a distribution that is symmetric and unimodal, with a mean of 69 inches and a standard deviation of 3 inches. a. What men’s height corresponds to a z-score of 2.00? b. What men’s height corresponds to a z-score of -1.50?
> Babies born after 40 weeks gestation have a mean length of 52.2 centimeters (about 20.6 inches). Babies born one month early have a mean length of 47.4 centimeters. Assume both standard deviations are 2.5 centimeters and the distributions are unimodal an
> Students who have accumulated fewer than 30 units are called Freshmen. a. Create a new categorical variable, named Freshman, that classifies each student in Table 1A as a freshman (less than 30 units) or not a freshman. Call this variable Freshman. Repor
> Babies born weighing 2500 grams (about 5.5 pounds) or less are called low-birthweight babies, and this condition sometimes indicates health problems for the infant. The mean birth weight for U.S.-born children is about 3462 grams (about 7.6 pounds). The
> Distributions of gestation periods (lengths of pregnancy) for humans are roughly bell-shaped. The mean gestation period for humans is 272 days, and the standard deviation is 9 days for women who go into spontaneous labor. Which is more unusual, a baby be
> Wechsler IQ tests have a mean of 100 and a standard deviation of 15. Which is more unusual: an IQ above 110 or an IQ below 80?
> Refer to the dotplot in the previous question. a. What is the height of a woman with a z-score of -1? b. What is the z-score for a woman who is 70 inches tall (5 feet 10 inches)?
> The dotplot shows heights of college women; the mean is 64 inches (5 feet 4 inches), and the standard deviation is 3 inches. a. What is the z-score for a height of 58 inches (4 feet 10 inches)? b. What is the height of a woman with a z-score of 1?
> In 2017 a pollution index was calculated for a sample of cities in the western states using data on air and water pollution. Assume the distribution of pollution indices is unimodal and symmetric. The mean of the distribution was 43.0 points with a stand
> In 2017 a pollution index was calculated for a sample of cities in the eastern states using data on air and water pollution. Assume the distribution of pollution indices is unimodal and symmetric. The mean of the distribution was 35.9 points with a stand
> The histogram shows the self-reported number of exercise hours in a week for 50 students. Without doing calculations, what is the approximate mean number of exercise hours for these 50 students? Explain.
> A real estate agent claims that all things being equal, houses with swimming pools tend to sell for less than those without swimming pools. What does this statement mean? (Pick the best choice.) a. There are fewer homes with swimming pools than without.
> A sociologist says, “Typically, men in the United States still earn more than women.” What does this statement mean? (Pick the best choice.) a. All men make more than all women in the United States. b. All U.S. women’s salaries are less varied than all m
> Explain why the variable Female, in Table 1A, is categorical, even though its values are numbers. Often, it does not make sense, or is not even possible, to add the values of a categorical variable. Does it make sense for Male? If so, what does the sum r
> The August 27, 2017, issue of Science Daily reported that higher coffee consumption is associated with a lower risk of death. This was based on an observational study of nearly 20,000 participants. Researchers found that participants who consumed at leas
> Is it possible for a standard deviation to be negative? Explain.
> Is it possible for a standard deviation to be equal to zero? Explain.
> The birth weights (in grams) are given for babies born to 22 mothers who smoked during their pregnancy and to 35 mothers who did not smoke. Seven pounds is about 3200 grams. (Source: Smoking Mothers, Holcomb 2006, accessed via StatCrunch. Owner: kupresan
> The number of alcoholic drinks per week is given for adult men and women who drink. The data are at this text’s website. (Source: Alcohol data from adults survey results, accessed via StatCrunch. Owner: rosesege) a. Compare the mean number of drinks for
> The prices (in $ thousand) of a sample of three-bedroom homes for sale in Florida and Georgia are shown in the table. (Source: Zillow.com) a. In which state are homes typically more expensive? Support your answer using an appropriate statistic. b. Which
> The prices (in $ thousand) of a sample of three-bedroom homes for sale in South Carolina and Tennessee are shown in the following table. Write a report that compares the prices of these homes. In your report, answer the questions of which state had the m
> Suppose you have a data set with the weights of all members of a high school soccer team and all members of a high school academic decathlon team (a team of students selected because they often answer quiz questions correctly). Which team do you think wo
> In the most recent summer Olympics, do you think the standard deviation of the running times for all men who ran the 100-meter race would be larger or smaller than the standard deviation of the running times for the men’s marathon? Explain.
> Four siblings are 2, 6, 9, and 10 years old. a. Calculate the mean of their current ages. Round to the nearest tenth. b. Without doing any calculation, predict the mean of their ages 10 years from now. Check your prediction by calculating their mean age
> From Amazon.com, the prices of 10 varieties of orange juice (59- to 64-ounce containers) sold were recorded: $3.88, $2.99, $3.99, $2.99, $3.69, $2.99, $4.49, $3.69, $3.89, $3.99. a. Find and interpret the mean price of orange juice sold on this site. Rou
> Suppose you decided to code living situation using Dorm as the label for the column. How many ones and how many zeroes would there be?
> The mean birth length for U.S. children born at full term (after 40 weeks) is 52.2 centimeters (about 20.6 inches). Suppose the standard deviation is 2.5 centimeters and the distributions are unimodal and symmetric. (Source: www.babycenter.com) a. What i
> The mean weight gain for women during a full-term pregnancy is 30.2 pounds. The standard deviation of weight gain for this group is 9.9 pounds, and the shape of the distribution of weight gains is symmetric and unimodal. (Source: BMJ 2016; 352 doi: https
> The histograms below were created from data on the daily high temperature in Los Angeles and New York City during a summer month. Compare the two distributions. Which city do you think has the higher typical temperature? Which city has more variation in
> The histograms below were created from data on the daily high temperature in San Jose and Denver during a winter month. Compare the two distributions. Which city do you think has the higher typical temperature? Which city has more variation in temperatur
> The tuition costs (in dollars) for a sample of four-year state colleges in California and Texas are shown below. Compare the means and the standard deviations of the data and compare the state tuition costs of the two states in a sentence or two. (Source
> College students and surfers Rex Robinson and Sandy Hudson collected data on the self-reported numbers of days surfed in a month for 30 longboard surfers and 30 shortboard surfers. Longboard: 4, 9, 8, 4, 8, 8, 7, 9, 6, 7, 10, 12, 12, 10, 14, 12, 15, 13,
> StatCrunch did a survey asking respondents their gender and how much they thought should be spent on a wedding. The following table shows Minitab descriptive statistics for wedding costs, split by gender. a. How many people were surveyed? b. Compare the
> The table shows the 100-meter backstroke and the 100-meter butterfly gold medal Olympic times (in seconds) for five recent Olympics. a. Find and interpret (report in context) the mean and standard deviation of the gold medal times for each stroke. Round
> The table show the gold medal Olympic times (in seconds) for the 200-meter run. Data are shown for the first five Olympics of the 1900s and five more recent Olympics in the 2000s. (Source: World Almanac and Book of Facts 2017) a. Find and interpret (rep
> What do the numbers 1 and 0 mean for the variable Female, in Table 1A (which is coded categorical data)? Often, it does not make sense, or is not even possible, to add a categorical variable. Does it make sense for Female? If so, what does the sum repres
> This list represents the number of children for the first six “first ladies” of the United States. (Source: 2009 World Almanac and Book of Facts) a. Find the mean number of children, rounding to the nearest tenth. Int
> The table shows the lengths (in miles) of major rivers in North America. (Source: World Almanac and Book of Facts 2017) a. Find and interpret (report in context) the mean, rounding to the nearest tenth mile. Be sure to include units for your answer. b.
> The table shows the names and heights of some of the tallest roller coasters in the United States. (Source: Today.com) a. Find and interpret (report in context) the mean height of these roller coasters. b. Find and interpret the standard deviation of th
> The table shows the location and number of floors in some of the tallest buildings in the world. (Source: Infoplease.com) a. Find and interpret (report in context) the mean number of floors in this data set. b. Find and interpret the standard deviation
> The following histogram shows the sodium level for 132 people (from the National Health and Nutrition Examination Survey [NHANES]). The units are milliequivalents per liter. Without calculating, give the approximate mean of this distribution.
> The following graph shows the heights for a large group of adults. Describe the distribution, and explain what might cause this shape. (Source: www.amstat.org)
> College students Diane Glover and Esmeralda Olguin asked 25 men and 25 women how many speeding tickets they had received in the last three years. Men: 14 men said they had 0 tickets, 9 said they had 1 ticket, 1 had 2 tickets, and 1 had 5 tickets. Women:
> The data that follow are final exam grades for two sections of statistics students at a community college. One class met twice a week relatively late in the day; the other class met four times a week at 11 a.m. Both classes had the same instructor and co
> The following table shows the gas tax (in cents per gallon) in each of the western U.S. states. (Source: 2017 World Almanac and Book of Facts) a. Find and interpret the median gas tax using a sentence in context. b. Find and interpret the interquartile r
> The following table shows the gas tax (in cents per gallon) in each of the southern U.S. states. (Source: 2017 World Almanac and Book of Facts) a. Find and interpret the median gas tax using a sentence in context. b. Find and interpret the interquartile
> Give an example of another categorical variable we might have recorded for the students whose data are in Table 1A?
> Data were collected on cereals stocked by a supermarket. A portion of the data table is shown below. Data includes shelf location (top, middle, bottom), name, manufacturer, type (hot or cold), and amount of calories, sodium and fiber per serving. Write o
> Data was collected on the tallest buildings in the United States. A portion of the data table is shown below. Write one or two investigative questions that could be answered using these data.
> The graphs below show the weights of professional basketball players. One graph displays the weights of Centers (C) and the other graph displays the weights of Shooting Guards (SG). Write one or two investigative questions that could be answered by analy
> The following graph shows the time it took grade 11 and 12 student athletes to run the 100-meter race (in seconds) in a recent year. Write one or two investigative questions that could be answered by analyzing these graphs.
> Here are the ages of some students in a statistics class: 17, 19, 35, 18, 18, 20, 27, 25, 41, 21, 19, 19, 45, and 19. The teacher’s age is 66 and should be included as one of the ages when you do the calculations. The figure shows a his
> The following histogram shows the average ticket prices of 28 Broadway shows in the 2017 season. The median ticket price was $97.33. (Source: BroadwayWorld.com) a. Describe the shape of the distribution. b. Would the mean of the data be greater than, les
> Mrs. Diaz has two children: a 3-yearold boy 43 inches tall and a 10-year-old girl 57 inches tall. Three year old boys have a mean height of 38 inches and a standard deviation of 2 inches, and 10-year-old girls have a mean height of 54.5 inches and a stan
> Quantitative SAT scores have a mean of 500 and a standard deviation of 100, while ACT scores have a mean of 21 and a standard deviation of 5. Assuming both types of scores have distributions that are unimodal and symmetric, which is more unusual: a quant
> Three-year-old boys in the United States have a mean height of 38 inches and a standard deviation of 2 inches. How tall is a three-year-old boy with a z-score of -1.0? (Source: www.kidsgrowth.com)
> An exam score has a mean of 80 and a standard deviation of 4. a. Find and interpret in context an exam score that corresponds with a z-score of 2. b. What exam score corresponds with a z-score of -1.5?
> Give an example of another numerical variable we might have recorded for the students whose data are in Table 1A?
> The following histograms show ticket prices for professional baseball (MLB) and professional basketball (NBA) tickets. a. Based on the shape of the distributions, which measure of center should be used to compare the prices: the mean or the median? b. Wr
> The following histograms show ticket prices for professional hockey (NHL) and professional football (NFL) tickets. a. Based on the shape of the distributions, which measure of center should be used to compare the prices: the mean or the median? b. Write
> The tables below show the 2015 unemployment rates for states in the northeastern and Midwestern regions of the United States. Compare the unemployment rates for the two regions, commenting on the typical unemployment rate of each region and then comparin
> The tables below show the percentage of the population in western and southern states of the U.S. with a bachelor’s degree. Write a short report comparing the education attainment of these two regions. In your report, answer the questio
> The mean of set A is smaller than that of set B, but the median of set B is smaller than that of set A. Report the mean and the median of both sets of data.
> The means are different, but the standard deviations are the same. Report the standard deviation and both means.
> The means are the same, but the standard deviation of one of the sets is larger than that of the other. Report the mean and both standard deviations.
> The means are the same, but the standard deviation of one of the sets is smaller than that of the other. Report the mean and both standard deviations.
> The histogram shows hours of sleep on a school night for a sample of 12th-grade students. a. Use the histogram and left-hand side of each bin to estimate the mean hours (to the nearest tenth) of sleep for 12th-graders on a school night. b. When comparing
> The New York Times collected data on the number of calories in meals at Chipotle restaurant. The distribution of calories was symmetric and unimodal and a graph of the distribution is shown below. a. Use the graph to estimate the mean number of calories
> Are the following variables, from Table 1A, numerical or categorical? Explain. a. Ring size b. Hair color c. Height
> A StatCrunch survey asked at what age should a person consider retirement. The data can be found at this text’s website. Who thinks people should retire at a younger age, males or females? Support your answer with appropriate graphs and summary statistic
> A StatCrunch survey asked people how many hours of video they watched daily. The data can be found at this text’s website. Who watches more hours of video, males or females? Support your answer with appropriate graphs and summary statistics. (Source: Sta
> The following histogram of marathon times includes data for men and women and also for both an Olympic marathon and an amateur marathon. Greater values indicate slower runners. (Sources: www.forestcityroadraces.com and www.runnersworld. com) a. Describe
> A student has gathered data on self-perceived body image, where 1 represents “underweight,” 2 represents “about right,” and 3 represents “overweight.â€&#
> The accompanying graph shows the distribution of data on whether houses in a large neighborhood have a garage. (A 1 indicates the house has a garage, and a 0 indicates it does not have a garage.) Is this a bar graph or a histogram? How could the graph be
> Refer to the accompanying bar chart, which shows the time spent on a typical day talking on the cell phone for some men and women. Each person was asked to choose the one of four intervals that best fit the amount of time he or she spent on the phone (fo
> The accompanying graph is a special histogram with additional information; it was made using StatCrunch. People who studied music as children were asked how many hours a day they practiced when they were teenagers, and whether they still play now that th
> The following graph shows the ages of females (labeled 1) and males (labeled 0) who are majoring in psychology in a four-year college. a. Is this a histogram or a bar graph? How do you know? b. What type(s) of graph(s) would be more appropriate?
> The pie chart reports the number of hours of sleep “last night” for 118 college students. What would be a better type of graph for displaying these data? Explain why this pie chart is hard to interpret.
> One of the authors wanted to determine the effect of changing answers on multiple-choice tests. She studied the tests given by another professor, who had told his students before their exams that if they had doubts about an answer they had written, they
> A sample of students were questioned to determine how much they would be willing to pay to see a movie in a theater that served dinner at the seats. The male students responded (in dollars): 10, 15, 15, 25, and 12. The female students responded: 8, 30, 1
> The following table gives the number of commercial U.S. radio stations for the four most popular formats. Sketch or otherwise create an appropriate graph of the distribution and comment on its important features. (Source: 2017 World Almanac and Book of F
> The following table gives the percent of the market controlled by the most popular Internet browsers in 2016. Sketch or otherwise create an appropriate graph of the distribution and comment on its important features. (Source: 2017 World Almanac and Book
> Data on the percentage of adults living in the United States who meet the federal aerobic fitness (AF) and muscle-strengthening (MS) standards are displayed in the bar plot. (Source: 2017 World Almanac and Book of Facts) a. Comment on the fitness similar

