Question: The graph of y = √3x – x2 is
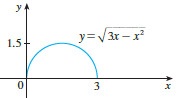
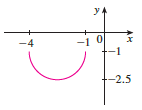
The graph of y = √3x – x2 is given. Use transformations to create a function whose graph is as shown.
Transcribed Image Text:
y y=V3r -r 1.5+ 3 -4 -1 0 -2.5
> Express the function in the form f0g. F (x) = cos2x
> Express the function in the form f0g. F (x) = (2x + x2)4
> At the surface of the ocean, the water pressure is the same as the air pressure above the water, 15 lb/in2. Below the surface, the water pressure increases by 4.34 lb/in2 for every 10 ft of descent. (a). Express the water pressure as a function of the de
> Find f0g0h. f (x) = tan x, g (x) = x/x-1, h (x) = 3√x
> Find f0g0h. f (x) = √x - 3 g (x) = x2 h (x) = x3 + 2
> Find f0g0h. f (x) = 2x - 1 g (x) = x2 h (x) = 1 - x
> Find f0g0h. f (x) = x + 1 g(x) = 2x h (x) = x - 1
> This exercise explores the effect of the inner function on a composite function y = f (g (x)). (a). Graph the function y = sin (√x) using the viewing rectangle [0, 400] by [-1.5, 1.5]. How does this graph differ from the graph of the sine function? (b).
> Find the domain and sketch the graph of the function. f (x) = 2 - 0.4x
> The curves with equations y = |x| / √c – x2 are called bullet-nose curves. Graph some of these curves to see why. What happens as c increases?
> Graph the function y = xn2-x, x > 0, for n = 1, 2 ,3, 4, 5 and 6. How does the graph change as n increases?
> Find the functions (a) f0g, (b) g0f, (c) f0f, and (d)g0g and their domains. f(x) — х — 2, д() — х* + Зх + 4
> Find the functions (a) f0g, (b) g0f, (c) f0f, and (d)g0g and their domains. f(x) = x ? - 1, g(x) = 2x + 1
> The manager of a furniture factory finds that it costs $2200 to manufacture 100 chairs in one day and $4800 to produce 300 chairs in one day. (a). Express the cost as a function of the number of chairs produced, assuming that it is linear. Then sketch th
> Find (a) f + g, (b) f - g, (c) fg, and (d) f/g and state their domains. f(x) = /3 – x, g(x) = /x² – 1
> Find (a) f + g, (b) f - g, (c) fg, and (d) f/g and state their domains. f(x) = x³ + 2x?, g(x) = 3x² – 1
> Graph the polynomials P (x) = 3x2 – 5x3 + 2x and Q (x) = 3x5 on the same screen, first using the viewing rectangle [-2, 2] by [-2, 2] and then changing to [-10, 10] by [-10000, 10000]. What do you observe from these graphs?
> (a). How is the graph of y = f (|x|) related to the graph of f? (b). Sketch the graph of y = sin |x|. (c). Sketch the graph of y = √|x|
> Use graphs to determine which of the functions f (x) = x4 - 100x3 and g (x) = x3 is eventually larger.
> Use the data in the table to model the population of the world in the 20th century by a cubic function. Then use your model to estimate the population in the year 1925. Population (millions) Population (millions) Year Year 1900 1650 1960 3040 1910 1
> We saw in Example 9 that the equation cos x = x has exactly one solution. (a) Use a graph to show that the equation cos x = 0.3 x has three solutions and find their values correct to two decimal places. (b) Find an approximate value of m such that the eq
> Graph the function by hand, not by plotting points, but by starting with the graph of one of the standard functions given in Section 1.2, and then applying the appropriate transformations. y
> Graph the function by hand, not by plotting points, but by starting with the graph of one of the standard functions given in Section 1.2, and then applying the appropriate transformations. tan 4 x 4
> Graph the function by hand, not by plotting points, but by starting with the graph of one of the standard functions given in Section 1.2, and then applying the appropriate transformations. y = |x – 2|
> (a). Try to find an appropriate viewing rectangle for f (x) = (x – 10)3 2-x. (b). Do you need more than one window? Why?
> Do the graphs intersect in the given viewing rectangle? If they do, how many points of intersection are there? у — 6 — 4х — х, у — Зr + 18; [-6, 2] by [-5, 20]
> Do the graphs intersect in the given viewing rectangle? If they do, how many points of intersection are there? у — Зx? — бх + 1, у-0.23х — 2.25; [-1, 3] by [-2.5, 1.5]
> Graph the hyperbola by graphing the functions y2 – 9x2 = 1 whose graphs are the upper and lower branches of the hyperbola.
> Graph the ellipse by graphing the functions 4x2 + 2y2 = 1 whose graphs are the upper and lower halves of the ellipse.
> Graph the function f (x) = x2 √30 – x in an appropriate viewing rectangle. Why does part of the graph appear to be missing?
> Graph the function by hand, not by plotting points, but by starting with the graph of one of the standard functions given in Section 1.2, and then applying the appropriate transformations. y = sin (x/2)
> Determine an appropriate viewing rectangle for the given function and use it to draw the graph. y = x2 + 0.02 sin 50x
> Graph the function by hand, not by plotting points, but by starting with the graph of one of the standard functions given in Section 1.2, and then applying the appropriate transformations. y = 1 + 2 cos x
> Determine an appropriate viewing rectangle for the given function and use it to draw the graph. f(x) = sec(207x)
> Graph the function by hand, not by plotting points, but by starting with the graph of one of the standard functions given in Section 1.2, and then applying the appropriate transformations. y = (x + 1)2
> Jason leaves Detroit at 2:00 PM and drives at a constant speed west along I-96. He passes Ann Arbor, 40 mi from Detroit, at 2:50 PM. (a). Express the distance traveled in terms of the time elapsed. (b). Draw the graph of the equation in part (a). (c). Wh
> Determine an appropriate viewing rectangle for the given function and use it to draw the graph. f() — сos(0.001x)
> Determine an appropriate viewing rectangle for the given function and use it to draw the graph. f(x) = sin (1000x)
> Determine an appropriate viewing rectangle for the given function and use it to draw the graph. f(x) = x? + 100
> Determine an appropriate viewing rectangle for the given function and use it to draw the graph. f (x) = x3 – 225x
> Determine an appropriate viewing rectangle for the given function and use it to draw the graph. f (x) = √0.1x +20
> Determine an appropriate viewing rectangle for the given function and use it to draw the graph. f(x) = /81 - x*
> Determine an appropriate viewing rectangle for the given function and use it to draw the graph. f (x) = x3 + 15x2 +65x
> Determine an appropriate viewing rectangle for the given function and use it to draw the graph. f(x) — х2 — 36х + 32
> Use a graphing calculator or computer to determine which of the given viewing rectangles produces the most appropriate graph of the function f (x) = x4 – 16x2 + 20. (a) [-3, 3] by [-3, 3] (c) [-50, 50] by [-50, 50] (b) [-10, 10] by
> Use a graphing calculator or computer to determine which of the given viewing rectangles produces the most appropriate graph of the function f (x) = √x3 - 5x2. (a) [-5, 5] by [-5, 5] (b) [0, 10] by [0, 2] (c) [0, 10] by [0, 10]
> Determine an appropriate viewing rectangle for the given function and use it to draw the graph. y = 10sin x + sin100 x
> Graph the function by hand, not by plotting points, but by starting with the graph of one of the standard functions given in Section 1.2, and then applying the appropriate transformations. y = -x3
> Determine whether the curve is the graph of a function of x. If it is, state the domain and range of the function. 1 이 1
> The graph of y = √3x – x2 is given. Use transformations to create a function whose graph is as shown. y y=V3r -r 1.5+ 3 y. 3+ 2 5
> Determine whether the curve is the graph of a function of x. If it is, state the domain and range of the function. 이
> Match each equation with its graph. Explain your choices. (Don’t use a computer or graphing calculator.) y 4 f (а) у %3D Зх (c) y = x' (b) y = 3" (а) у —
> Find the functions (a) f0g, (b) g0f, (c) f0f, and (d)g0g and their domains. f(4) =T g(x) = sin 2x 1 +x"
> Find the functions (a) f0g, (b) g0f, (c) f0f, and (d)g0g and their domains. f(x) = JE, g(x) = VT- x
> Find the functions (a) f0g, (b) g0f, (c) f0f, and (d)g0g and their domains. f(x) = 1 - 3x, g(x) = cos x
> Evaluate the difference quotient for the given function. Simplify your answer. x + 3 x + 1' f(x) – f(1) x - 1 f(x)
> The manager of a weekend flea market knows from past experience that if he charges dollars for a rental space at the market, then the number of spaces he can rent is given by the equation y = 200 - 4x. (a). Sketch a graph of this linear function. (Rememb
> The table shows the mean (average) distances d of the planets from the sun (taking the unit of measurement to be the distance from the earth to the sun) and their periods T (time of revolution in years). (a). Fit a power model to the data. (b). Kepler&
> Graph the function by hand, not by plotting points, but by starting with the graph of one of the standard functions given in Section 1.2, and then applying the appropriate transformations. y = |cos
> Graph the function by hand, not by plotting points, but by starting with the graph of one of the standard functions given in Section 1.2, and then applying the appropriate transformations. y = 1 + - 1
> Graph the function by hand, not by plotting points, but by starting with the graph of one of the standard functions given in Section 1.2, and then applying the appropriate transformations. y =}(x? + 8x)
> Graph the function by hand, not by plotting points, but by starting with the graph of one of the standard functions given in Section 1.2, and then applying the appropriate transformations. y = |x| - 2
> Graph the function by hand, not by plotting points, but by starting with the graph of one of the standard functions given in Section 1.2, and then applying the appropriate transformations. y = √x + 3
> Graph the function by hand, not by plotting points, but by starting with the graph of one of the standard functions given in Section 1.2, and then applying the appropriate transformations. y = 1/ x - 4
> Graph the function by hand, not by plotting points, but by starting with the graph of one of the standard functions given in Section 1.2, and then applying the appropriate transformations. y = 4 sin 3x
> Graph the function by hand, not by plotting points, but by starting with the graph of one of the standard functions given in Section 1.2, and then applying the appropriate transformations. y = x2 - 4x + 3
> Graph the function by hand, not by plotting points, but by starting with the graph of one of the standard functions given in Section 1.2, and then applying the appropriate transformations. y = 1 - x2
> Determine an appropriate viewing rectangle for the given function and use it to draw the graph. f(x) = sin Ja %3D
> Determine whether the curve is the graph of a function of x. If it is, state the domain and range of the function. 이
> What do all members of the family of linear functions f (x) = c - x have in common? Sketch several members of the family
> Graphs of f and g are shown. Decide whether each function is even, odd, or neither. Explain your reasoning. yA
> An electricity company charges its customers a base rate of $10 a month, plus 6 cents per kilowatt-hour (kWh) for the first 1200 kWh and 7 cents per kWh for all usage over 1200 kWh. Express the monthly cost E as a function of the amount of electricity us
> What do all members of the family of linear functions f (x) = 1 + m (x+3) have in common? Sketch several members of the family.
> A Norman window has the shape of a rectangle surmounted by a semicircle. If the perimeter of the window is 30 ft, express the area A of the window as a function of the width of the window. -r-
> Find a formula for the described function and state its domain. Express the surface area of a cube as a function of its volume.
> Find an expression for the function whose graph is the given curve. The top half of the circle x2 + (y – 2)2 = 4
> Find an expression for the function whose graph is the given curve. The line segment joining the points (-5, 10) and (7, -10).
> Find an expression for the function whose graph is the given curve. The line segment joining the points (1, -3) and (5, 7).
> The graph shows the height of the water in a bathtub as a function of time. Give a verbal description of what you think happened. height (inches) 15+ 10t time (min) 10 15 in
> Suppose the graph of f is given. Write equations for the graphs that are obtained from the graph of f as follows. (a). Shift 3 units upward. (b). Shift 3 units downward. (c). Shift 3 units to the right. (d). Shift 3 units to the left. (e). Reflect about
> What is the Pigou effect and how does it result in a downward-sloping aggregate demand curve?
> Explain the difference between movement down, or along, the aggregate demand curve and a shifting out of the aggregate demand curve.
> Bobby is confused. He states: “Since prisoners are not allowed to smoke in prisons any longer, Radford’s examples of cigarettes in POW camps no longer applies.” How would you explain to Bobby how Radford’s story demonstrates the concepts of the criteria
> You read a news story about a country that is suffering from rapid, ongoing increases in the cost of living. Which characteristic of money is being directly negatively impacted in that economy?
> How many prices must a barter economy have if the economy has four goods? What if it has 400 goods? Explain why having a money in the second case is beneficial.
> Under which theory might a steep yield curve suggest market participants are worried that inflation will increase in the future?
> Offer an explanation of how Operation Twist may have resulted in a flat yield curve.
> Offer two different explanations for why an inverted yield curve might signal an economic slowdown is on the way.
> Proponents of segmented market theory disagree with which of the following?
> How would proponents of the term premium theory explain why a yield curve becomes more steep from one time period to the next?
> How is the makeup of assets and liabilities of life insurance companies different from those of depository institutions? Why?
> According to the pure expectations theory, what is happening when the yield becomes more steep from one-time period to the next? What does that tell you?
> If Kari is the 35% income tax bracket and is thinking about buying a corporate bond that yields 2.5%, what yield must a muni bond pay to make her indifferent between the two bonds, ceteris paribus?
> If Tommy is in the 15% income tax bracket and is considering buying a muni bond that yields 3%, what yield would a corporate bond have to pay to make him indifferent between the two bonds, ceteris paribus?
> Do you think the preferential tax treatment of muni bonds should be eliminated? Or, should the tax benefit of muni bonds be reduced? Why or why not?
> Which of the following is not an assumption of the simple deposit multiplier?
> You read a story in the press that there are growing fears of a credit crunch. What impact might this have in terms of the simple deposit multiplier?
> Explain how architecture may have been used to avoid bank runs.
> According to the simple deposit multiplier, what happens if there is a deposit and the required reserve ratio is zero?
> If $100 million is withdrawn from the banking system, what would happen to the money supply, according to the simple deposit multiplier, if the required reserve ratio is 4%? What if the required reserve ratio is 6%? What do you think will happen to inter

