Question: This case is a continuation of Case
This case is a continuation of Case 2.4.
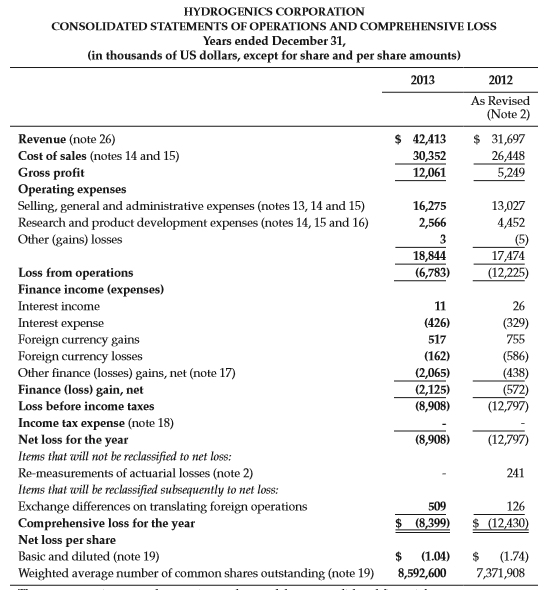
(a) Open the financial statement analysis template that you saved from the Chapter 2 hydrogenics Case. Click on the “Cover†tab at the bottom of the screen. Input the check figures for the Income Statement section of this page. Click on the “Income Statement†tab and input the data from the income statement included for hydrogenics in this case. Be sure to input the basic earnings per share amounts at the bottom of the page. When you have finished inputting the data, review the income statement to make sure there are no red blocks indicating that your numbers do not match the cover sheet information check figures. Make any necessary corrections before printing out your input and the common-size income statement and growth rate analysis pages that the template automatically creates for you. Save the template on your computer or a disk in order to use it with subsequent problems in later chapters.
(b) Using the hydrogenics income statement, the common size-income statement, growth rate analysis sheet and the excerpts from the notes and management discussion and analysis, analyze the profitability of hydrogenics.
The accompanying notes form an integral part of these consolidated financial statements.
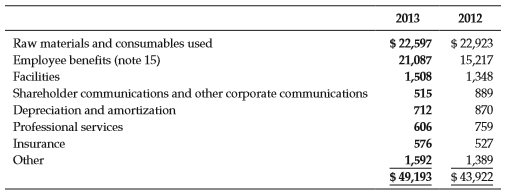
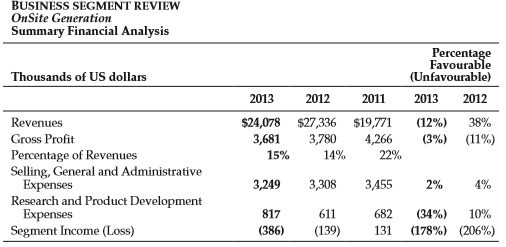
Note 14. Expenses by Nature
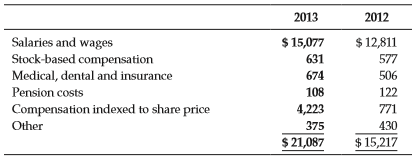
Note 15. Employee benefits Expense
Expenditures for employee benefits are as follows:
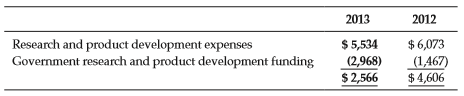
Note 16. research and Product Development Expenses
Research and product development expenses are recorded net of non-repayable third party program funding received or receivable. For the years ended December 31, 2013, and 2012, research and product development expenses and non-repayable program funding, which have been received or are to be received, are as follows:
2013 Management’s Discussion and Analysis of Financial
Condition and results of Operations
1. Our Business
A summary of our business and how we address our markets
How We Are Organized
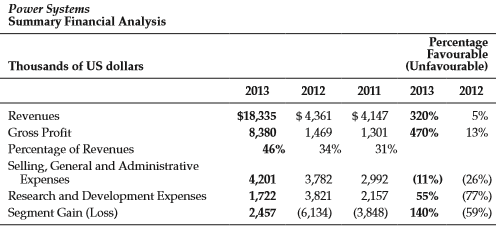
We operate in various geographic markets and organize ourselves in two reportable segments.
Our OnSite Generation business segment is based in Oevel, Belgium and develops products for industrial gas, hydrogen fueling and renewable energy storage markets. For the year ended December 31, 2013, our OnSite Generation business reported revenues of $24.1 million and, at December 31, 2013, had 73 full-time employees.
Our Power Systems business segment is based in Mississauga, Canada, with a satellite facility in Gladbeck, Germany, and develops products for energy storage, stationary and motive power applications. For the year ended December 31, 2012 our Power Systems business reported revenues of $18.3 million and, at December 31, 2013 had 62 full-time employees.
OnSite Generation
Our OnSite Generation business segment is based on water electrolysis technology which involves the decomposition of water into oxygen (O2) and hydrogen gas (H2) by passing an electric current through a liquid electrolyte. The resultant hydrogen gas is then captured and used for industrial gas applications, hydrogen fueling applications, and is used to store renewable and surplus energy in the form of hydrogen gas. Our hySTAT® branded electrolyzer products are based on 60 years of hydrogen experience, meet international standards, such as ASME, CE, rostechnadzor and UL, and are certified ISO 9001 from design to delivery. We configure our hySTAT® products for both indoor and outdoor applications and tailor our products to accommodate various hydrogen gas requirements.
The worldwide market for hydrogen, which includes the merchant gas market for hydrogen, is estimated at $5 billion annually, and is served by industrial gas companies as well as on-site hydrogen generated by products manufactured by companies such as ours. We believe the annual market for on-site hydrogen generation equipment is approximately $100 million to $200 million. We believe the size of the addressable market for on-site hydrogen generation equipment could more than double if energy storage and electrolysis based hydrogen fueling stations gain widespread acceptance.
Our OnSite Generation products are sold to leading merchant gas companies, such as Air Liquide and Linde Gas and end-users requiring high purity hydrogen produced onsite for industrial applications. We also sell and service products for progressive oil and gas companies, such as Shell hydrogen, requiring hydrogen fueling stations for transportation applications. recently, an increase in orders and interest for fueling stations in Europe and elsewhere, has signaled what we believe could be a major increase in the size of this market. During the past year, we have also witnessed an increase in interest and orders for our small, medium and large scale energy storage products, which also service the need for ancillary electrical power services, such as grid balancing and load profiling. While this area is heavily dependent on public funding initiatives, particularly in Europe, it continues to present compelling growth opportunities. In 2009, we began to sell our products to leading electric power utilities to satisfy the need for renewable energy storage……………………
Transcribed Image Text:
HYDROGENICS CORPORATION CONSOLIDATED STATEMENTS OF OPERATIONS AND COMPREHENSIVE LOSS Years ended December 31, (in thousands of US dollars, except for share and per share amounts) 2013 2012 As Revised (Note 2) $ 42,413 30,352 12,061 $ 31,697 26,448 5,249 Revenue (note 26) Cost of sales (notes 14 and 15) Gross profit Operating expenses Selling, general and administrative expenses (notes 13, 14 and 15) Research and product development expenses (notes 14, 15 and 16) Other (gains) losses 16,275 13,027 4,452 (5) 17,474 2,566 3 18,844 (12,225) Loss from operations Finance income (expenses) (6,783) Interest income 11 26 (426) Interest expense Foreign currency gains Foreign currency losses Other finance (losses) gains, net (note 17) Finance (loss) gain, net (329) 517 755 (162) (2,065) (2,125) (8,908) (586) (438) (572) (12,797) Loss before income taxes Income tax expense (note 18) Net loss for the year Items that will not be reclassified to net loss: Re-measurements of actuarial losses (note 2) (8,908) (12,797) 241 Items that will be reclassified subsequently to net loss: Exchange differences on translating foreign operations Comprehensive loss for the year Net loss per share Basic and diluted (note 19) Weighted average number of common shares outstanding (note 19) 509 126 $ (8,399) $ (12,430) (1.04) (1.74) 7,371,908 $ 8,592,600 2013 2012 $ 22,597 $ 22,923 15,217 1,348 Raw materials and consumables used Employee benefits (note 15) Facilities 21,087 1,508 Shareholder communications and other corporate communications Depreciation and amortization 515 889 712 870 Professional services 606 759 Insurance 576 527 Other 1,592 1,389 $ 49,193 $ 43,922 2013 2012 Salaries and wages Stock-based compensation $ 15,077 $ 12,811 631 577 Medical, dental and insurance 674 506 Pension costs 108 122 Compensation indexed to share price 4,223 771 Other 375 430 $ 21,087 $ 15,217 2013 2012 $ 5,534 Research and product development expenses Government research and product development funding $6,073 (1,467) $ 4,606 (2,968) $ 2,566 BUSINESS SEGMENT REVIEW OnSite Generation Summary Financial Analysis Percentage Favourable (Unfavourable) Thousands of US dollars 2013 2012 2011 2013 2012 Revenues $24,078 $27,336 $19,771 3,780 14% (12%) 38% Gross profit 3,681 4,266 (3%) (11%) Percentage of Revenues Selling, General and Administrative Expenses Research and product development Еxpenses Segment Income (Loss) 15% 22% 3,249 3,308 ЗА55 2% 4% 10% (178%) (206%) 817 611 682 (34%) (386) (139) 131 Power Systems Summary Financial Analysis Percentage Favourable (Unfavourable) Thousands of US dollars 2013 2012 2011 2013 2012 $ 4,147 1,301 Revenues $18,335 $4,361 320% 5% Gross profit 8,380 1,469 470% 13% Percentage of Revenues Selling, General and Administrative Expenses Research and Development Expenses Segment Gain (Loss) 46% 34% 31% 4,201 1,722 3,782 3,821 (6,134) 2,992 2,157 (11%) (26%) (77%) (59%) 55% 2,457 (3,848) 140%
> What can creditors, investors, and other users learn from an analysis of the cash flow statement?
> How does the direct method differ from the indirect method?
> Define the following terms as they relate to the statement of cash flows: cash, operating activities, investing activities, and financing activities.
> Prior to the financial recession in the late 2000s, some companies had built up significant cash balances. Since that time some companies have continued to increase their cash balances and discussions began about whether “cash hoarding” by firms was an a
> Write a short article (250 words) for a local business publication in which you explain why cash flow from operations is important information for small business owners.
> The following cash flows were reported by Techno Inc. in 2015 and 2014. (a) Explain the difference between net income and cash flow from operating activities for Techno in 2015. (b) Analyze Techno Inc.’s cash flows for 2015 and 2014.
> The following comparative balance sheets and income statement are available for AddieMae Inc. Prepare a statement of cash flows for 2016 using the indirect method and analyze the statement. December 31, 2016 2015 $ 3,300 1,100 11,200 $15,600 Cash $
> The following income statement and balance sheet information are available for two firms, Firm A and Firm B. (a) Calculate the amount of dividends Firm A and Firm B paid using the information given. (b) Prepare a statement of cash flows for each firm usi
> Discuss the four items that are included in a company’s comprehensive income.
> Explain how a company could have a decreasing gross profit margin but an increasing operating profit margin.
> Discuss all reasons that could explain an increase or decrease in gross profit margin.
> Income statements are presented for the Elf Corporation for the years ending December 31, 2016, 2015, and 2014. Required: Write a one-paragraph analysis of Elf Corporation’s profit performance for the period. To the Student: The focus
> LA Theatres Inc. has two distinct revenue sources, ticket and concession revenues. The following information from LA Theatres Inc. income statements for the past three years is available: (a) Calculate gross profit margins for tickets and concessions f
> Income statements for Yarrick Company for the years ending December 31, 2016, 2015, and 2014 are shown below. Prepare a common-size income statement and analyze the profitability of the company. Yarrick Company Income Statements for the Years Ending
> Prepare a multiple-step income statement for Jackrabbit Inc. from the following single step statement. Net sales……………………………………………………..$1,840,000 Gain on sale of equipment……………………………………15,000 Interest income…………………………………………………..13,000
> Using the excerpt from the Moon Company’s annual report, calculate any profit measures deemed necessary and discuss the implications of the profitability of the company. Moon Company Income Statements for the Years Ended December 3
> Why is the bottom line figure, net income, not necessarily a good indicator of a firm’s financial success?
> What is the purpose of listing the account “Commitments and contingencies” on the balance sheet even though no dollar amounts appear?
> Discuss the difference between the straight-line method of depreciation and the accelerated methods. Why do companies use different depreciation methods for tax reporting and financial reporting?
> Why would a company switch to the LIFO method of inventory valuation in an inflationary period?
> Why is the valuation of inventories important in financial reporting?
> At fiscal year-end December 31, 2015, ShopWorld had the following assets and liabilities on its balance sheet (in millions): Current liabilities……………&aci
> From the following accounts, prepare a balance sheet for Chester Co. for the current calendar year. Accrued interest payable………………………………$ 1,400 Property, plant, and equipment……………………34,000 Inventory…………………………………………………….12,400 Additional paid-in capital…
> Discuss how marketable securities are valued on the balance sheet.
> Using the following amounts (in thousands) reported in Zebra technologies consolidated balance sheets and statements of income at December 31, 2013 and 2012, and the valuation schedule, analyze the accounts receivable and allowance accounts for all years
> The following information is available for Chemco Inc’s inventories as of June 30, 2015: We used the LIFO method of valuing our inventories for approximately 40% and 44% of total inventories at June 30, 2015 and 2014, respectively. (
> The F.L.A.C. Corporation sells a single product. the following is information on inventory, purchase, and sales for the current year: (a) Compute the inventory balance and the cost of goods sold expense reported at the end of the year using the followi
> Tucker’s technology had the following goods available for sale in the last accounting period: Beginning inventory…………………………………..100 units @ $ 5 Purchases (in order from first to last):………..140 units @ $ 7
> Access the FaSB website: http://www.fasb.org. Locate information about projects that the FaSB and IaSB are working on related to international convergence. Write a short essay outlining the topics that the FaSB and IaSB are currently working on and the p
> Explain how treasury stock affects the stockholders’ equity section of the balance sheet and the calculation of earnings per share.
> Staff members from the marketing department of your firm are doing a splendid job selling products to customers. Many of the customers are so pleased, in fact they are also buying shares in the company’s stock, which means that they receive a copy of the
> What information is provided in a balance sheet?
> What is a proxy statement, and why is it important to the analyst?
> Why is the management discussion and analysis useful to the financial analyst?
> What causes an auditor’s report to be qualified? adverse? a disclaimer of opinion? Unqualified with explanatory language?
> Explain the importance of the notes to the financial statements.
> Describe the financial statements that are contained in an annual report or Form 10-K.
> How can the allowance for doubtful accounts be used to assess earnings quality?
> What are the particular items an analyst should review and study in an annual report, and what material should be read with caution?
> What is the difference between an annual report and a 10-Kreport?
> What types of questions can be answered by analyzing financial statements?
> The 2013 Intel Form 10-K can be found at the following Web site: www.pearsonhighered .com/fraser. (a) Prepare a summary analysis of the Statements of Cash Flows for all three years. (b) Analyze the Consolidated Statements of Cash Flows for Intel for 2013
> This case is a continuation of Cases 2.4, 3.4, and 4.4. (a) Open the financial statement template that you have saved from the Chapter 4 hydrogenics Case. Click on the “ratios” tab at the bottom of the screen and print out this page. (b) Using all inform
> The following excerpts are from the 2013 Form 10-K of Facebook, Inc11. See Accompanying Notes to Consolidated Financial Statements. See Accompanying Notes to Consolidated Financial Statement Item 1. Business Overview Our mission is to give peopl
> Each chapter in the textbook contains a continuation of this problem. The objective is to learn how to do a comprehensive financial statement analysis in steps as the content of each chapter is learned. Using the 2013 Applied Materials Form 10-K, which c
> The 2013 Intel Annual report can be found at the following Web site: www.pearsonhighered.com/fraser. Using the annual report, answer the following questions: (a) Using the Intel Annual report, calculate key financial ratios for all years presented. (b)
> This case is a continuation of Cases 2.4 and 3.4. (a) Open the financial statement analysis template that you saved from the Chapter 3 hydrogenics Case. Click on the “Cover” tab at the bottom of the screen.
> Avnet is one of the world’s largest value-added distributors of electronic componenets, enterprise computer and storage products, IT services and embedded subsystems. Avnet creates a vital link in the technology supply chain that connec
> Using the 2013 Applied Materials Form 10-K, which can be found at www.pearsonhighered.com/fraser, complete the following requirements: (a) Open the financial statement analysis template that you saved from the Chapter 1 Applied Materials problem and inpu
> The following excerpts are from the Logitech International S.A. Form 10-K. Item 1. business Company overview Logitech is a world leader in products that connect people to the digital experiences they care about. Spanning multiple computing, communica
> Using the 2013 Applied Materials Form 10-K, which can be found at www.pearsonhighered.com/fraser, complete the following requirements: (a) Open the financial statement analysis template that you saved from the Chapter 1 Applied Materials problem and inpu
> The 2013 Intel Form 10-K can be found at the following Web site: www.pearsonhighered .com/fraser. (a) Using the consolidated statements of operations, analyze the profitability of Intel by preparing a common-size income statement for the past three years
> The 2013 Intel Form 10-K can be found at the following Web site: www .pearsonhighered.com/fraser. the company’s annual report which includes the letters from the cEO and the chairman can be found at the company’s website: www .intc.com. Using the Form 10
> Andreka Inc. uses the direct method to allocate support department costs to production departments (fabricating and finishing). Information for June 2010 follows. a. What amounts of human resources and administration costs should be assigned to Fabricat
> The manager at Mannie’s Floor Coverings is interested in purchasing a computer and software that would allow company salespeople to demonstrate to customers how a finished carpet installation would appear. The total cost of the computer, software, and pe
> Double K Corp. has established a 12 percent target ROI for 2010 for its Jamestown Division. The following data have been gathered for the division’s operations for 2010: average total assets, $11,200,000; revenues, $30,000,000; and expenses, $28,000,000.
> On April 1, 2010, Topeka Brake Mfg. purchased new computer-based production scheduling software for $480,000. On May 15, 2010, a representative of a computerized manufacturing technology company demonstrated new software that was clearly superior to that
> Data for the three autonomous divisions of Arizona Mining, Inc. for fiscal year 2010 follow. Compute the return on investment for each division. Division 1 Division 2 Division 3 Segment income $ 220,000 $ 350,000 $ 4,500,000 Asset investment 2,500,0
> Monet’s Prints has the following revenue and cost functions: Revenue = $60 per unit Cost =$120,000 $30 per unit a. What is the break-even point in units? b. What is the break-even point in dollars?
> Memphis Jazz Company is preparing a pamphlet that will provide information on the types of jazz, jazz terminology, and biographies of some of the better-known jazz musicians. In addition, the pamphlet will include a request for funding to support the jaz
> The following financial data have been determined from analyzing the records of Tim’s Brake Co. (a one-product firm): Contribution margin per unit ………………………$ 50 Variable cost per unit …………………………………….42 Annual fixed cost ……………………………….$180,000 How does ea
> Macon Farms raises peaches that, at harvest, are separated into three grades: premium, good, and fair. Joint cost is allocated to products based on bushels of output. The $337,500 joint cost for one harvest yielded the following output quantities.
> Portsmouth Port Services creates and maintains shipping channels at various ports around the world. The company is considering the purchase of a $72,000,000 ocean-going dredge that has a 5-year life and no salvage value. The company depreciates assets on
> You have just purchased a new car, making a down payment of $8,000 and financing the balance of the purchase cost on an installment credit plan. According to the credit agreement, you will pay $600 per month for a period of 48 months. If the credit agree
> You have just invested $60,000 in a bank account that guarantees to pay you 6 percent interest, compounded annually. At the end of 5 years, how much money will have accumulated in your investment account? (Ignore taxes.)
> Brenda’s Bees is considering the purchase of new honey processing equipment. The equipment would cost $100,000, have an expected life of 7 years, and save the firm $28,000 annually in maintenance, operating, and cleanup costs. The firm’s cost of capital
> Mosbee Designs uses a job order costing system to account for the various architectural services offered to commercial clients. For each major job, architectural models of the completed structures are built for client presentations. At the completion of
> Renaissance Creations restores antique stained glass windows. All jobs generate some breakage or improper cuts. This scrap can be sold to stained glass hobbyists. Renaissance Creations expects to incur approximately 45,000 direct labor hours during 2010.
> Ramirez Tax Services is considering the installation of a new system for electronically filing tax returns. The system has an initial cost of $80,000 and an expected life of 5 years. a. If the company’s cost of capital is 10 percent, how much annual incr
> Trady’s Tree People manufactures wood statues, which yields sawdust as a by-product. Selling costs associated with the sawdust are $25 per ton sold. The company accounts for sawdust sales by deducting the sawdust’s net realizable value from the major pr
> New York Fabrics makes three clothing items: pants, shorts, and shirts. Contribution margins for the products are $4.25, $4.05, and $2.70 per unit, respectively. The company’s manager must decide what mix of clothes to make. New York Fa
> Lundholm Corp. is considering the purchase of a robotic machine that would replace a manual labor production task. This project would require an upfront cash commitment of $2,000,000 to purchase and install the equipment. The equipment would have an expe
> The variable costs for four different products are $9.30, $7.86, $8.78, and $19.44. State the objective function in equation form to minimize the variable costs.
> The contribution margins for three different products are $19.00, $8.00, and $3.50. State the objective function in equation form to maximize the contribution margin.
> For each of the following limitations of the capital project evaluation methods, indicate to which method, or methods, the limitation applies. Consider all of the following methods: payback, NPV, PI, IRR, and ARR (accounting rate of return). a. Cash flow
> Qvat Division, a subsidiary of Imogene Ltd., manufactures a product with the following costs: Direct material …………………………………..$15.00 Direct labor ………………………………………...26.25 Variable overhead ……………………………….12.75 Fixed overhead …………………………………..18.00 Total ………………
> For each of the following assumptions that underlie the capital project evaluation methods, indicate to which method, or methods, the assumption applies. Consider all of the following methods: payback, NPV, PI, IRR, and ARR (accounting rate of return). a
> Three years ago, Girston Gravel Pit purchased a material conveyor system. The company has decided to sell the system and acquire more advanced technology. Data relating to the existing system follow. Current market value …………………………………………………………..$37,000 O
> Winnovia Mills processes cotton in a joint process that yields two joint products: fabric and yarn. May’s joint cost is $120,000, and thesales values at split-off are $360,000 for fabric and $300,000 for yarn. If the products are processed beyond split-o
> Jenna Smith recently purchased an annuity contract that will pay her $125,000 per year for the next 7 years. According to Smith’s calculations, the estimated internal rate of return on this investment is 14 percent. If Smith’s cost of capital is 10 perce
> Mountain Mist Inc.’s cost of capital is 11 percent. In 2010, one of the firm’s divisions generated an EVA of $1,130,000. The fair market value of the capital investment in that division was $29,500,000. How much after-tax income was generated by the divi
> Dallas Office Systems has annual sales of $2,250,000 with variable expenses of 60 percent of sales and fixed expenses per month of $25,000. By how much must annual sales increase for Dallas Office Systems to have pre-tax income equal to 30 percent of sal
> Indicate whether a firm exhibiting each of the following characteristics would more likely be centralized (C) or decentralized (D). a. Large number of employees who telecommute b. Slow growth rate c. Few employees d. Subordinates highly trained and mento
> Casper Ceramics is considering the purchase of new production technology that would require an initial investment of $1,500,000 and have an expected life of 10 years. At the end of its life, the equipment would have no salvage value. By installing the ne
> In recent years, stock price averages (such as the Dow Jones Industrial Average) have shown sensitivity to changes in interest rates. Based on your understanding of the factors that determine stock prices and of how future cash flows are discounted, prep
> Kurt’s Office Services is evaluating the purchase of a state-of-the-art desktop publishing system that costs $40,000, has a 6-year life, and has no salvage value at the end of its life. The company’s controller estimates that the system will annually gen
> Use the tables in Appendix A to determine the answers to the following questions. Ignore taxes in all circumstances. a. Titus wishes to have $50,000 in 6 years. He can make an investment today that will earn 8 percent each year, compounded annually. What
> Management of Frisco Films is considering the following capital projects: Assume that all projects have no salvage value and that the firm uses a discount rate of 10 percent. Management has decided that only $25,000,000 can be spent in the current year
> Lastlock Security Systems is considering an investment in computer-based production technology as part of a business reengineering process. The necessary equipment, installation, and training will cost $18,000,000, have a life of 8 years, and generate an
> Maine Trucking provides truck freight services throughout the northeast United States. The firm is considering an investment in a mainframe computer and communications software, which would cost $1,000,000 and have an expected life of 8 years. For tax pu
> Natural Foods is considering the purchase of new food processing technology, which would cost $900,000 and would generate $150,000 in annual cost savings. No salvage is expected on the technology at the end of its 10-year life. The firm’s cost of capital
> Rockport Municipal Marina is considering adding a new dock to accommodate large yachts. The dock would cost $700,000 and would generate $144,000 annually in new cash inflows. Its expected life would be 8 years, and it would have no salvage value. The org
> Nashville Tours is considering adding a new bus route. To do so, the company would be required to purchase a new bus, which would cost $600,000, have a 10-year life, and have no salvage value. If the new bus is purchased, Nashville Tours’ managers expect
> Bill’s Cabinets sells a product for $360 per unit. The company’s variable cost per unit is $60 for direct material, $50 per unit for direct labor, and $34 per unit for overhead. Annual fixed production overhead is $74,800, and fixed selling and administr
> In discussing your cost accounting class with friends, you explained that you were currently studying methods of evaluating capital investments. You mentioned that most of these methods rely upon cash flow analysis. One particularly sophisticated friend
> The following 2010 information is available for Cornwall Industries: average assets invested, $7,200,000; revenues, $26,400,000; and expenses, $24,600,000. a. Calculate return on investment. b. Calculate profit margin. c. Calculate asset turnover. d. Usi
> For the most recent fiscal year, the Northern Division of Eastern Corporation generated an asset turnover ratio of 4 and a profit margin (as measured by the segment margin) ratio of 4 percent on sales of $4,000,000. a. Compute the average assets employed
> The company president has asked you, as the new controller, to comment on any deficiencies of the firm. After saying you believe that the firm needs long-run performance measurements, the president says that the long run is really just a series of short
> In recent years, salaries for chief financial officers (CFOs) of large U.S. corporations averaged only about 20 percent of the total CFO compensation package; the other 80 percent is performance-based, variable compensation that includes mostly stock opt
> Jeannie South is a division manager of Montana Manufacturing Inc. She is in the process of evaluating a $4,000,000 investment. The following net annual increases, before depreciation, in divisional income are expected during the investment’s five-year li

