Question: Using samples of 200 credit card statements,
Using samples of 200 credit card statements, an auditor found the following:
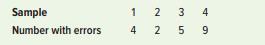
a. Determine the fraction defective in each sample.
b. If the true fraction defective for this process is unknown, what is your estimate of it?
c. What is your estimate of the mean and standard deviation of the sampling distribution of fractions defective for samples of this size?
d. What control limits would give an alpha risk of .03 for this process?
e. What alpha risk would control limits of .047 and .003 provide?
f. Using control limits of .047 and .003, is the process in control?
g. Suppose that the long-term fraction defective of the process is known to be 2 percent. What are the values of the mean and standard deviation of the sampling distribution?
h. Construct a control chart for the process, assuming a fraction defective of 2 percent, using two sigma control limits. Is the process in control?
Transcribed Image Text:
Sample 1 4 Number with errors 4 2 9, 3. 2.
> A producer of inkjet printers is planning to add a new line of printers, and you have been asked to balance the process, given the following task times and precedence relationships. Assume that cycle time is to be the minimum possible. a. Do each of th
> Given the following list of processes, the standard deviation for each, and specifications for a job that may be processed on that machine, determine which machines are capable of performing the given jobs. Process Standard Deviation (in.) Job Speci
> A manager wants to assign tasks to workstations as efficiently as possible and achieve an hourly output of four units. The department uses a working time of 56 minutes per hour. Assign the tasks shown in the accompanying precedence diagram (times are in
> Consider an assembly line such as the burrito assembly line at Chipotle Mexican Grill. During slow times of the day, one server can handle assembly, but during very busy times, having many servers would be prudent. Explain why either approach wouldn’t wo
> A manager wants to assign tasks to workstations as efficiently as possible and achieve an hourly output of 33 units. Assume the shop works a 60-minute hour. Assign the tasks shown in the accompanying precedence diagram (times are in minutes) to workstati
> An assembly line with 17 tasks is to be balanced. The longest task is 2.4 minutes, and the total time for all tasks is 18 minutes. The line will operate for 450 minutes per day. a. What are the minimum and maximum cycle times? b. What range of output is
> Burger Prince buys top-grade ground beef for $1.00 per pound. A large sign over the entrance guarantees that the meat is fresh daily. Any leftover meat is sold to the local high school cafeteria for 80 cents per pound. Four hamburgers can be prepared fro
> Rebalance the assembly line in Problem 7. This time, use the longest operation time heuristic. Break ties with the most following tasks heuristic. What is the percentage idle time for your line?
> Ten labs will be assigned to the circular layout shown. Recalling a similar layout’s congestion in the halls, the new lab manager has requested an assignment that will minimize traffic between offices. Department 1 must be at location A
> Develop a process layout that will minimize the total distance traveled by patients at a medical clinic, using the following information on projected departmental visits by patients and distance between locations. Assume a distance of 35 feet between the
> Eight work centers must be arranged in an L-shaped building. The locations of centers 1 and 3 are assigned as shown in the accompanying diagram. Assuming transportation costs are $1 per load per meter, develop a suitable layout that minimizes transportat
> Briefly explain how a company can achieve lower production costs and increase productivity by Improving the quality of its products or services.
> A process that produces computer chips has a mean of .04 defective chip and a standard deviation of .003 chip. The allowable variation is from .03 to .05 defective. a. Compute the capability index for the process. b. Is the process capable?
> a. Determine the placement of departments for a newly designed facility that will minimize total transportation costs using the data in the following tables. Assume that reverse distances are the same. The locations are shown in the grid. Use a cost of $
> An air-conditioning repair department manager has compiled data on the primary reason for 41 service calls for the previous week, as shown in the table. Using the data, make a check sheet for the problem types for each customer type, and then construct a
> Arrange the departments so they satisfy the conditions shown in the following rating grid into a 3 × 3 format. Place department 5 in the lower left corner of the 3 × 3 grid. Department 1 Department 2 Department
> Arrange the eight departments shown in the accompanying Muther grid into a 2 × 4 format. Note: Department 1 must be in the location shown. Department 1 E Department 2 A. E A Department 3 A UXE Department 4 A Department 5 くAX×) Departmen
> Using the information in the following grid, determine if the department locations shown are appropriate. If not, modify the assignments so that the conditions are satisfied. Department 1 254 186 Department 2 7|3 Department 3 Department 4 AXE A A De
> What are the risks of automating a production process? What are the risks for a service process?
> Demand for devil’s food whipped-cream layer cake at a local pastry shop can be approximated using a Poisson distribution with a mean of six per day. The manager estimates it costs $9 to prepare each cake. Fresh cakes sell for $12. Day-old cakes sell for
> Using the information given in the preceding problem, develop a Muther-type grid using the letters A, O, and X. Assume that any pair of combinations not mentioned have an O rating.
> SummerFun, Inc., produces a variety of recreation and leisure products. The production manager has developed an aggregate forecast: Develop an aggregate plan using each of the following guidelines and compute the total cost for each plan. Hint: You wil
> Manager Chris Channing of Fabric Mills, Inc., has developed the forecast shown in the table for bolts of cloth. The figures are in hundreds of bolts. The department has a regular output capacity of 275(00) bolts per month, except for the seventh month, w
> Does the second set of samples show anything that the first set did not? Explain what and why.
> Why is it usually desirable to use both a median run test and an up/down run test on the same data?
> Manager T. C. Downs of Plum Engines, a producer of lawn mowers and leaf blowers, must develop an aggregate plan given the forecast for engine demand shown in the table. The department has a regular output capacity of 130 engines per month. Regular output
> What trade-offs are involved in each of these aspects of inventory management? a. Buying additional amounts to take advantage of quantity discounts. b. Treating holding cost as a percentage of unit price instead of as a constant amount. c. Conducting cyc
> What is aggregate planning? What is its purpose?
> What three levels of planning involve operations managers? What kinds of decisions are made at the various levels?
> Explain the managerial significance of aggregate planning.
> What are the inputs to master scheduling? What are the outputs?
> Briefly describe the planning techniques listed as follows, and give an advantage and disadvantage for each: a. Spreadsheet b. Linear programming c. Simulation
> Briefly discuss the advantages and disadvantages of each of these planning strategies: a. Maintain a level rate of output and let inventories absorb fluctuations in demand. b. Vary the size of the workforce to correspond to predicted changes in demand re
> Presumably, information about the new line has been shared with supply chain partners. Explain what information should be shared with various partners, and why sharing that information is important.
> A teller at a drive-up window at a bank had the following service times (in minutes) for 20 randomly selected customers. a. Determine the mean of each sample. b. If the process parameters are unknown, estimate its mean and standard deviation. c. Estima
> Select four tools and describe how they could be used in problem solving.
> Analysis of the output of a process has suggested that the variability is nonrandom on several occasions recently. However, each time an investigation has not revealed any assignable causes. What are some of the possible explanations for not finding any
> Identify the fixed-path and variable-path material-handling equipment commonly found in supermarkets.
> The EGAD Bottling Company has decided to introduce a new line of premium bottled water that will include several “designer” flavors. Marketing manager Georgianna Mercer is predicting an upturn in demand based on the ne
> How has technology aided inventory management? How have technological improvements in products such as automobiles and computers impacted inventory decisions?
> Name several ways that technology has had an impact on quality control.
> What trade-offs are involved in each of these decisions? a. Deciding whether to use two-sigma or three-sigma control limits. b. Choosing between a large sample size and a smaller sample size. c. Trying to increase the capability of a process that is bare
> Specifications for a metal shaft are much wider than the machine used to make the shafts is capable of. Consequently, the decision has been made to allow the cutting tool to wear a certain amount before replacement. The tool wears at the rate of .004 cen
> After a number of complaints about its directory assistance, a telephone company examined samples of calls to determine the frequency of wrong numbers given to callers. Each sample consisted of 100 calls. Determine 95 percent limits. Is the process stabl
> Given the following data for the number of defects per spool of cable, using three-sigma limits, is the process in control? OBSERVATION 1 4 6. 7 8 10 11 12 13 14 1 0 1 2 0 2 1 3 1 2 0 Number of defects 3. 3. 3. 2.
> (Refer to the data in Example 5.) Two additional observations have been taken. The first resulted in three defects, and the second had four defects. Using the set of 20 observations, perform run tests on the data. What can you conclude about the data? D
> The postmaster of a small western town receives a certain number of complaints each day about mail delivery. Determine three-sigma control limits using the following data. Is the process in control? DAY 1 2 4. 5 6. 11 12 13 14 Number of complaints 4
> A medical facility does MRIs for sports injuries. Occasionally a test yields inconclusive results and must be repeated. Using the following sample data and n = 200, determine the upper and lower control limits for the fraction of retests using two-sigma
> Give two examples of unethical behavior for each of these areas: inspection, process control, process capability. For each, name the relevant ethical principle
> Explain the plan-do-study-act cycle.
> Computer upgrade times (in minutes) are being evaluated. Samples of five observations each have been taken, and the results are as listed. Using factors from Table 10.3, determine upper and lower control limits for mean and range charts, and decide if th
> Who needs to be involved in inventory decisions involving holding costs? Setting inventory levels? Quantity discount purchases?
> The City Transportation Planning Committee must decide whether to begin a long-term project tobuild a subway system or to upgrade the present bus service. Suppose you are an expert in fixed path and variable-path material-handling equipment, and the comm
> The time to replace vehicle wiper blades at a service center was monitored using a mean and a range chart. Six samples of n = 20 observations were obtained and the sample means and ranges computed: a. Using the factors in Table 10.3, determine upper an
> An automatic filling machine is used to fill 1-liter bottles of cola. The machine’s output is approximately normal with a mean of 1.0 liter and a standard deviation of .01 liter. Output is monitored using means of samples of 25 observations. a. Determine
> A production process consists of a three-step operation. The scrap rate is 10 percent for the first step and 6 percent for the other two steps. a. If the desired daily output is 450 units, how many units must be started to allow for loss due to scrap? b.
> Specifications for a part for a DVD player state that the part should weigh between 24 and 25 ounces. The process that produces the parts has a mean of 24.5 ounces and a standard deviation of .2 ounce. The distribution of output is normal. a. What percen
> Use the three-step process described in the previous section on Using Control Charts and Runs Tests Together to decide if the following observations represent a process that is in control. 1 2 3 4 5 6 7 8 9 10 11 12 1 0 3 2 0 1 3 2 1 0 2 Observation
> The following is a control chart for the average number of minor errors in 22 service reports. What can you conclude from these data? Explain how you reached your conclusion UCL LCL
> Many organizations use the same process capability standard for all their products or services (e.g., 1.33), but some companies use multiple standards: different standards for different products or services (e.g., 1.00, 1.20, 1.33, and 1.40). What reason
> The Good Chocolate Company makes a variety of chocolate candies, including a 12-ounce chocolate bar (340 grams) and a box of six 1-ounce chocolate bars (170 grams). a. Specifications for the 12-ounce bar are 330 grams to 350 grams. What is the largest s
> As part of an insurance company’s training program, participants learn how to conduct an analysis of clients’ insurability. The goal is to have participants achieve a time in the range of 30 to 45 minutes. Test results for three participants were: Armand
> An appliance manufacturer wants to contract with a repair shop to handle authorized repairs in Indianapolis. The company has set an acceptable range of repair time of 50 minutes to 90 minutes. Two firms have submitted bids for the work. In test trials, o
> Briefly define or explain each of these tools: a. Brainstorming b. Benchmarking c. Run charts
> Garden Variety Flower Shop uses 750 clay pots a month. The pots are purchased at $2 each. Annual carrying costs per pot are estimated to be 30 percent of cost, and ordering costs are $20 per order. The manager has been using an order size of 1,500 flower
> Each of the processes listed is non centered with respect to the specifications for that process. Compute the appropriate capability index for each, and decide if the process is capable Process Мean Standard Deviation Lower Spec Upper Spec 15.0 0.32
> (Refer to Solved Problem 2.) Suppose the process specs are 9.65 and 10.35 minutes. Based on the data given, does it appear that the specs are being met? If not, what should one look for?
> A company has just negotiated a contract to produce a part for another firm. In the process of manufacturing the part, the inside diameter of successive parts becomes smaller and smaller as the cutting tool wears. However, the specs are so wide relative
> Arrange six departments into a 2 × 3 grid so that these conditions are satisfied: 1 close to 2, 5 close to 2 and 6, 2 close to 5, and 3 not close to 1 or 2.
> Briefly describe each of the seven quality tools.
> Use both types of run tests to analyze the daily expense voucher listed. Assume a median of $31. Day Amount Day Amount Day Amount Day Amount 1 $27.69 16 $29.65 31 $40.54 46 $25.16 2 28.13 17 31.08 32 36.31 47 26.11 3 33.02 18 33.03 33 27.14 48 29.84
> Analyze the data in the following problems using median and up/down run tests with z = ± 2. a. Given the following run test results of process output, what do the results of the run tests suggest about the process? Test z–……………..score Median ……………….+ 1
> For each of the accompanying control charts, analyze the data using both median and up/down run tests with z = ± 1.96 limits. Are nonrandom variations present? Assume the center line is the long term median. UCL A. LCL UCL B. LCL
> What is the goal of line balancing? What happens if a line is unbalanced?
> Compare equipment maintenance strategies in product and process layouts.
> The time needed for checking in at a hotel is to be investigated. Historically, the process has had a standard deviation equal to .146. The means of 39 samples of n = 14 are a. Construct an x¯ -chart for this process with three-sigma limits
> The lower and upper specifications for the computer upgrades in Problem 4 are 78 minutes and 81 minutes. Based on the data in the problem, would you say that the specifications are being met? Estimate the percentage of process output that can be expected
> What characteristics of potato chips concern Jays in terms of quality?
> Do you feel that Jays is overdoing it with its concern for quality?Explain.
> What is a run? How are run charts useful in process control?
> Make a check sheet and then a Pareto diagram for the following car repair shop data. Ticket No. Work Ticket No. Work Ticket No. Work 1 Tires 11 Brakes 21 Lube & oil 2 Lube & oil 12 Lube & oil 22 Brakes 3 Tires 13 Battery 23 Transmission Battery 14 L
> Briefly explain the purpose of each of these control charts: a. x-bar b. Range c. p-chart d. c-chart
> What are the key elements of the TQM approach? What is the driving force behind TQM?
> What are the key concepts that underlie the construction and interpretation of control charts?
> How did Jim conclude that the process was not capable based on his first set of samples?
> List the steps in the control process.
> Classify each of the following as either a Type I error or a Type II error: a. Putting an innocent person in jail b. Releasing a guilty person from jail c. Eating (or not eating) a cookie that fell on the floor d. Not seeing a doctor as soon as possible
> A computer repair shop had received a number of complaints on the length of time it took to make repairs. The manager responded by increasing the repair staff by 10 percent. Complaints on repair time quickly decreased, but then complaints on the cost of
> How important is it for managers to maintain and promote ethical behavior in dealing with quality issues? Does your answer depend on the product or service involved?
> Give three examples of what would be considered unethical behavior involving management of quality, and state which ethical principle (see Chapter 1) is violated.
> What quality-related trade-offs might there be between having a single large, centralized produce processing facility and having many small, decentralized produce-processing facilities?
> More and more people are using the Internet. And when these people want information about a company’s products or services, they often go to the company’s website. In a study of the home pages of Fortune 500 companies, 13 factors were deemed critical to
> What trade-offs are involved in deciding to have a single large, centrally located facility instead of several smaller, dispersed facilities?
> Who needs to be involved in facility location decisions?
> List some common reasons for redesigning layouts.
> In what ways have tech tools improved the process of site selection?
> Rework Problem 4b using this additional information: Expansion would result in an increase of $70,000 per year in transportation costs, subcontracting would result in an increase of $25,000 per year, and adding a new location would result in an increase
> Who needs to be involved in setting priorities for quality improvement?
> a. The following table contains figures on the monthly volume and unit costs for a random sample of 16 items from a list of 2,000 inventory items at a health care facility. Develop an A-B-C classification for these items. b. Given the monthly usages in
> Why are routing and scheduling continual problems in process layouts?

