Question: We have written the IS-LM model
We have written the IS-LM model in the following terms:
Interpret the real policy rate as the federal funds rate adjusted for expected inflation. Assume that the rate at which firms can borrow is much higher than the federal funds rate, equivalently that the premium, x, in the IS equation is high.
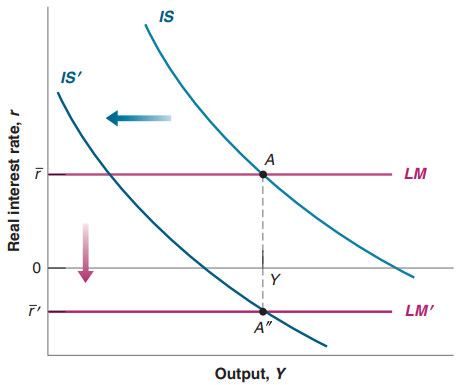
a. Suppose that the government takes action to improve the solvency of the financial system. If the government’s action is successful and banks become more willing to lend—both to one another and to nonfinancial firms—what is likely to happen to the premium? What will happen to the IS-LM diagram based on Figure 6-6? Can we consider financial policy as a kind of macroeconomic policy?
b. Faced with a zero nominal interest rate, suppose the Fed decides to purchase securities directly to facilitate the flow of credit in the financial markets. This policy is called quantitative easing. If quantitative easing is successful, so that it becomes easier for financial and nonfinancial firms to obtain credit, what is likely to happen to the premium? What effect will this have on the IS-LM diagram? If quantitative easing has some effect, is it true that the Fed has no policy options to stimulate the economy when the federal funds rate is zero?
c. We will see later in the course that one argument for quantitative easing is that it increases expected inflation. Suppose it does. How does that affect the LM curve in Figure 6-6?
Figure 6-6:
> a. Explain why, in equation (14.14), it is important that the stock is ex-dividend, that is, it has just paid its dividend and is expected to pay its next dividend in one year. b. Using of equation (14.14), explain the contribution of each component to t
> Suppose that in your country, the saving rate slowly declines from 12% in year t to 11% in year t+1 and 10% in year t+2. Suppose, moreover, that the depreciation rate, a. Using the production function given in the chapter, what happens to the steady-stat
> The Cobb-Douglas production function and the steady state. This problem is based on the material in the chapter appendix. Suppose that the economy’s production function is given by Y = KαN1 - α and assume that a = 1>3 a. Is this production function char
> The appendix to this chapter shows how data on output, capital, and labor can be used to construct estimates of the rate of growth of technological progress. We modify that approach in this problem to examine the growth of capital per worker. Y = K1/3 (A
> Consider the economy described in Problem 3 and assume that there is a fixed exchange rate, Suppose that financial investors worry that the level of debt is too high and that the government may devalue to stimulate output (and therefore tax revenues) to
> Assume that money demand takes the form where Y = 1,000 and r = 0.1. a. Assume that, in the short run, pe is constant and equal to 25%. Calculate the amount of seignorage for each annual rate of money growth, ∆M/M, listed. a. 25% , b.
> Consider a country with two political parties, Party A and Party B. Party A cares more about unemployment than Party B, In 2018 New Zealand rewrote the charter of its central bank to include high employment as well as low inflation as its goals. Why woul
> a. The World Bank reports gross domestic saving rate by country and year. Go to the World Bank website (https://data. worldbank.org/indicator/NY.GNS.ICTR.ZS) and find the most recent saving rates for Indonesia, India, South Korea (the Republic of Korea),
> Go to the World Bank’s website (http://data.worldbank.org/ indicator/NY.GDP.PCAP.KD), find the data on GDP per capita (in constant 2010 US$) for China and the euro area for the years 1960, 1980, 2000, and the latest year available. The euro area includes
> Between 1950 and 1973, France, Germany, and Japan all experienced growth rates that were at least two percentage points higher than those in the United States. Yet the most important technological advances of that period were made in the United States. H
> Consider the production function given in Problem 3. Assume that N is constant and equal to 1. Note that if z = xa , then gz ≈ a gx, where gz and gx are the growth rates of z and x (See Appendix 2 at the end of the book). a. Given the growth approximatio
> Consider the production function: Y = K + 2N a. Compute output when K = 10 and N = 20. b. If both capital and labor triple, what happens to output? c. How would you qualify the returns to scale for this production function? d. Write this production funct
> Assume that every month the average student in Japan and the average student in China buy the quantities and pay the prices indicated in the following table: a. Compute the Japanese consumption per student in yen. b. Compute the Chinese consumption per
> Using the information in this chapter, label each of the following statements true, false, or uncertain. Explain briefly. a. On a logarithmic scale, a variable that increases at 5% per year will move along an upward-sloping line with a slope of 0.05. b.
> Consider the data in the Focus Box, “Deflation in the Great Depression.” a. Calculate real interest rates in each year making the assumption that the expected level of inflation is last year’s rate of inflation. The rate of inflation in 1928 was -1.7%. D
> Consider the data in the Focus Box, “Deflation in the Great Depression.” a. Do you believe that output had returned to its potential level in 1933? b. Which years suggest a deflation spiral as described in Figure 9-3?
> Suppose the economy is operating at the zero lower bound for the nominal policy rate; the initial equilibrium is at the positive target rate of inflation and the economy is resting at potential output but there is a large government deficit in period t.
> Okun’s Law is written as u - u(-1) = -0.4 (gY - 3%) a. What is the sign of u – u (-1) in a recession? What is the sign of u – u (-1) in a recovery? b. Explain where the 3% number comes from? c. Explain why the coefficient on the term (gY - 3%) is -0.4 an
> Suppose you are measuring annual GDP of a country by adding up the final value of all goods and services produced in the economy. Determine the effect on the country’s GDP for each of the following transactions. a. A seafood restaurant buys €100 worth of
> A shock to aggregate supply will also have different outcomes when there are different assumptions about the formation of the level of expected inflation. As in Question 4, one assumption is that the level of expected inflation equals lagged inflation. T
> This chapter assumes that expected inflation remains equal to the central bank’s target rate of inflation. In Chapter 8, in the discussion of the Phillips curve, it was noted that expected inflation was, for some time, equal to lagged inflation and was n
> The medium-run equilibrium is characterized by four conditions: Output is equal to potential output Y = Yn and the real policy rate rn must be chosen by the central bank so: The unemployment rate is equal to the natural rate u = un. The real policy inter
> Identifying if an economy is in medium run equilibrium and the necessary central bank action to return the economy to medium run equilibrium Here are values for a hypothetical economy Yn = 1000; un = 5%; rn = 2%; x = 1%; πe = 2% and
> President’s Trump’s complaints about Federal Reserve policy in 2018 made the news. On December 22, 2017 President Trump signed a bill, the Tax Cuts and Jobs Act that substantially reduced federal taxes in 2018. a. On November 20, 2018, Bloomberg reported
> Answer the following questions based on information found in the table below a. Is there evidence that the depression originating in the US diffused to every European country? Explain. b. Compare the relationship between production, price, and unemployme
> Using the information in this chapter, label each of the following statements true, false, or uncertain. Explain briefly. a. The IS curve shifts to the right with an increase in G, to the right with an increase in T, and to the right with an increase in
> Using the rate of unemployment to predict inflation between 1996 and 2018 The estimated Phillips curve from Figure 8.5 is πt = 2.8% − 0.16 ut Fill in the table below using the Phillips curve above after collecting the data fr
> Consider each table below. Is the data presented consistent with the Phillips curve model of wage determination? Each table has a point A and a point B. Start your answer with true/false/uncertain. a. The natural rate of unemployment is 5%. b. The natu
> a. The equation of the Phillips curve from 1970 to 1995 is πt - πt - 1 = 7.4% - 1.2ut. Calculate and define the natural rate of unemployment using this curve. b. The equation of the Phillips curve from 1996 to 2018 is πt = 2.8% - 0.16ut Here the natural
> Using the information in this chapter, label each of the following statements true, false, or uncertain. Explain briefly. a. US GDP was 38 times higher in 2018 than it was in 1960. b. When the unemployment rate is high, the participation rate is also li
> Suppose that the Phillips curve is given by Suppose that inflation in year t + 1 is zero. In year t, the central bank decides to keep the unemployment rate at 4% forever. a. Compute the rate of inflation for years t, t + 1, t + 2 and t + 3. Now suppose
> Suppose that the Phillips curve is given by and expected inflation is given by and suppose that θ is initially equal to 0, and that π is given and does not change. It could be zero or any positive value. Suppose that the rate o
> The text proposes the following model of expected Inflation a. Describe the process of the formation of expected inflation when θ = 0 b. Describe the process of the formation of expected inflation when θ = 0 c. How do you form
> a. The Phillips curve is Rewrite this relation as a relation between the deviation of the unemployment rate from the natural rate, inflation, and expected inflation. b. In the previous chapter, we derived the natural rate of unemployment. What condition
> Discuss the following statements. a. The Phillips curve implies that when an economy is operating below full capacity, a significant increase in aggregate demand is likely to cause a reduction in unemployment and an increase in inflation. b. Monetary pol
> Fill in the values in the table below for inflation and expected inflation using the 1960s. The data will come from FRED as they did in the last question. You will have the most success using a spreadsheet. From the 1960s: From the 1970s and 1980s: Fro
> Using the information in this chapter, label each of the following statements true, false, or uncertain. Explain briefly. a. The original Phillips curve is the negative relation between unemployment and inflation that was first observed in the United Kin
> Go to the website maintained by the International Labour Organization (ILO). Select a labor overview report that provides the international definition of unemployment a. Does this definition differ from the one used by policy makers in your country? Expl
> According to the data presented in this chapter, about 44% of unemployed workers leave unemployment each month. a. Assume that the probability of leaving unemployment is the same for all unemployed persons, independent of how long they have been unemploy
> You learned in Chapter 2 that informal work at home (e.g., preparing meals and taking care of children) is not counted as part of GDP. This constitutes the informal, shadow, or grey labor market. According to World Bank reports, the size of informal labo
> Eurostat is the statistical agency of the European Commission that provides data to the institutions of the 27 member countries (The number of member states changed following the Brexit results) of the European Union (EU) and harmonizes statistical metho
> a. Why does the wage-setting relation in Figure 1 have an upward slope? As N approaches L, what happens to the unemployment rate? b. The price-setting relation is horizontal. How would an increase in the mark-up affect the position of the price-setting r
> Even in the absence of collective bargaining, workers do have some bargaining power that allows them to receive wages higher than their reservation wage. Each worker’s bargaining power depends both on the nature of the job and on the economywide labor ma
> In the mid-1980s, a famous supermodel once said that she would not get out of bed for less than $10,000 (presumably per day). a. What is your own reservation wage? b. Did your first job pay more than your reservation wage at the time? c. Relative to your
> Suppose that the markup of goods prices over marginal cost is 5%, and that the wage-setting equation is W = P(1 - u) , where u is the unemployment rate. a. What is the real wage, as determined by the price-setting equation? b. What is the natural rate of
> Answer the following questions using the information provided in this chapter. a. As a percentage of employed workers, what is the size of the flows into and out of employment (i.e., hires and separations) each month? b. As a percentage of unemployed wor
> A closer look at changes in state labor markets There is a lot of discussion of the decline of the “Rust Belt” and the differences between labor markets at the state level. The table below is a snapshot of the labor ma
> Go to IMF data mapper (http://www.imf.org/external/ data mapper/datasets). Select the following countries—France, Germany, the UK, Spain, Japan, and the US. Build a table to compare each country’s GDP annual growth and
> 1.Using the information in this chapter, label each of the following statements true, false, or uncertain. Explain briefly. a. Since 1950, the participation rate in the United States has remained roughly constant at 60%. b. Each month, the flows into and
> Calculating the risk premium on bonds (1 + i) = (1 – p) (1 + i + x) + p (0) p is the probability that the bond does not pay at all (the bond issuer is bankrupt) and has a zero return. i is the nominal policy interest rate. x is the risk premium. a. If t
> Suppose that instead of cooking dinner for an hour, you decide to work an extra hour, earning an additional $12. You then purchase some (takeout) Chinese food, which costs you $10. a. By how much does measure GDP increase? b. Do you think the increase in
> Consider a bank that has assets of 100, capital of 20, and short-term credit of 80. Among the bank’s assets are securitized assets whose value depends on the price of houses. These assets have a value of 50. a. Set up the bank’s balance sheet. Suppose th
> Around the world Since the Great Financial Crisis and the difficulty to recover growth, a negative interest policy has been implemented by some central banks. Some may or may not be in place as you read this book. As of January 2018, the following centra
> The IS-LM view of the world with more complex financial markets Consider an economy described by Figure 6-6 in the text. a. What are the units on the vertical axis of Figure 6-6? b. If the nominal policy interest rate is 5% and the expected rate of infla
> Consider a simple bank that has assets of 100, capital of 20, and checking deposits of 80. Recall from Chapter 4 that checking deposits are liabilities of a bank. a. Set up the bank’s balance sheet. b. Now suppose that the perceived value of the bank’s a
> Fill in the table below and answer the questions that relate to the data in the table. a. Which situations correspond to a liquidity trap as defined in Chapter 4? b. Which situations correspond to the case where the nominal policy interest rate is at th
> Assume that the interest rate, i, for France and Switzerland is 1.7%, and the expected rate of inflation, πe, in France is 0.8% and for Switzerland it is 0.5%. a. Compute the real interest rates for both countries using the exact formula. b. Compute the
> In the face of a slowdown in economic growth and an increase in current account deficit and inflation, the Indian government decided to implement inflation indexed bonds (IIB) in 2013. When presenting this measure, the Ministry of Finance stated that &ac
> Immediately after the British voted for Brexit, two major credits rating agencies, S&P Global (Standard & Poor’s) and Fitch, downgraded the United Kingdom’s sovereign credit rating by two notches, from AAA to A
> Using the information in this chapter, label each of the following statements true, false, or uncertain. Explain briefly. a. The nominal interest rate is measured in terms of goods; the real interest rate is measured in terms of money. b. As long as expe
> A chapter problem at the end of Chapter 3 considered the effect of a drop in consumer confidence on private saving and investment, when investment depended on output but not on the interest rate. Here, we consider the same experiment in the context of th
> As the first Focus box in this chapter explains, it is difficult to measure the true increase in prices of goods whose characteristics change over time. For such goods, part of any price increase can be attributed to an increase in quality. Hedonic prici
> What mix of monetary and fiscal policy is needed to meet the following objectives? a. Increase Y while keeping i constant. Would investment (I) change? b. Decrease a fiscal deficit while keeping Y constant. Why must i also change?
> In the aftermath of the Great Financial Crisis the Great Financial Crisis left many nations with slow GDP growth rates and high levels of public debt. While most nations pursued a monetary policy, some nations simply lowered income taxes through expansio
> The chapter argues that investment depends negatively on the interest rate because an increase in the cost of borrowing discourages investment. However, firms often finance their investment projects using their own funds. If a firm is considering using i
> Consider the following numerical example of the IS-LM model: C = 100 + 0.3YD I = 150 + 0.2Y - 1000i G = 200 T = 100 i = 0.03 a. Derive the IS relation. b. The central bank sets an interest rate of 3%. How is that decision represented in the equations? c
> Consider the money market to better understand the horizontal LM curve in this chapter. The LM relation (equation 5.3) is M/P = Y L(i). a. What is on the left-hand side of equation (5.3)? b. What is on the right-hand side of equation (5.3)? c. Go back to
> The response of the economy to fiscal policy a. Use an IS-LM diagram to show the effects on output of a decrease in government spending. Can you tell what happens to investment? Why? Now consider the following IS-LM model: C = c0 + c1(Y - T) I = b0 + b1
> Consider first the goods market model with constant investment that we saw in Chapter 3. Consumption is given by C= C0 + C1(Y - T) and I, G, and T are given. a. Solve for equilibrium output. What is the value of the multiplier for a change in autonomous
> To answer this question, examine the changes in the components of GDP over this period and the movements of investment and consumption in China during the last two or three decades and its relative slowdown since the Great Financial Crisis. Along with ot
> As described in this chapter, during the Clinton administration the policy mix changed toward more contractionary fiscal policy and more expansionary monetary policy. This question explores the implications of this policy mix, in both theory and fact. a.
> Read Focus Box “Deficit Reduction: Good or Bad for Investment?” In each case below, there is a fiscal consolidation. Remember that equilibrium condition in good markets can also be written I = S + 1T - G2 a. How does
> a. Okun’s law states that when output growth is higher than usual, the unemployment rate tends to fall. Explain why usual output growth is positive. b. In which year—a year in which output growth is 2% or a year in which it is –2%—will the unemployment r
> Using the information in this chapter, label each of the following statements true, false, or uncertain. Explain briefly. a. The main determinants of investment are the level of sales and the interest rate. b. If all the exogenous variables in the IS rel
> The diagram below shows three different money demand curves and a target interest rate i*
> I described a monetary system that included simple banks in Section 4-3. Assume the following: i. The public holds no currency. ii. The ratio of reserves to deposits is 0.1. iii. The demand for money is given by Md = $Y (0.8 - 4i) Initially, the supply
> This problem examines the effect of the introduction of ATMs and credit cards on money demand. For simplicity, let’s examine a person’s demand for money over a period of four days. Suppose that before ATMs and credit cards, this person goes to the bank o
> In this chapter, you have learned that the interest rate affects both the prices of bonds and the demand for money. a. What is the relationship between interest rates and bond prices? b. Does the relationship hold when interest rates are negative? Why do
> Suppose that a person’s wealth is $50,000 and that her yearly income is $60,000. Also suppose that her money demand function is given by Md = $Y (0.35 – i) a. Derive the demand for bonds. Suppose the interest rate increases by 10 percentage points. What
> Suppose the money demand of an economy is given by Md = €Y (0.25 - i) where €Y is €40,000. Also, suppose that the supply of money is €8,000. a. What is the equilibrium interest rate? b. Suppose the central bank increases the value of equilibrium interest
> Consider a bond that promises to pay $100 in one year. a. What is the interest rate on the bond if its price today is $75? $85? $95? b. What is the relation between the price of the bond and the interest rate? c. If the interest rate is 8%, what is the p
> Suppose that the household nominal income for a country is €50,000 billion. The money demand function is given by Md = €Y(0.2 - 0.8i) a. What is the demand for money when the interest rate is 1%? 5%? b. What is the relationship between money demand and
> The central bank of the Federal Republic of Germany is the Deutsche Bundesbank, also known as BUBA. It is the most influential member of the European Central Bank and the European System of Central Banks. Go to the Web site for BUBA (www.bundesbank.de) a
> The FRED database contains updates of the unemployment rate in Spain (Figure 1-6) as well as unemployment rates for the European Union as a whole and for individual countries for the seasonally adjusted unemployment rate. Retrieve the monthly data series
> Suppose that money demand is given by Md = $Y (0.25 – i) as long as interest rates are positive. The questions below then refer to situations where the interest rate is zero. a. What is the demand for money when interest rates are zero and $Y = 80? b. I
> Suppose the money demand is given by Md= €Y (0.08 - 0.4i) where €Y is €5,000 billion. a. If the money demand is €100 billion, what is the interest rate? b. If a central bank wants to increase money supply to €300 billion, what is the interest rate it sh
> Using the information in this chapter, label each of the following statements true, false, or uncertain. a. Income is a flow variable while financial wealth is a stock variable. b. The term investment, as used by economists, refers to the purchase of bon
> You should be able to complete this question without doing any algebra, although you may find making a diagram helpful for part a. For this problem, you do not need to calculate the magnitudes of changes in economic variables only the direction of change
> This problem examines the implications of allowing investment to depend on output. Chapter 5 carries this analysis much further and introduces an essential relation—the effect of the interest rate on investment—not exa
> Recall that we define taxes, T, as net of transfers. In other words, T = Taxes - Transfer Payments a. Suppose that the government increases transfer payments to private households, but these transfer payments are not financed by tax increases. Instead,
> For each of the economic changes listed in parts a and b, assess the likely impact on the growth rate and the level of output over the next five years and over the next five decades. a. A permanent reduction in the rate of technological progress. b. A pe
> a. Where does technological progress come from for the economic leaders of the world? b. Do developing countries have other alternatives to the sources of technological progress you mentioned in part (a)? c. Examples of developing countries shows that st
> a. Why is the amount of R&D spending important for growth? How do the appropriability and fertility of research affect the amount of R&D spending? How do each of the policy proposals listed in (b) through (e) affect the appropriability and fertility of r
> Using the information in this chapter, label each of the following statements true, false, or uncertain. Explain briefly. a. Writing the production function in terms of capital and effective labor implies that as the level of technology increases by 10%
> It is possible to extend the production function so that output is produced with labor input, N; capital input, K; and carbon-intensive energy input, E. If we write a production function as Y = N (1/3) K (1/3) E (1/3) a. Using the input values below, doe
> How might the policy changes in parts a through e affect the wage gap between low-skill and high-skill workers in the United States? a. Increased spending on computers in public schools. b. Restrictions on the number of foreign temporary agricultural wor
> Using the information in this chapter, label each of the following statements true, false, or uncertain. Explain briefly. a. It is clear that the rate of technological growth has declined in the last decade. b. The change in employment and output per per
> There is a great deal of interest in carbon emissions because of global warming. The World Bank produces data on carbon emissions by country in a variety of forms. It is found at https://data.worldbank.org/indicator/en.atm.co2e. pp.gd. One very interesti
> It is often argued that a balanced budget amendment would actually be destabilizing. To understand this argument, consider the economy in Problem 5. a. Solve for equilibrium output. b. Solve for taxes in equilibrium. Suppose that the government starts wi
> a. What evidence is presented in the text that income inequality has increased over time in the United States? b. Use supply and demand of educated workers to explain the increase in income inequality. c. Use supply and demand of less-educated workers to

