Question: Your friend Brad Brooks wants your guidance
Your friend Brad Brooks wants your guidance on his latest retirement plans. Although he is only 30 years old, he says he is now determined to consistently save a portion of his paycheck so that he can retire early. Be sure to access the Excel spreadsheets for all Brad Brooks cases at www.pearson.com/mylab/finance.
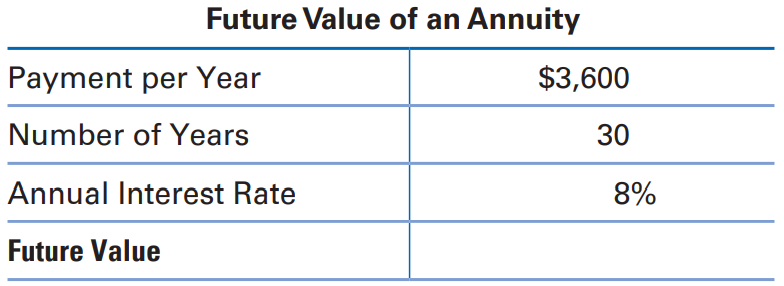
1. Regarding Brad’s revised retirement plans:
a. How much will he have in thirty years if he invests $3,600 per year at 8%?
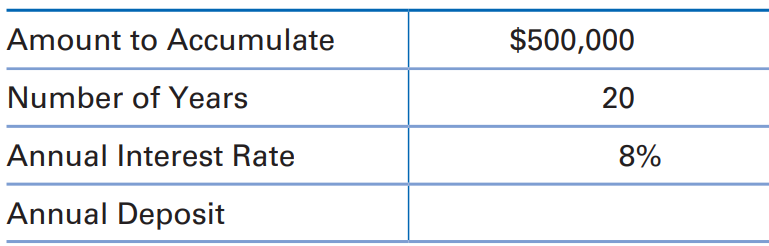
b. Brad believes that if he accumulates $500,000 in his retirement account in twenty years, that should easily be sufficient to retire. How much will he have to save per year at 8% to accumulate $500,000 in twenty years?
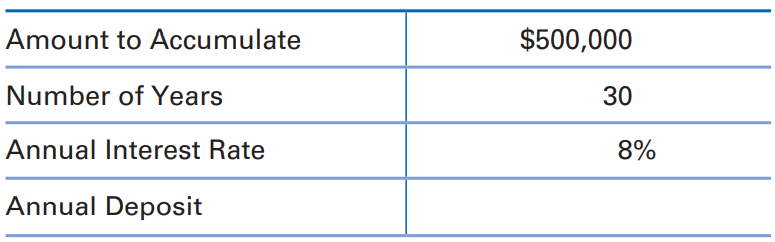
c. Brad also considers that he might not be able to save enough per year to meet his $500,000 savings goal in twenty years. So he also wants to consider how much he must save per year at 8% to accumulate $500,000 in thirty years.
How much will he have to save per year at 8% to accumulate $500,000 in thirty years?
d. Brad presumes that his retirement savings will earn a return of 8% per year over a long period of time. Do you think this presumed return is realistic? If the presumed return is higher than the return that actually occurs, how would that affect the actual value of the retirement account at the time Brad hopes to retire?
e. Brad is hoping to retire in twenty years so that he can travel the world and enjoy life (with entertainment, etc.) even more than he does now, which means that he would likely spend as much money during retirement as he does now (assume that he now spends about $50,000 per year). Do you think Brad can afford to retire in twenty years if he does accumulate $500,000 by that time?
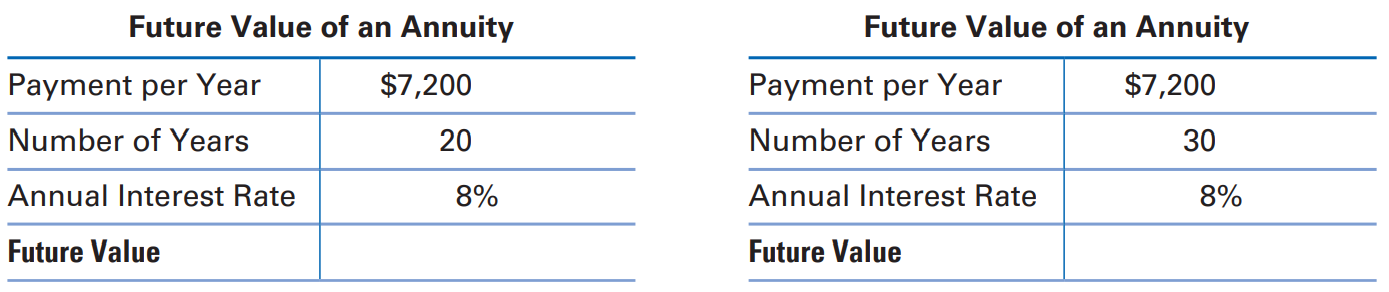
f. Assume that Brad’s employer is willing to match Brad’s retirement contribution up to $300 per month ($3,600 per year) so that the total contribution to Brad’s retirement account would be $7,200 per year. How would this affect his total savings in his retirement account in twenty years and in thirty years if he could earn a return of 8%?
> Risk Avoidance. What does it mean to avoid risk? How can you apply this knowledge to your personal situation?
> Personal Property Floater. What is a personal property floater? What are some common items homeowners add floaters to cover?
> Cash Value Insurance. What is a “cash value” homeowner’s policy? What is a “replacement cost” homeowner’s policy?
> Uninsured Motorist Coverage. What is uninsured motorist coverage? Why is this coverage necessary?
> Future Value and Motivation. Monica intends to invest $400 a month in her company’s retirement plan. The company will match the entire amount. How much will Monica have in her retirement account after forty years if she earns an annual return of 8%?
> No-Fault Auto Insurance. What is a no-fault auto insurance program? How do no-fault insurance affect personal injury litigation?
> Real Estate Agents. What services do real estate agents and brokers provide?
> Economic Conditions and Job Stability. How do economic conditions and the stability of your job affect the home buying decision?
> Mortgage Preapproval. What does it mean to be preapproved for a mortgage? Why is it beneficial to get preapproved for a mortgage?
> Mortgage Default. What does it mean to default on a mortgage? How do changing home values affect mortgage defaults?
> Economic Conditions. How do strong economic conditions affect home values? Explain how a weak economy affects the values of homes.
> Debt Consolidation. Explain debt consolidation loans. When is it advisable to use a debt consolidation loan?
> Subsidized Versus Unsubsidized Student Loans. What is the difference between subsidized and unsubsidized student loans?
> Avoiding Scams. List some things that should raise red flags with regard to online lending.
> No-Debt Solution. What is the no-debt solution in reference to buying a car? What is the limited-debt solution?
> Present Value. Cheryl wants to have $2,000 in spending money to take on a trip to Disney World in three years. How much must she deposit now in a savings account that pays 3% per year to have the money she needs in three years?
> Selecting a Car. List the factors you need to consider when selecting a car to buy. Discuss each briefly.
> Credit Repair Services. Explain why it is not advisable to use credit repair services
> Interest on Credit Cards. Compare the amount of interest you earn on typical money market investments versus the amount of interest paid on credit cards.
> Balance Transfer Cards. How can a balance transfer card help you save money?
> Rewards Cards. List some examples of common rewards offered to cardholders.
> Credit CARD Act. What are the three major impacts of the Credit CARD Act?
> Impact of Credit Report. Explain how a weak credit report can affect you.
> Credit Counseling. Explain the advantages and disadvantages of using a credit counseling organization.
> Checking Credit Scores. Why should you be careful about checking your credit score on one of the numerous “free” sites?
> Liquidity Risk. How does liquidity risk affect money management?
> Using Time Value to Estimate Savings. DeMarcus wants to retire with $1 million in savings by the time he turns 60. He is currently 18 years old. How much will he need to save each year, assuming he can get a 10% annual return on his investments?
> Economic Impact on Asset Values. Explain in logical terms why values of assets such as homes and stocks may decline during a weak economy. How does this change affect your net worth?
> Charitable Gifts. How are charitable gifts treated for tax purposes?
> Credit Rights. Under what conditions does the Equal Credit Opportunity Act prohibit creditors from denying credit? If you are denied credit, do you have the right to know the reason for the denial?
> Risk Premium on a Deposit. A local bank offers a deposit that earns 4% annual interest. The deposit is backed by the government if the bank fails. What is the risk premium of this depost?
> Time Value and Savings. How can an understanding of the time value of money motivate you to save more money?
> What are some possible disadvantages of using online sources of personal finance information?
> Cash Versus Credit. Why should some people use cash to make purchases instead of credit?
> Common Types of Credit. What are some common types of credit?
> Correcting Mistakes on Your Credit Report. Explain how to correct a mistake you discovered on your credit report.
> Credit Cards and Liquidity. What is the risk of using credit cards as a source of liquidity?
> Future Value of Annuity. Kirk can take his $1,000 income tax refund and invest it in a 36-month certificate of deposit at 3%, compounded monthly, or he can use the money to purchase a home entertainment system and put $30 a month in a bank savings accoun
> Calculating a Risk Premium. What is a risk premium? How is the risk premium calculated?
> Reconciling Your Account Balance. What does it mean to “reconcile your account balance?” Why is it important for you to regularly perform this task?
> Standard Deduction. What is a standard deduction? How much is the standard deduction for taxpayers filing single? For married taxpayers filing jointly?
> Mortgage Interest. How is mortgage interest treated for tax purposes? How does it differ from auto loan interest?
> Future Value of Debt. How does deferring student loan payments affect the future value of your debt?
> Medicare. What is Medicare? How much do you pay in Medicare taxes?
> Peer Pressure and Cash Outflows. How can peer pressure affect your cash outflows?
> Career Choice and Cash Flows. How does your choice of career affect your cash flows?
> Age and Cash Flows. How are cash flows related to your life stage or age?
> Student Loan Debt and Cash Flows. How does student loan debt affect your cash flows while in college? How does student loan debt affect your cash flows after college?
> Future Value of Annuity. Jen spends $20 per week on doughnuts and coffee. If she takes the same amount that she spends on doughnuts and coffee and invests it each week for the next five years at 4%, compounded weekly, how much will she have in five years
> Use the Descriptive Statistics tool to summarize the responses in the Excel file Job Satisfaction. What information can you conclude from this analysis?
> Apply the Descriptive Statistics tool for subsets of liberal arts colleges and research universities in the Excel file Colleges and Universities. Compare the two types of colleges. What can you conclude?
> Find 30 days of stock prices for three companies in different industries. The average stock prices should have a wide range of values. Using the data, compute and interpret the coefficient of variation.
> Compute the coefficient of variation for each variable in the Excel file Course Marks. Which has the least and greatest relative dispersion?
> Compute the mean and standard deviation of the data in the Cost of Living Adjustments Excel file. Then compute the z-scores for the comparative salaries and housing adjustments and interpret your results.
> The Excel file Atlanta Airline Data provides arrival and taxi-in time statistics for one day at Atlanta Hartsfield International Airport. Find the mean and standard deviation of the difference between the scheduled and actual arrival times and the taxi-i
> Use the Excel file Land to find the mean, standard deviation, and interquartile range of the land size. Show that Chebyshev’s theorem holds for the data and determine how accurate the empirical rules are.
> Use the Descriptive Statistics tool to summarize the mean, median, variance, and standard deviation of the prices of shares in the Coffee Shares Excel file.
> In the Excel file Facebook Survey, find the range, variance, standard deviation, and interquartile range for hours online/week and number of friends in the sample using the appropriate Excel functions. Compare these measures of dispersion.
> Use the Excel file Course Marks to calculate the mean, variance and standard deviation for each variable using formulas (4.5), (4.8), and (4.10). Verify your calculations using the appropriate Excel function.
> In one of PLE’s manufacturing facilities, a drill press that has three drill bits is used to fabricate metal parts. Drill bits break occasionally and need to be replaced. The present policy is to replace a drill bit when it breaks or can no longer be use
> Considering the data in the Excel file House Market Value as a population of homeowners on this street, compute the mean, variance, and standard deviation for each of the variables using a spreadsheet and formulas (4.4), (4.7), and (4.9). Verify your cal
> Compute the mean, median, midrange, and mode for each of the importance factors in the Excel file Coffee Shop Preferences using the appropriate Excel functions.
> Find the mean, median, and midrange for the data in the Excel file Automobile Quality using the appropriate Excel functions or formulas.
> Use PivotTables to construct cross-tabulations between each pair of variables in the Excel file Beverage Preferences
> Use PivotTables to construct cross-tabulations for (1) neighborhood and improvement and (2) neighborhood and structure home for the Excel file Home.
> Find the first, second, and third quartiles for the sales amounts in the Sales Transactions database and interpret the results.
> Find the first, second, and third quartiles for the combined amounts of checking and savings accounts in the Excel file Credit Risk Data and interpret the results.
> Find the 25th and 70th percentiles of the costs in the Excel file Road Construction. Use formula (4.3), the Excel PERCENTILE.INC function, and the Rank and Percentile tool, and compare the results.
> Use a PivotTable to construct a frequency distribution and histogram for GPA in the Excel file Grade Point Averages.
> Use a PivotTable to develop a frequency distribution with six bins for the age of individuals in the Base Data worksheet in the Credit Risk Data file. Compute and chart the relative and cumulative relative frequencies.
> Part 1: The Performance Lawn Equipment Database contains data needed to develop a pro forma income statement. Dealers selling PLE products all receive 18% of sales revenue for their part of doing business, and this is accounted for as the selling expense
> Use a PivotTable to construct a frequency distribution and histogram of lunch sales amounts in the Restaurant Sales database.
> Identify the bins for number of letters, width, and height in the provided data in the Excel file Letter. Then use the Histogram tool to compute frequency distributions and cumulative relative frequencies and create charts for the data.
> A survey handed out to students at a local university in Munich, Germany, asked the following: ■ Where do you live? (1- On Campus 2- City 3- Other) ■ How do you feel today? (using a scale of 1–5, ranging from very happy to very unhappy) ■ What is your f
> Construct a column chart for the data in the Excel file Purchasing Rate to allow comparison of the rate for each product with the date. Would any other charts be better for visually conveying this information? Why?
> The Excel file Monthly Visits provides the data for monthly visitors visited a playground and the number of shows prepared by the playground organizer during the specific month. Create a scatter diagram to show the relationship between the number of visi
> The Excel file Mortgage Installment provides the monthly installment of a mortgage loan by different fixed interest rate (%) provided by different banks. Construct a scatter diagram to show the relationship between the monthly installment and the fixed i
> Create a stacked area chart for the monthly average sales of the different types of fuel in the Excel file Average Fuel Sales. What conclusion can you reach?
> The Excel file Expenditure contains data on a country’s expenditure on various sports during a particular year. Create a pie chart showing the percentage breakdown of total expenditure.
> Create a pie chart for all the given dates and a stock chart for the high/low/close prices for March 2018 in the Stock Excel file.
> Create a useful dashboard for the data in the Excel file Employees. Use appropriate charts, layouts, and other visualization tools that help to convey the information. Explain why you chose the elements of the dashboard and how a manager might use them.
> The worksheet Purchasing Survey in the Performance Lawn Care Database provides data related to predicting the level of business (Usage Level) obtained from a third-party survey of purchasing managers of firms that are customers of Performance Lawn Equipm
> Create a useful dashboard for the data in the Excel file Store and Regional Sales Database. Use appropriate charts and layouts and other visualization tools that help to convey the information. Explain why you chose the elements of the dashboard and how
> Create a line chart illustrating the number of AM and PM travelers for each month in the Excel file Traveler.
> Create a useful dashboard for the data in the Excel file Restaurant Sales. Use appropriate charts and layouts and other visualization tools that help to convey the information. Explain why you chose the elements of the dashboard and how a manager might u
> Create a useful dashboard for the data in the Excel file President’s Inn Guest Database. Use the additional information stated in Problem 20 of Chapter 2: Room rates are the same for one or two guests; however, additional guests must pay an additional $2
> A survey was conduct for determine the number of vegetarians and non-vegetarians between two different group of age of people. The survey results the followings: Convert the data into percentages for each age group. Then construct a chart of count and a
> Construct an appropriate chart or charts to visualize the information in the Budget Forecasting Excel file. Explain why you chose the chart(s) you used.
> Construct an appropriate chart to show the sales per unit for the primary industry in the Excel file Primary Industry.
> The Excel file Transportation provides sales data about 10 different industries. Construct two stacked bar charts that will allow you to compare any differences due to time or age groups and draw any conclusions that you can. Suggest another type of char
> Create clustered column and stacked column charts for the pre-MBA and post-MBA salary data in the Excel file MBA Motivation and Salary Expectations. Discuss which type of chart you feel is better to use to explain the information.
> In the Excel file Automobile Quality Ranking, search for and add a new column for the country of origin for each brand. Then sort the data from the lowest to highest by number of problems per 100 vehicles in Excel. What conclusions can you reach?
> PLE collects a variety of data from special studies, many of which are related to the quality of its products. The company collects data about functional test performance of its mowers after assembly; results from the past 30 days are given in the worksh
> The Excel file Global Industry Default and Rating summarizes financial information for 32 European firms, in the manufacturing and services industries, and their perceived risk of default. Convert these data into an Excel table. Use table-based calculati
> The Excel file Stationary provides the sales data for a stationary company, and each row represents an order for its products. Convert these data into an Excel table and filter the central region for those that have sold more than 50 units. What is the d
> Convert the Order Specifications database to an Excel table. Use the techniques to find: a. the total cost of all orders. b. the total cost of all orders placed with Multipurpose Fasteners. c. the total quantity of airframe bolts purchased.
> Convert the Hospital Claim database to an Excel table. Use the techniques to find: a. the total number of claims. b. the total number of outpatient claims. c. the total number of claims in January.
> The Financial Forecasts database shows estimated variable and fixed expenses of a firm for the first nine months of the coming year. Define range names for each month and the type of expense. Then use the range names in formulas to find the total for eac
> The Excel file S&P 500 provides open, high, low, and close values for the S&P 500 index over a period of time. a. Enter any date (using the format month/day/year) within the range of the data in cell G2. Use a MATCH function in cell G3 to find the row in
> A shirt manufacturer needs to supply invoices to customers based on data from the Shirt Production Excel file, which indicates the costs (in £) and sizes. Modify the file to use the VLOOKUP function to compute the customer invoice when product specificat

