Question: 1. Many proportions were generated in the
1. Many proportions were generated in the focus groups and market research that were conducted for this project, including the proportion of the market that is Hispanic, the proportion of Hispanic grocery shoppers that are women, the proportion of chip purchasers that are teens, and so on. Use techniques presented in this chapter to analyze each of the following and discuss how the results might affect marketing decision makers regarding the Hispanic market.
a. Suppose that in the past, 94% of all Hispanic grocery shoppers were women. Perhaps due to changing cultural values, we believe that more Hispanic men are now grocery shopping. We randomly sample 689 Hispanic grocery shoppers from around the United States and 606 are women. Does this result provide enough evidence to conclude that a lower proportion of Hispanic grocery shoppers now are women?
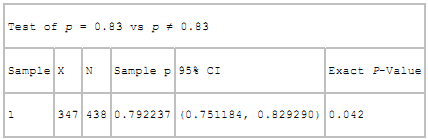
b. What proportion of Hispanics listen primarily to advertisements in Spanish? Suppose one source says that in the past the proportion has been about .83. We want to test to determine whether this figure is true. A random sample of 438 Hispanics is selected, and the Minitab results of testing this hypothesis are shown here. Discuss and explain this output and the implications of this study using α = .05.
Test and CI for One Proportion
2. The statistical mean can be used to measure various aspects of the Hispanic culture and the Hispanic market, including size of purchase, frequency of purchase, age of consumer, size of store, and so on. Use techniques presented in this chapter to analyze each of the following and discuss how the results might affect marketing decisions.
a. What is the average age of a purchaser of Doritos Salsa Verde? Suppose initial tests indicate that the mean age is 31. Is this figure really correct? To test whether it is, a researcher randomly contacts 24 purchasers of Doritos Salsa Verde, with results shown in the following Excel output. Discuss the output in terms of a hypothesis test to determine whether the mean age is actually 31. Let α be .01. Assume that ages of purchasers are normally distributed in the population.
Mean ……………………………… 28.81
Variance ……………………… 50.2651
Observations ……………………….. 24
df ………………………..……………... 23
t Stat ………………………...……. −1.52
P (T t Critical one-tail ………………. 2.50
P (T t Critical two-tail ………………. 2.81
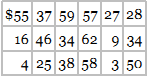
b. What is the average expenditure of a Hispanic customer on chips per year? Suppose it is hypothesized that the figure is $45 per year. A researcher who knows the Hispanic market believes that this figure is too high and wants to prove her case. She randomly selects 18 Hispanics, has them keep a log of grocery purchases for one year, and obtains the following figures for expenditures on chips. Analyze the data using techniques from this chapter and an alpha of .05. Assume that expenditures per customer are normally distributed in the population.
Frito-Lay Targets the Hispanic Market
Frito Company was founded in 1932 in San Antonio, Texas, by Elmer Doolin. H. W. Lay & Company was founded in Atlanta, Georgia, by Herman W. Lay in 1938. In 1961, the two companies merged to form Frito-Lay, Inc., with headquarters in Texas. Frito-Lay produced, distributed, and marketed snack foods with particular emphasis on various types of chips. In 1965, the company merged with Pepsi-Cola to form PepsiCo, Inc. Three decades later, Pepsi-Cola combined its domestic and international snack food operations into one business unit called Frito-Lay Company. Currently, there are about 55,000 Frito-Lay employees in the United States and Canada.
In the late 1990s, despite its overall popularity, Frito-Lay faced a general lack of appeal to Hispanics, a fast-growing U.S. market. In an effort to better penetrate that market, Frito-Lay hired various market researchers to determine why Hispanics were not purchasing their products as often as company officials had hoped and what could be done about the problem. In the studies, market researchers discovered that Hispanics thought Frito-Lay products were too bland, Frito-Lay advertisements were not being widely viewed by Hispanics, and Hispanics tended to purchase snacks in small bags at local grocery stores rather than in the large family-style bags sold at large supermarkets.
Focus groups composed of male teens and male young adults—a group that tends to consume a lot of chips—were formed. The researchers determined that even though many of the teens spoke English at school, they spoke Spanish at home with their family. From this discovery, it was concluded that Spanish advertisements would be needed to reach Hispanics. In addition, the use of Spanish rock music, a growing movement in the Hispanic youth culture, could be effective in some ads.
Researchers also found that using a “Happy Face†logo, which is an icon of Frito-Lay’s sister company in Mexico, was effective. Because it reminded the 63% of all Hispanics in the United States who are Mexican American of snack foods from home, the logo increased product familiarity.
As a result of this research, Frito-Lay launched its first Hispanic products in San Antonio in 1997. Within a few years, sales of the Doritos brand improved 32% in Hispanic areas. In May 2002, Frito-Lay teamed up with its Mexican affiliate, Sabritas, to launch a new line of products to further appeal to Hispanic customers. Included in these offerings are Sabritas Adobadas tomato and chile potato chips, Sabritones Churrumais fried corn strips with chile and lime seasonings, Crujitos queso and chile flavor puffed corn twists, Fritos Sabrositas lime and chile chips, El Isleno Plantains, and others.
More recently, Frito-Lay has been relying on input and guidance from the Adelante employee network, which is a multicultural Latina/Hispanic professional organization associated with PepsiCo. At Frito-Lay, the organization’s mission is to help develop a diverse, inclusive culture accelerating growth opportunities for associates while providing a competitive advantage in an increasingly diverse marketplace. As part of this effort, Adelante has been used to help develop new flavors and advertising programs for Hispanics. Based on information gleaned from Adelante members, new Frito-Lay snackproducts are being test-marketed in several states, and guacamole-flavored Doritos became one of the most successful new-product launches in the company’s history. Today, Frito-Lay brands account for almost 73% of the torilla/tostada chip market and 77.5% of the corn snack market (excluding tortilla chips).
In the research process for Frito-Lay Company, many different numerical questions were raised regarding Frito-Lay products, advertising techniques, and purchase patterns among Hispanics. In each of these areas, statistics—in particular, hypothesis testing—plays a central role. Using the case information and the concepts of statistical hypothesis testing, discuss the following.
Transcribed Image Text:
> A national survey showed that Hillshire Farm Deli Select cold cuts were priced, on the average, at $5.20 per pound. Suppose a national survey of 23 retail outlets was taken and the price per pound of Hillshire Farm Deli Select cold cuts was ascertained.
> A national magazine marketing firm attempts to win subscribers with a mail campaign that involves a contest using magazine stickers. Often when people subscribe to magazines in this manner they sign up for multiple magazine subscriptions. Suppose the mar
> A research firm has been asked to determine the proportion of all restaurants in the state of Ohio that serve alcoholic beverages. The firm wants to be 98% confident of its results but has no idea of what the actual proportion is. The firm would like to
> A regional survey of 560 companies asked the vice president of operations how satisfied he or she was with the software support received from the computer staff of the company. Suppose 33% of the 560 vice presidents said they were satisfied. Construct a
> A survey of 77 commercial airline flights of under 2 hours resulted in a sample average late time for a flight of 2.48 minutes. The population standard deviation was 12 minutes. Construct a 95% confidence interval for the average time that a commercial f
> According to a survey by Runzheimer International, the average cost of a fast-food meal (quarter-pound cheeseburger, large fries, medium soft drink, excluding taxes) in Seattleis $4.82. Suppose this figure was based on a sample of 27 different establishm
> A movie theater has had a poor accounting system. The manager has no idea how many large containers of popcorn are sold per movie showing. She knows that the amounts vary by day of the week and hour of the day. However, she wants to estimate the overall
> A national survey of companies included a question that asked whether the company had at least one bilingual telephone operator. The sample results of 90 companies follow (Y denotes that the company does have at least one bilingual operator; N denotes th
> A meat-processing company in the Midwest produces and markets a package of eight small sausage sandwiches. The product is nationally distributed, and the company is interested in knowing the average retail price charged for this item in stores across the
> A national survey of insurance offices was taken, resulting in a random sample of 245 companies. Of these 245 companies, 189 responded that they were going to purchase new software for their offices in the next year. Construct a 90% confidence interval t
> An entrepreneur wants to open an appliance repair shop. She would like to know about what the average home repair bill is, including the charge for the service call for appliance repair in the area. She wants the estimate to be within $20 of the actual f
> A national survey on telemarketing was undertaken. One of the questions asked was: How long has your organization had a telemarketing operation? Suppose the following data represent some of the answers received to this question (in years). Suppose furthe
> According to a survey by Topaz Enterprises, a travel auditing company, the average error by travel agents is $128. Suppose this figure was obtained from a random sample of 41 travel agents and the sample standard deviation is $21. What is the point estim
> Is the environment a major issue with Americans? To answer that question, an analyst conducts a survey of 1255 randomly selected Americans. Suppose 714 of the sampled people replied that the environment is a major issue with them. Construct a 95% confide
> A national beauty spa chain wants to estimate the number of times per year a woman has her nails done at one of their spas if she uses one at least once a year. The chain’s analyst estimates that, of those women who use a beauty spa at least once a year
> A random sample of small-business managers was given a leadership-style questionnaire. The results were scaled so that each manager received a score for initiative. Suppose the following data are a random sample of these scores. Assuming σ is
> What is the average length of a company’s policy book? Suppose policy books are sampled from 45 medium-sized companies. The average number of pages in the sample books is 213, and the population standard deviation is 48. Use this information to construct
> Use the data in Problem 8.53 to construct a 99% confidence interval to estimate the population variance for the number of diapers used during a 24-hour period for one-month- olds. How could information about the population variance be used by a manufactu
> Suppose you want to estimate the proportion of cars that are sport utility vehicles (SUVs) being driven in Kansas City, Missouri, at rush hour by standing on the corner of I-70 and I-470 and counting SUVs. You believe the figure is no higher than .40. If
> A community health association is interested in estimating the average number of maternity days women stay in the local hospital. A random sample is taken of 36 women who had babies in the hospital during the past year. The following numbers of maternity
> In planning both market opportunity and production levels, being able to estimate the size of a market can be important. Suppose a diaper manufacturer wants to know how many diapers a one-month-old baby uses during a 24-hour period. To determine this usa
> Determine the sample size necessary under the following conditions. a) To estimate μ with σ = 44, E = 3, and 95% confidence. b) To estimate μ with a range of values from 20 to 88 with E = 2 and 90% confidence. c) To estimate p with p unknown, E = .04, an
> Use the following data to construct 90% and 95% confidence intervals to estimate the population variance. Assume the data come from a normally distributed population.
> Construct 90%, 95%, and 99% confidence intervals to estimate μ from the following data. State the point estimate. Assume the data come from a normally distributed population.
> Use the following data to construct 80%, 94%, and 98% confidence intervals to estimate μ. Assume that σ is 7.75. State the point estimate.
> What proportion of shoppers at a large appliance store actually makes a large-ticket purchase? To estimate this proportion within 10% and be 95% confident of the results, how large a sample should you take? Assume you have no idea what proportion of all
> What proportion of secretaries of Fortune 500 companies has a personal computer at his or her workstation? You want to answer this question by conducting a random survey. How large a sample should you take if you want to be 95% confident of the results a
> Suppose a production facility purchases a particular component part in large lots from a supplier. The production manager wants to estimate the proportion of defective parts received from this supplier. She believes the proportion defective is no more th
> A group of investors wants to develop a chain of fast-food restaurants. In determining potential costs for each facility, they must consider, among other expenses, the average monthly electric bill. They decide to sample some fast-food restaurants curren
> The average total dollar purchase at a convenience store is less than that at a supermarket. Despite smaller-ticket purchases, convenience stores can still be profitable because of the size of operation, the volume of business, and the markup. A business
> Suppose you have been following a particular airline stock for many years. You are interested in determining the average daily price of this stock in a 10-year period and you have access to the stock reports for these years. However, you do not want to a
> A bank officer wants to determine the amount of the average total monthly deposits per customer at the bank. He believes an estimate of this average amount using a confidence interval is sufficient. How large a sample should he take to be within $200 of
> Determine the sample size necessary to estimate p for the following information. a) E = .02, p is approximately .40, and confidence level is 96% b) E is to be within .04, p is unknown, and confidence level is 95% c) E is to be within 5%, p is approximate
> Determine the sample size necessary to estimate μ for the following information. a) σ = 36 and E = 5 at 95% confidence b) σ = 4.13 and E = 1 at 99% confidence c) Values range from 80 to 500, error is to be within 10, and the confidence level is 90% d) Va
> Suppose a random sample of 14 people 30–39 years of age produced the household incomes shown here. Use these data to determine a point estimate for the population variance of household incomes for people 30–39 years of
> A manufacturing plant produces steel rods. During one production run of 20,000 such rods, the specifications called for rods that were 46 centimeters in length and 3.8 centimeters in width. Fifteen of these rods comprising a random sample were measured f
> The Interstate Conference of Employment Security Agencies says the average workweek in the United States is down to only 35 hours, largely because of a rise in part-time workers. Suppose this figure was obtained from a random sample of 20 workers and tha
> Use the following sample data to estimate the population variance. Produce a point estimate and a 98% confidence interval. Assume the data come from a normally distributed population.
> For each of the following sample results, construct the requested confidence interval. Assume the data come from normally distributed populations. a) n = 12, x̅ = 28.4, s2 = 44.9; 99% confidence for σ2 b) n = 7, x̅ = 4.37, s = 1.24; 95% confidence for σ2
> Suppose a survey of 275 executives is taken in an effort to determine what qualities are most important for an effective CEO to possess. The survey participants are offered several qualities as options, one of which is “communication.” One hundred twenty
> A small lawnmower company produced 1500 lawnmowers in 2008. In an effort to determine how maintenance-free these units were, the company decided to conduct a multiyear study of the 2008 lawnmowers. A sample of 200 owners of these lawnmowers was drawn ran
> A random sample of size 70 is taken from a population that has a variance of 49. The sample mean is 90.4. What is the point estimate of μ? Construct a 94% confidence interval for μ.
> A random sample of 81 items is taken, producing a sample mean of 47. The population standard deviation is 5.89. Construct a 90% confidence interval to estimate the population mean.
> According to Runzheimer International, in a survey of relocation administrators 63% of all workers who rejected relocation offers did so for family considerations. Suppose this figure was obtained by using a random sample of the files of 672 workers who
> For a random sample of 36 items and a sample mean of 211, compute a 95% confidence interval for μ if the population standard deviation is 23.
> Use the following information to construct the confidence intervals specified to estimate μ. a) 95% confidence for x̅ = 25, σ = 3.5, and n = 60 b) 98% confidence for x̅ = 119.6, σ = 23.89, and n = 75 c) 90% confidence for x̅ = 3.419, σ = 0.974, and n = 3
> 1. Among other things, the Container Store has grown and flourished because of strong customer relationships, which include listening to customer needs, providing products that meet customer needs, having salespeople who understand both customer needs an
> The successful Clarkson knife-gate valve contains a wafer that is thin and light. Yet, the wafer is so strong it can operate with up to 150 pounds-per-square-inch (psi) of pressure on it, making it much stronger than those of competing brands. Suppose Em
> 1. Suppose a fast-food analyst is interested in determining if there is a difference between Denver and Chicago in the average price of a comparable hamburger. There is some indication, based on information published by Burger Week, that the average pric
> Suppose you are using a completely randomized design to study some phenomenon. There are five treatment levels and a total of 55 people in the study. Each treatment level has the same sample size. Complete the following ANOVA.
> Compute a one-way ANOVA on the following data. 1 …………….….. 2 27 ………….… 22 31 ….……….… 27 31 …...…….… 25 29 ………….… 23 30 ………….… 26 27 ………….… 27 28 ………….… 23 Determine the observed F value. Compare it to the critical table F value and decide whether to rej
> Develop a one-way ANOVA on the following data. Determine the observed F value. Compare it to the critical F value and decide whether to reject the null hypothesis. Use a 1% level of significance.
> Discuss the following Minitab output. Analysis of Variance Means
> What proportion of commercial airline pilots are more than 40 years of age? Suppose a business analyst has access to a list of all pilots who are members of the Commercial Airline Pilots Association. If this list is used as a frame for the study, she can
> Study the following Minitab output. Determine whether there are any significant effects and discuss the results. What kind of design was used and what was the size of it? Analysis of Variance
> Interpret the following Excel output. Discuss the structure of the experimental design and any significant effects. Alpha is .05. ANOVA: Two-Factor Without Replication
> Study the following Minitab output and graph. Discuss the meaning of the output. Analysis of Variance for Dependent Variable
> Following is Excel output for an ANOVA problem. Describe the experimental design. The given value of alpha was .05. Discuss the output in terms of significant findings. ANOVA: Two-Factor Without Replication
> Analyze the following Minitab output. Describe the design of the experiment. Using α = .05, determine whether there are any significant effects; if so, explain why. Discuss any other ramifications of the output. Analysis of Variance
> Are some office jobs viewed as having more status than others? Suppose a study is conducted in which eight unemployed people are interviewed. The people are asked to rate each of five positions on a scale from 1 to 10 to indicate the status of the positi
> Why are mergers attractive to CEOs? One of the reasons might be a potential increase in market share that can come with the pooling of company markets. Suppose a random survey of CEOs is taken, and they are asked to respond on a scale from 1 to 5 (5 repr
> Compute a one-way ANOVA on the following data. Determine the observed F value. Compare the observed F value with the critical table F value and decide whether to reject the null hypothesis. Use α = .01.
> The Construction Labor Research Council lists a number of construction labor jobs that seem to pay approximately the same wages per hour. Some of these are bricklaying, iron working, and crane operation. Suppose a labor analyst takes a random sample of w
> Agricultural analysts are studying three different ways of planting peanuts to determine whether significantly different levels of production yield will result. The analysts have access to a large peanut farm on which to conduct their tests. They identif
> The highway department wants to estimate the proportion of vehicles on Interstate 25 between the hours of midnight and 5:00 a.m. that are 18-wheel tractor trailers. The estimate will be used to determine highway repair and construction considerations and
> A major automobile manufacturer wants to know whether there is any difference in the average mileage of four different brands of tires (A, B, C, and D), because the manufacturer is trying to select the best supplier in terms of tire durability. The manuf
> A company conducted a consumer research project to ascertain customer service ratings from its customers. The customers were asked to rate the company on a scale from 1 to 7 on various quality characteristics. One question was the promptness of company r
> Compute a two-way ANOVA on the following data (α = .01).
> A two-way ANOVA has been computed on a factorial design. Treatment 1 has five levels and treatment 2 has two levels. Each cell contains four measures. Complete the following ANOVA table. Use α = .05 to test to determine significance of the
> Analyze the following data, gathered from a randomized block design using α = .05. If there is a significant difference in the treatment effects, use Tukey’s HSD test to do multiple comparisons.
> Complete the following ANOVA table and determine whether there is any significant difference in treatment effects. Let α = .05.
> Examine the structure of the following experimental design. Determine which of the three designs presented in the chapter would be most likely to characterize this structure. Discuss the variables and the levels of variables. Determine the degrees of fre
> Compute a one-way ANOVA on the following data. Let α = .01. Use the Tukey-Kramer procedure to conduct multiple comparisons for the means.
> Compute a one-way ANOVA on the following data. Determine the observed F value. Compare the observed F value with the critical table F value and decide whether to reject the null hypothesis. Use α = .05.
> You are asked to analyze a completely randomized design that has six treatment levels and a total of 42 measurements. Complete the following table, which contains some information from the study.
> What proportion of pizza restaurants that are primarily for walk-in business have a salad bar? Suppose that, in an effort to determine this figure, a random sample of 1250 of these restaurants across the United States based on the Yellow Pages is called.
> Complete the following ANOVA table.
> Compute a one-way ANOVA on the following data. Use α = .05. If there is a significant difference in treatment levels, use Tukey’s HSD to compute multiple comparisons. Let α = .05 for the multiple comparisons.
> Finish the computations in the Minitab ANOVA table shown below and determine the critical table F values. Interpret the analysis. Discuss this problem, including the structure of the design, the sample sizes, and decisions about the hypotheses. Analysis
> Consider the valve opening data displayed in Table 11.1. Suppose the data represent valves produced on four different machines on three different shifts and that the quality controllers want to know whether there is any difference in the mean measurement
> Study the following ANOVA table produced by using Minitab. Describe the design (number of treatments, sample sizes, etc.). Are there any significant effects? Discuss the output. Analysis of Variance for DV
> A shoe retailer conducted a study to determine whether there is a difference in the number of pairs of shoes sold per day by stores according to the number of competitors within a 1-mile radius and the location of the store. The company researchers selec
> Children are generally believed to have considerable influence over their parents in the purchase of certain items, particularly food and beverage items. To study this notion further, a study is conducted in which parents are asked to report how many foo
> Suppose the following data have been gathered from a study with a two-way factorial design. Use α = .05 and a two-way ANOVA to analyze the data. State your conclusions.
> The data gathered from a two-way factorial design follow. Use the two-way ANOVA to analyze these data. Let α = .01.
> Is there a difference in the family demographics of people who stay at motels? Suppose a study is conducted in which three categories of motels are used: economy motels, modestly priced chain motels, and exclusive motels. One of the dependent variables s
> According to the Stern Marketing Group, 9 out of 10 professional women say that financial planning is more important today than it was five years ago. Where do these women go for help in financial planning? Forty-seven percent use a financial advisor (br
> Complete the following two-way ANOVA table. Determine the critical table F values and reach conclusions about the hypotheses for effects. Let α = .05.
> Complete the following two-way ANOVA table. Determine the critical table F values and reach conclusions about the hypotheses for effects. Let α = .05.
> Describe the following factorial design. How many independent and dependent variables are there? How many levels are there for each treatment? If the data were known, could interaction be determined from this design? Compute all degrees of freedom. Each
> Describe the following factorial design. How many independent and dependent variables are there? How many levels are there for each treatment? If the data were known, could interaction be determined from this design? Compute all degrees of freedom. Each
> The comptroller of a company is interested in determining whether the average length of long-distance calls by managers varies according to type of telephone. A randomized block design experiment is set up in which a long-distance call by each of five ma
> As part of a manufacturing process, a plastic container is supposed to be filled with 46 ounces of saltwater solution. The plant has three machines that fill the containers. Managers are concerned that the machines might not be filling the containers wit
> In recent years, the debate over the U.S. economy has been constant. The electorate seems somewhat divided as to whether the economy is in a recovery or not. Suppose a survey was undertaken to ascertain whether the perception of economic recovery differs
> Safety in motels and hotels is a growing concern among travelers. Suppose a survey was conducted by the National Motel and Hotel Association to determine U.S. travelers’ perception of safety in various motel chains. The association chos
> A randomized block design has a treatment variable with four levels and a blocking variable with seven blocks. Using this information and α = .01, complete the following table and reach a conclusion about the null hypothesis.
> A randomized block design has a treatment variable with six levels and a blocking variable with 10 blocks. Using this information and α = .05, complete the following table and reach a conclusion about the null hypothesis.
> According to Music and Copyright, 2017, Universal Music Group is the music leader in combined physical and digital recorded music trade revenue. Suppose a business analyst wants to determine what market share the company holds in the city of St. Louis by
> A large multinational banking company wants to determine whether there is a significant difference in the average dollar amounts purchased by users of different types of credit cards. Among the credit cards being studied are MasterCard, Visa, Discover, a
> The following data were gathered from a randomized block design. Use α = .01 to test for a significant difference in the treatment levels. Establish the hypotheses and reach a conclusion about the null hypothesis.

