Question: An economist wants to determine the relation
An economist wants to determine the relation between one’s FICO score, x, and the interest rate of a 36-month auto loan, y. The given data represent the interest rate (in percent) a bank would offer on a 36-month auto loan for various FICO scores.
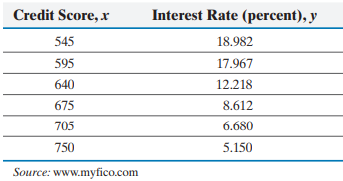
(a) Find the least-squares regression line treating the FICO score, x, as the explanatory variable and the interest rate, y, as the response variable.
(b) Interpret the slope and y-intercept, if appropriate. Note: Credit scores have a range of 300 to 850.
(c) Predict the interest rate a person would pay if her FICO score were the median score of 723.
(d) Suppose Bob has a FICO score of 680 and he is offered an interest rate of 8.3%. Is this a good offer? Why?
> A college education is certainly a factor in determining one’s income. Researchers at payscale.com wanted to determine if there was an association between mid- career income and household income while an individual is in college. The idea was to determin
> In a recent Harris Poll, a random sample of adult Americans (18 years and older) was asked, “Given a choice of the following, which one would you most want to be?” Results of the survey, by gender, are given in the contingency table. (a) How many adult A
> In a recent Harris Poll, a random sample of adult Americans (18 years and older) was asked, “When you see an ad emphasizing that a product is ‘Made in America,’ are you more likely to buy it, less likely to buy it, or neither more nor less likely to buy
>
>
> Explain the idea behind Simpson’s Paradox.
> Explain why we use the term association rather than correlation when describing the relation between two qualitative variables.
> What does it mean when an observational study is retrospective? What does it mean when an observational study is prospective?
> Match the coefficient of determination to the scatter diagram. The scales on the horizontal and vertical axis are the same for each scatter diagram. (a) R2 = 0.58 (b) R2 = 0.90 (c) R2 = 1 (d) R2 = 0.12
> Total deviation ______ deviation ______ deviation
> The_____, R2, measures the proportion of total variation in the response variable that is explained by the least- squares regression line.
> Go to www.pearsonhighered.com/ sullivanstats to obtain the data file SullivanStatsSurveyII using the file format of your choice for the version of the text you are using. One question asked in this survey is, “What percent of income do you believe indivi
> Go to www.pearsonhighered.com/sullivanstats to obtain the data file 4_3_17. The data represent the 2015 tax rate per pack of cigarettes and the percent of cigarettes smuggled as a percentage of total consumption. A negative value of consumption represent
> The data on the next page represent scores earned by students in Sullivan’s Elementary Algebra course for Chapter 2 (Linear Equations and Inequalities in One Variable) and Chapter 3 (Linear Equations and Inequalities in Two Variables). Completely summari
> Is the width of a tornado related to the amount of distance for which the tornado is on the ground? Go to www.pearsonhighered.com/sullivanstats to obtain the data file 4_3_15. The data represent the width (in yards) and length (in miles) for tornadoes in
> Suppose that we find a bear that is 205 cm long and weighs 187 kg and add the bear to the data in Problem 20 from Section 4.2. Compute the coefficient of determination of the expanded data set. What effect does the additional bear have on R2?
> Suppose that we add the Dodge Viper to the data in Problem 24 in Section 4.2. A Dodge Viper weighs 3425 pounds and gets 11 miles per gallon. Compute the coefficient of determination of the expanded data set. What effect does the addition of the Viper to
> Use the results from Problem 32 in Section 4.1 and Problem 22 in Section 4.2. (a) What proportion of the variability in the wind speed is explained by the relation between the atmospheric pressure and wind speed? (b) Interpret the coefficient of determin
> Explain why it would be unlikely to use a designed experiment to answer the research question posed in Example 3.
> Use the results from Problem 31 in Section 4.1 and Problem 21 in Section 4.2. (a) What proportion of the variability in distance is explained by the relation between speed at which the ball is hit and distance? (b) Interpret the coefficient of determinat
> Use the results from Problem 30 in Section 4.1 and Problem 20 in Section 4.2 to: (a) Compute the coefficient of determination, R2. (b) Interpret the coefficient of determination and comment on the adequacy of the linear model.
> Use the results from Problem 29 in Section 4.1 and Problem 19 in Section 4.2 to: (a) Compute the coefficient of determination, R2. (b) Interpret the coefficient of determination and comment on the adequacy of the linear model.
> Use the results from Problem 28 in Section 4.1 and Problem 18 in Section 4.2 to: (a) Determine the coefficient of determination, R2. (b) Interpret the coefficient of determination and comment on the adequacy of the linear model.
> Use the results from Problem 27 in Section 4.1 and Problem 17 in Section 4.2 to: (a) Determine the coefficient of determination, R2. (b) Interpret the coefficient of determination and comment on the adequacy of the linear model.
> As concrete cures, it gains strength. The following data represent the 7-day and 28-day strength (in pounds per square inch) of a certain type of concrete. The coefficient of determination is 57.5%. Provide an interpretation of this value.
> Perhaps you are familiar with the famous Old Faithful geyser in Yellowstone National Park. Another Old Faithful geyser is located in Calistoga in California’s Napa Valley. The following data represent the time (in minutes) between eruptions and the lengt
> Use the linear correlation coefficient given to determine the coefficient of determination, R2. Interpret each R2. (a) r = -0.32 (b) r = 0.13 (c) r = 0.40 (d) r = 0.93
> If the linear correlation between two variables is negative, what can be said about the slope of the regression line?
> The difference between the observed and predicted value of y is the error, or______ .
> The data used in the influenza study presented in Example 3 were obtained from a cohort study. What does this mean? Why is a cohort study superior to a case-control study?
> Only 12 men have walked on the moon. The average time these men spent on the moon was 43.92 hours. Source: www.theguardian.com
> Mark Twain, in his book Life on the Mississippi (1884), makes the following observation: Therefore, the Mississippi between Cairo and New Orleans was twelve hundred and fifteen miles long one hundred and seventy-six years ago. It was eleven hundred and e
> Explain what each point on the least-squares regression line represents.
> Explain the meaning of Legendre’s quote given on page 189.
> Explain the phrase outside the scope of the model. Why is it dangerous to make predictions outside the scope of the model?
> What is a residual? What does it mean when a residual is positive?
> It is well known that women should not smoke while pregnant, but what is the effect of smoking on a baby’s birth weight? Researchers Ira M. Bernstein and associates “sought to estimate how the pattern of maternal smoking throughout pregnancy influences n
> One of the biggest factors in determining the value of a home is the square footage. The following data represent the square footage and selling price (in thousands of dollars) for a random sample of homes for sale in Naples, Florida in January 2017. (a)
> Go to www.pearsonhighered.com/ sullivanstats to obtain the data file 4_2_28 using the file format of your choice for the version of the text you are using. The variable “Cost” represents the four-year cost including tuition, supplies, room and board. The
> The following data represent the number of licensed drivers in various age groups and the number of fatal accidents within the age group by gender. (a) Find the least-squares regression line for males treating number of licensed drivers as the explanator
> Explain why it does not make sense to find a least-squares regression line for the Bear Market data from Problem 34 in Section 4.1.
> Given a choice, would you conduct a study using an observational study or a designed experiment? Why?
> Explain why it does not make sense to find a least-squares regression line for the CEO Performance data from Problem 33 in Section 4.1.
> An engineer wants to determine how the weight of a car, x, affects gas mileage, y. The following data represent the weights of various domestic cars and their miles per gallon in the city for the 2015 model year. (a) Find the least-squares regression lin
> Example 5 in Section 4.1 on page 178 discussed the effect of cola consumption on bone mineral density in the femoral neck of women. (a) Find the least-squares regression line treating cola consumption per week as the explanatory variable. (b) Interpret t
> The following data represent the maximum wind speed (in knots) and atmospheric pressure (in millibars) for a random sample of hurricanes that originated in the Atlantic Ocean. (a) Find the least-squares regression line treating atmospheric pressure as t
> The following data represent the speed at which a ball was hit (in miles per hour) and the distance it traveled (in feet) for a random sample of home runs in a Major League baseball game. (a) Find the least-squares regression line treating speed at which
> The American black bear (Ursus americanus) is one of eight bear species in the world. It is the smallest North American bear and the most common bear species on the planet. In 1969, Dr. Michael R. Pelton of the University of Tennessee initiated a long-te
> A pediatrician wants to determine the relation that exists between a child’s height, x, and head circumference, y. She randomly selects 11 children from her practice, measures their heights and head circumferences, and obtains the following data. (a) Fin
> The following data represent commute times (in minutes) and score on a well-being survey. (a) Find the least-squares regression line treating the commute time, x, as the explanatory variable and the index score, y, as the response variable. (b) Interpret
> The least- squares regression equation / relates the carbon dioxide emissions (in millions of tonnes), y, and electricity produced (terrawatt-hours), x, for all countries in the world. Source: www.bp.com (a) Interpret the slope. (b) The lowest electric e
> Which type of study allows the researcher to claim causation between an explanatory variable and a response variable?
> Is there a relation between the age difference between husband/wives and the percent of a country that is literate. Researchers found the least-squares regression between age difference (husband age minus wife age), y, and literacy rate (percent of the p
> After the first exam in a statistics course, Professor Katula surveyed 14 randomly selected students to determine the relation between the amount of time they spent studying for the exam and exam score. She found that a linear relation exists between the
> In Problem 15 from Section 4.1, a scatter diagram and correlation coefficient suggested there is a linear relation between the percentage of individuals who have at least a bachelor’s degree and median income in the states. In fact, the least-squares reg
>
>
>
>
>
>
> For the data set (a) Draw a scatter diagram. Comment on the type of relation that appears to exist between x and y. (b) Given that / and r = 0.957241, determine the least-squares regression line. (c) Graph the least-squares regression line on the scatter
> Match each type of study to its definition.
> For the data set (a) Draw a scatter diagram. Comment on the type of relation that appears to exist between x and y. (b) Given that / and r = -0.9477, determine the least-squares regression line. (c) Graph the least-squares regression line on the scatter
> If the linear correlation coefficient is 0, what is the equation of the least-squares regression line?
> Which of the following is true of the least-squares regression line / (a) The predicted value of / is an estimate of the mean value of the response variable for a particular value of the explanatory variable. (b) The predicted value of /is an estimate
> State the properties of the linear correlation coefficient.
> What does it mean to say two variables are positively associated? Negatively associated?
> A____ is a graph that shows the relation between two quantitative variables.
> The ____variable is the variable whose value can be explained by the value of the explanatory variable
> What is the difference between univariate data and bivariate data?
> Suppose that two variables, X and Y, are negatively associated. Does this mean that above-average values of X will always be associated with below-average values of Y? Explain.
> Suppose you work a part-time job and earn $15 per hour. Draw a scatter diagram that might represent the relation between your gross pay and hours worked. Is this a deterministic relation or a probabilistic relation?
> Match each word or phrase with its definition.
> Draw a scatter diagram that might represent the relation between the number of minutes spent exercising on an elliptical and calories burned. Draw a scatter diagram that might represent the relation between number of hours each week spent on Facebook and
> Explain the difference between correlation and causation. When is it appropriate to state that the correlation implies causation?
> Write a paragraph that explains the concept of correlation. Include a discussion of the role that/play in the computation.
> Explain what is wrong with the following statement: “We have concluded that a high correlation exists between the gender of drivers and rates of automobile accidents.” Suggest a better way to write the sentence.
> What does it mean if r = 0?
> What does it mean to say that the linear correlation coefficient between two variables equals 1? What would the scatter diagram look like?
> Professors Theodore Coladarci and Irv Kornfield from the University of Maine found a correlation of 0.68 between responses to questions on the RateMyProfessors.com website and typical in-class evaluations. Use this correlation to make an argument in fa
> Go to www.pearsonhighered.com/ sullivanstats to obtain the data file 4_1_49 using the file format of your choice for the version of the text you are using. The data represent the cost, return on investment, and graduation rate for a random sample of 50 c
> Consider the following data set: (a) Draw a scatter diagram with the x-axis starting at 0 and ending at 30 and with the y-axis starting at 0 and ending at 20. (b) Compute the linear correlation coefficient. (c) Now multiply both x and y by 2. (d) Draw a
> Consider the following set of data: (a) Draw a scatter diagram of the data and compute the linear correlation coefficient. (b) Draw a scatter diagram of the data and compute the linear correlation coefficient with the additional data point (10.4, 9.3). C
> The age of a person is commonly considered to be a continuous random variable. Could it be considered a discrete random variable instead? Explain.
> On the basis of the scatter diagram below, explain what is wrong with the following statement: “Because the linear correlation coefficient between age and median income is 0.012, there is no relation between age and median income.”
> The linear correlation between violent crime rate and percentage of the population that has a cell phone is -0.918 for years since 1995. Do you believe that increasing the percentage of the population that has a cell phone will decrease the violent crime
> In a study published in the Journal of the American Medical Association, researchers found that the length of time a mother breast-feeds is negatively associated with the likelihood a child is obese. In an interview, the head investigator stated, “It’s n
> Based on data obtained from the CIA World Factbook, the linear correlation coefficient between the number of television stations in a country and the life expectancy of residents of the country is 0.599. What does this correlation imply? Do you believe t
> Lyme disease is an inflammatory disease that results in a skin rash and flulike symptoms. It is transmitted through the bite of an infected deer tick. The following data represent the number of reported cases of Lyme disease and the number of drowning de
> One basic theory of investing is diversification. The idea is that you want to have a basket of stocks that do not all “move in the same direction.” In other words, if one investment goes down, you don’t want a second investment in your portfolio that is
> The ultimate goal in any sport (besides having fun) is to win. One measure of how well a team does is winning percentage. In baseball, a lot of effort goes into figuring out the variables that help to predict a team’s winning percentage. Go to www.pearso
> Consider the four data sets shown below. (a) Compute the linear correlation coefficient for each data set. (b) Draw a scatter diagram for each data set. Conclude that linear correlation coefficients and scatter diagrams must be used together in any stati
> The website that contained the American black bear data listed in Problem 30 actually had a bear whose length is 141.0 cm and weight is 100 kg, but incorrectly listed its length as 41.0 cm. (a) Redraw the scatter diagram with the incorrect entry. (b) Rec
> An engineer wants to determine how the weight of a car affects gas mileage. The following data represent the weights of various domestic cars and their gas mileages in the city for the 2015 model year. (a) Determine which variable is the likely explanato
> Explain the process of statistics.
> The following data represent the number of licensed drivers in various age groups and the number of fatal accidents within the age group by gender. (a) On the same graph, draw a scatter diagram for both males and females. Be sure to use a different plott
> Researchers wondered whether the size of a person’s brain was related to the individual’s mental capacity. They selected a sample of right-handed introductory psychology students who had SAT scores higher than 1350. The subjects took the Wechsler Adult I
> The following data represent the total compensation for 12 randomly selected chief executive officers (CEO) and the company’s stock performance in 2017. (a) One would think that a higher stock return would lead to a higher compensation. Based on this, wh
> The data in the next column represent the maximum wind speed (in knots) and atmospheric pressure (in millibars) for a random sample of hurricanes that originated in the Atlantic Ocean. (a) Draw a scatter diagram treating atmospheric pressure as the expla

