Question: Calculate the coefficient of determination for
Calculate the coefficient of determination for Exercise 3.58. Is this more informative than the scatter diagram?
Data from Exercise 3.58:
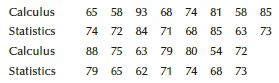
Transcribed Image Text:
Calculus 65 58 93 68 74 81 58 85 Statistics 74 72 84 71 68 85 63 73 Calculus 88 75 63 79 80 54 72 Statistics 79 65 62 71 74 68 73
> Calculate the marginal probabilities from the following table of joint probabilities. A, A, .4 .3 B, B2 .2 .1
> Given the following table of joint probabilities, calculate the marginal probabilities. A, Az A3 B, B2 .1 3 .2 .2 .1 .1
> A sportscaster states that he believes that the probability that the New York Yankees will win the World Series this year is 25%. a. Which method was used to assign that probability? b. How would you interpret the probability?
> Refer to Exercise 6.18. The results of the survey are listed next. How Safe is Uber? Responses (%) Very safe 17 Somewhat safe 28 Somewhat unsafe 21 Very unsafe 12 Not sure 22 If
> Uber, the ride-sharing service has been encountering protests mostly from taxi drivers. The taxi industry claims that Uber is more dangerous than other taxis because of the lack of government scrutiny. A survey was conducted where people were asked, “In
> Refer to Exercise 2.55. Here is a list of the top 10 foreign governments that own the U.S. debt (in order of magnitude). Depict these figures with a graph. Government Debt China, m
> Refer to Exercise 6.16. The numbers (in millions) of Americans speaking non-English languages at home are listed next. Language Spoken at Home Millions of Americans Spanish 38.4 Chinese 3.0 Tagalog 1.6 Vietnamese 1.4 F
> As of May 2016 the U.S. government owes $19,190,059,553,782. To whom does the U.S. government owe money? The list is shown below (in $billions). Use a graphical technique to depict these figures. U.S. Individuals and Institutions
> The Gallup poll in Exercise 2.40 asked American adults about their views on economic issues. The survey also asked which political party they supported. 1. Democrat 2. Independent 3. Republican Use a graphical technique to gauge the differences between t
> Refer to Exercise 7.38. Further analysis by the manager revealed that the cost of processing each page of a fax is $.25. Determine the mean and variance of the cost per fax. Data from Exercise 7.38: After an analysis of incoming faxes, the manager of an
> Exercise 2.39 featured a Gallup survey of American adults asking whether they are liberal, moderate or conservative on social issues. In addition, the survey asked respondents whether they considered themselves to be 1. Democrat 2. Independent 3. Republi
> To help determine the need for more golf courses, a survey was undertaken. A sample of 75 self-declared golfers was asked how many rounds of golf they played last year. Draw a histogram and describe what it tells you.
> In addition to asking American adults whether they support keeping the Affordable Care Act the Gallup poll determined whether the respondents were 1. Democrats or 2. Republicans. Determine whether Democrats and Republicans differ in their support of the
> In Exercise 2.35 a Gallup survey asked American adults whether they believed that upperincome people are paying their fair share in federal taxes. Each respondent was also classified as 1. Conservative 2. Moderate 3. Liberal Present a graphical method to
> Exercise 2.34 presented the data from a Pew Research Center survey of American adults describing whether their friends share their political views. Also recorded were the political views of the respondents. The responses are as follows: 1. Consistent co
> Residents of condominiums were recently surveyed and asked a series of questions. Identify the type of data for each question. a. What is your age? b. On what floor is your condominium? c. Do you own or rent? d. How large is your condominium (in square f
> Also recorded was the gender (1 = male, 2 = female) of the respondents. Use a graphical technique to determine whether the choice of light beers differs between genders. Refer to Exercise 2.33. 1. Bud Light 2. Busch Light 3. Coors Light 4. Michelob Light
> In 2010, the total number of prescriptions sold in the United States was 3,676,000 (Source: National Association of Drug Store Chains). The sales manager of a chain of drug stores wanted to determine whether changes in where the prescriptions were filled
> There are 62 million Americans who speak a language other than English at home. The languages are Spanish, Chinese Tagalog (Philippines language), Vietnamese, French, Korean, and others. Suppose that one of these individuals is selected at random. Use se
> In 2009 there were 8,626,000 men and 6,199,000 women who were unemployed at some time during the year. A statistics practitioner wanted to investigate the reason for that unemployment status and whether the reasons differed by gender. A random sample of
> After an analysis of incoming faxes, the manager of an accounting firm determined the probability distribution of the number of pages per facsimile as follows: Compute the mean and variance of the number of pages per fax. 1 3 4 5 7 P(x) .05 .12 20 .
> Is there brand loyalty among car owners in their purchases of gasoline? To help answer the question a random sample of car owners was asked to record the brand of gasoline in their last two purchases (1 = Exxon, 2 = Amoco, 3 = Texaco, and 4 = Other). Use
> The associate dean of a business school was looking for ways to improve the quality of the applicants to its MBA program. In particular she wanted to know whether the undergraduate degree of applicants differed among her school and the three nearby unive
> The average loss from robbery in the United States in 2014 (last year available) was $1,227. Suppose that an insurance analyst wanted to know whether the type of robbery differs in the years 1995, 2000, 2005, 2009, and 2014. A random sample of robbery re
> A survey of 50 baseball fans to report the number of games they attended last year. Draw a histogram and describe its shape.
> How do governments spend the tax dollars they collect, and has this changed over the past decade? The following table displays state and local government expenditures for public works in years 1995, 2000, 2005, and 2008 in millions of dollars. Use a grap
> Gallup Organization Date: May 2016 Population: American adults Question: “Describe your views on economic issues.” Responses: 1. Liberal 2. Moderate 3. Conservative a. Determine the frequency and the relative frequency distributions. b. Draw a pie chart
> The placement office at a university regularly surveys the graduates 1 year after graduation and asks for the following information. For each, determine the type of data. a. What is your occupation? b. What is your income? c. What degree did you obtain?
> Gallup Organization Date: May 2016 Population: American adults Question: “Describe your views on social issues.” Responses: 1. Liberal 2. Moderate 3. Conservative a. Determine the frequency and the relative frequency distributions. b. Draw a pie chart an
> Refer to Exercises 6.13 and 6.14. Find the probability of each of the following events. a. The adult is single. b. The adult is not divorced c. The adult is either widowed or divorced. Data from Exercise 6.14: Suppose that in the city in which the survey
> Pew Research Center Date: November 2015 Population: Married, two-parent households with at least one child under 18 Question: How do working parents share the work load at home? Responses: 1. Mom: Full time; Dad: Full time 2. Mom: Part time; Dad: Full ti
> It cost one dollar to buy a lottery ticket, which has five prizes. The prizes and the probability that a player wins the prize are listed here. Calculate the expected value of the payoff. Prize ($) 1 million 200,000 Probability 1/10 million 1/1 milli
> Pew Research Center Date: December 2015 Population: American adults Question 1: “Which Social Class does the Republican Party favor?” Question 2: “Which Social Class does the Democratic Party favor?” (Each question was posed to a different sample.) Respo
> Gallup Organization Date: April 2016 Population: American adults Question: “As I read off some different groups, please tell me if you think they are paying their FAIR share in federal taxes, paying too MUCH or paying too LITTLE? First, how about upperin
> Pew Research Center Date: June 2015 Population: Americans who are most likely to vote, donate to campaigns, and participate directly in politics. (They comprise about 20% of all Americans.) Question: Views of their close friends. Responses: 1. Many close
> Increasing tuition has resulted in some students being saddled with large debts upon graduation. To examine this issue, a random sample of recent graduates was asked to report whether they had student loans, and, if so, how much was the debt at graduatio
> Chris Golfnut loves the game of golf. Chris also loves statistics. Combining both passions, Chris records a sample of 100 scores. a. What statistics should Chris compute to describe the scores? b. Calculate the mean and standard deviation of the scores.
> A survey of 60 individuals leaving a mall asked how many stores they entered during this visit to the mall. The figures are listed here. 3 2 4 3 3 9 2 4 3 6 2 2 8 7 6 4 5 1 5 2 3 1 1 7 3 4 1 1 4 8 0 2 5 4 4 4 6 2 2 5 3 8 4
> Refer to Exercise 4.139. In addition to the bone density losses, the ages of the women were also recorded. Compute the coefficient of determination and describe what this statistic tells you. Data from Exercise 4.139: Osteoporosis is a condition in which
> The temperature in December in Buffalo, New York, is often below 40 degrees Fahrenheit (4 degrees Celsius). Not surprisingly, when the National Football League Buffalo Bills play at home in December, coffee is a popular item at the concession stand. The
> Refer to Exercise 6.13. Suppose that in the city in which the survey is conducted, 50% of adults are married, 15% are single, 25% are divorced, and 10% are widowed. a. Assign probabilities to each simple event in the sample space. b. Which approach did y
> Osteoporosis is a condition in which bone density decreases, often resulting in broken bones. Bone density usually peaks at age 30 and decreases thereafter. To understand more about the condition, a random sample of women aged 50 years and over was recru
> The owner of a small firm has just purchased a personal computer, which she expects will serve her for the next 2 years. The owner has been told that she “must” buy a surge suppressor to provide protection for her new hardware against possible surges or
> Refer to Exercise 4.74. Draw histograms of the data. What have you learned? Data from Exercisem 4.74: For many restaurants, the amount of time customers linger over coffee and dessert negatively affects profits. To learn more about this variable, a sampl
> In Exercise 4.71 you calculated quartiles. Draw histograms instead and compare the results. Data from Exercise 4.71: The career-counseling center at a university wanted to learn more about the starting salaries of the university’s graduates. They asked e
> a. Calculate the coefficients of the least squares line for the data in Example 3.7. b. Interpret the coefficients. c. Is this information more useful than the information extracted from the scatter diagram? Analyzing the Relationship between Price a
> Refer to Exercise 3.67. Calculate the coefficient of determination and the least squares line. Is this more informative than the scatter diagram? Data from Exercise 3.67: A very large contribution to profits for a movie theater is the sales of popcorn, s
> How many classes should a histogram contain if the number of observations is 125?
> Refer to Exercise 3.59. Compute the coefficients of the least squares line and compare your results with the scatter diagram. Data from Exercise 3.59: Speed 4 6 8 10 12 Kost 88 124 358 519 699 816 Speed 14 16 18 20 Cost 905 1,521 1,888 2,201 2.
> We calculated the returns on the NASDAQ Index and the following selected stocks on the NASDAQ Exchange for the period January 2011–December 2015. Adobe Systems (ADBE), Intel (INTC), and Microsoft (MSFT) Calculate the beta coefficient and the coefficient
> We calculated the returns on the NASDAQ Index and the following selected stocks on the NASDAQ Exchange for the period January 2011–December 2015. Costco Wholesale (COST), Dollar Tree (DLTR), and Staples (SPLS) Calculate the beta coefficient and the coeff
> A survey asks adults to report their marital status. The sample space is S = 5single, married, divorced, widowed6 Use set notation to represent the event the adult is not married.
> The manager of a bookstore recorded the number of customers who arrive at a checkout counter every 5 minutes from which the following distribution was calculated. Calculate the mean and standard deviation of the random variable. 1 2 3 4 P(x) .10 .20
> We calculated the returns on the NASDAQ Index and the following selected stocks on the NASDAQ Exchange for the period January 2011–December 2015. Apple (AAPL), Cisco Systems (CSCO), and Oracle (ORCL) Calculate the beta coefficient and the coefficient of
> We calculated the returns on the NASDAQ Index and the following selected stocks on the NASDAQ Exchange for the period January 2011–December 2015. Netflix (NFLX) Determine the average beta coefficient for the stocks in the listed portfolio. Calculate the
> We calculated the returns on the NASDAQ Index and the following selected stocks on the NASDAQ Exchange for the period January 2011–December 2015. Expedia (EXPE) Calculate the beta coefficient and the coefficient of determination for the listed stock and
> We calculated the returns on the NASDAQ Index and the following selected stocks on the NASDAQ Exchange for the period January 2011–December 2015. Amazon (AMZN) Calculate the beta coefficient and the coefficient of determination for the listed stock and i
> Refer to Exercise 6.124. Suppose the student informs the professor that he can see only one coin and it shows tails. What is the probability that the other coin is also tails? Data from Exercise 6.124: In a class on probability, a statistics professor fl
> In a class on probability, a statistics professor flips two balanced coins. Both fall to the floor and roll under his desk. A student in the first row informs the professor that he can see both coins. He reports that at least one of them shows tails. Wha
> A union’s executive conducted a survey of its members to determine what the membership felt were the important issues to be resolved during upcoming negotiations with management. The results indicate that 74% of members felt that job security was an impo
> A statistics professor and his wife are planning to take a 2-week vacation in Hawaii, but they can’t decide whether to spend 1 week on each of the islands of Maui and Oahu, 2 weeks on Maui, or 2 weeks on Oahu. Placing their faith in random chance, they i
> A safety expert wants to determine the proportion of cars in his state with worn tire treads. The state license plate contains six digits. Use Excel to generate a sample of 20 cars to be examined.
> How does level of affluence affect health care? To address one dimension of the problem, a group of heart attack victims was selected. Each was categorized as a low-, medium-, or high-income earner. Each was also categorized as having survived or died. A
> You have been given the choice of receiving $500 in cash or receiving a gold coin that has a face value of $100. However, the actual value of the gold coin depends on its gold content. You are told that the coin has a 40% probability of being worth $400,
> A customer-service supervisor regularly conducts a survey of customer satisfaction. The results of the latest survey indicate that 8% of customers were not satisfied with the service they received at their last visit to the store. Of those who are not sa
> Casino Windsor conducts surveys to determine the opinions of its customers. Among other questions, respondents are asked to give their opinion about “Your overall impression of Casino Windsor.” The responses are Excell
> In Canada, criminals are entitled to parole after serving only one-third of their sentence. Virtually all prisoners, with several exceptions including murderers, are released after serving two-thirds of their sentence. The government has proposed a new l
> A statistics professor believes that there is a relationship between the number of missed classes and the grade on his midterm test. After examining his records, he produced the following table of joint probabilities. a. What is the pass rate on the mid
> A telemarketer sells magazine subscriptions over the telephone. The probability of a busy signal or no answer is 65%. If the telemarketer does make contact, the probability of 0, 1, 2, or 3 magazine subscriptions is .5, .25, .20, and .05, respectively. F
> In a four-cylinder engine there are four spark plugs. If any one of them malfunctions, the car will idle roughly and power will be lost. Suppose that for a certain brand of spark plugs the probability that a spark plug will function properly after 5,000
> Refer to Exercise 6.111. Suppose that you are told that the drug is effective. What is the probability that the drug taker is a man? Data from Exercise 6.111: The effect of an antidepressant drug varies from person to person. Suppose that the drug is eff
> Laser surgery to fix shortsightedness is becoming more popular. However, for some people, a second procedure is necessary. The following table lists the joint probabilities of needing a second procedure and whether the patient has a corrective lens with
> Shoppers can pay for their purchases with cash, a credit card, or a debit card. Suppose that the proprietor of a shop determines that 60% of her customers use a credit card, 30% pay with cash, and the rest use a debit card. a. Determine the sample space
> The following table lists the joint probabilities of achieving grades of A and not achieving A’s in two MBA courses. a. What is the probability that a student achieves a grade of A in marketing? b. What is the probability that a studen
> Refer to Exercise 7.32. The cost of parking is $2.50 per hour. Calculate the mean and standard deviation of the amount of revenue each car generates. Data from Exercise 7.32: When parking a car in a downtown parking lot, drivers pay according to the numb
> Refer to Exercise 6.83. A respondent who said that the U.K. leaving the EU is a bad thing was selected. What is the probability that the respondent is from Italy? Data from Exercise 6.83: In June 2016, Britons were heading to the polls to vote in a refer
> What are the sensitivity, specificity, positive predictive value, and negative predictive value in the previous exercise?
> Refer to Exercise 6.9. Suppose that you believe that contractor 1 is twice as likely to win as contractor 3 and that contractor 2 is three times as likely to win as contactor 3. What are the probabilities of winning for each contractor? Data from Exercis
> The weather forecaster reports that the probability of rain tomorrow is 10%. a. Which approach was used to arrive at this number? b. How do you interpret the probability?
> Carbon monoxide (CO) in the home is caused by faulty furnaces burning natural gas or heating oil. Concentrations above 35 parts per million (ppm) is considered dangerous. Suppose that a municipal home inspector randomly samples 180 houses around the city
> A professional income tax preparer recorded the amount of tax rebate and the total taxable amount of a sample of 80 customers. Compute whichever statistics you need to determine whether tax rebates increase as the taxable income increases.
> To determine the relationship between age of cars and annual repair costs a random sample of car owners was drawn and the two variables were recorded. Calculate statistics to determine whether cost of repairs increase as the car ages and on average what
> Refer to Exercise 4.95. In another survey by the Bureau of Labor Statistics respondents who reported that they rent their dwelling were asked their age and how much they spend annually on rent. Use a statistical analysis to determine whether the data ind
> The U.S. Census Bureau in conjunction with the Bureau of Labor Statistics conducts surveys that record a wide variety of subjects. In the Consumer Expenditure Survey of 2014–2015 respondents were asked their age and the amount of money spent in the previ
> A manufacturer has recorded its cost of electricity and the total number of hours of machine time for each of 52 weeks. Estimate the fixed and variable electricity costs.
> When parking a car in a downtown parking lot, drivers pay according to the number of hours or parts thereof. The probability distribution of the number of hours cars are parked has been estimated as follows. Find the mean and standard deviation of the n
> A manufacturing firm produces its products in batches using sophisticated machines and equipment. The general manager wanted to investigate the relationship between direct labor costs and the number of units produced per batch. He recorded the data from
> One way of measuring the extent of unemployment is through the help wanted index, which measures the number of want ads in the nation’s newspapers. The higher the index, the greater is the demand for workers. Another measure is the unemployment rate amon
> When the price of crude oil increases, do oil companies drill more oil wells? To determine the strength and nature of the relationship, an economist recorded the price of a barrel of domestic crude oil (West Texas crude) and the number of exploratory oil
> A real estate developer of single-family dwellings across the country is in the process of developing plans for the next several years. An analyst for the company believes that interest rates are likely to increase but remain at low levels. To to build,
> A regular feature in a newspaper asks readers to respond via e-mail to a survey that requires a yes or no response. In the following day’s newspaper, the percentage of yes and no responses are reported.Discuss why we should ignore these statistics.
> All Canadians have government-funded health insurance, which pays for any medical care they require. However, when traveling out of the country, Canadians usually acquire supplementary health insurance to cover the difference between the costs incurred f
> The unemployment rate is an important measure of a country’s economic health. The unemployment rate measures the percentage of people who are looking for work and who are without jobs. Unfortunately, it can be a misleading statistic bec
> Students who apply to MBA programs must take the Graduate Management Admission Test (GMAT). University admissions committees use the GMAT score as one of the critical indicators of how well a student is likely to perform in the MBA program. However, the
> Are the marks one receives in a course related to the amount of time spent studying the subject? To investigate this mysterious possibility, a student took a random sample of 10 students who had enrolled in an accounting class last semester. He asked eac
> A retailer wanted to estimate the monthly fixed and variable selling expenses. As a first step, she collected data from the past 8 months. The total selling expenses ($1,000) and the total sales ($1,000) were recorded and are listed below. Total Sales
> Refer to Exercise 7.30. Suppose that, on average, customers spend 10 minutes in each store they enter. Find the mean and standard deviation of the total amount of time customers spend in stores. Data from Exercise 7.30: A shopping mall estimates the prob
> Refer to Exercise 4.83. You’ve now learned that the two sample standard deviations are 16 and 12. a. Calculate the coefficient of correlation. What does this statistic tell you about the relationship between the two variables? b. Calculate the coefficie
> The covariance of two variables has been calculated to be −150. What does the statistic tell you about the two variables?
> To determine premiums for automobile insurance, companies must have an understanding of the variables that affect whether a driver will have an accident. The age of the driver may top the list of variables. The following table lists the number of drivers

