Question: Consider the data of Table 17.1.
Consider the data of Table 17.1. Suppose that additional samples of size 5 are taken and tensile strength recorded. The sampling produces the following results (in pounds per square inch).
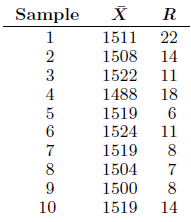
(a) Plot the data, using the ¯X - and R-charts for the preliminary data of Table 17.1.
(b) Does the process appear to be in control? If not, explain why.
Transcribed Image Text:
Sample R 1 1511 22 14 2 1508 3 1522 11 4 1488 18 5 1519 1524 11 1519 8 8 1504 7 9 1500 8 10 1519 14
> A carbon dioxide (CO2) flooding technique is used to extract crude oil. The CO2 floods oil pockets and displaces the crude oil. In an experiment, flow tubes are dipped into sample oil pockets containing a known amount of oil. Using three different values
> Consider the data of Review Exercise 12.64. Suppose it is of interest to add some “interaction” terms. Namely, consider the model yi = β0 + β1x1i + β2x2i + β3x3i + Î
> In exercise physiology, an objective measure of aerobic fitness is the oxygen consumption in volume per unit body weight per unit time. Thirty-one individuals were used in an experiment in order to be able to model oxygen consumption against age in years
> In a chemical engineering experiment dealing with heat transfer in a shallow fluidized bed, data are collected on the following four regressor variables: fluidizing gas flow rate, lb/hr (x1); supernatant gas flow rate, lb/hr (x2); supernatant gas inlet n
> A small experiment was conducted to fit a multiple regression equation relating the yield y to temperature x1, reaction time x2, and concentration of one of the reactants x3. Two levels of each variable were chosen, and measurements corresponding to the
> Show that, in a multiple linear regression data set, hi =p. 2=1
> In the Department of Fisheries and Wildlife at Virginia Tech, an experiment was conducted to study the effect of stream characteristics on fish biomass. The regressor variables are as follows: average depth (of 50 cells), x1; area of in-stream cover (i.e
> In an experiment to ascertain the effect of load, x, in lb/inches2, on the probability of failure of specimens of a certain fabric type, an experiment was conducted in which numbers of specimens were exposed to loads ranging from 5 lb/in.2 to 90 lb/in.2.
> From a set of streptonignic dose-response data, an experimenter desires to develop a relationship between the proportion of lymphoblasts sampled that contain aberrations and the dosage of streptonignic. Five dosage levels were applied to the rabbits used
> The developer of a new condominium complex claims that 3 out of 5 buyers will prefer a two-bedroom unit, while his banker claims that it would be more correct to say that 7 out of 10 buyers will prefer a two bedroom unit. In previous predictions of this
> In Exercise 12.28, page 462, we have the following data concerning wear of a bearing: (a) The following model may be considered to describe the data: yi = β0 + β1x1i + β2x2i + β12x1ix2i + i, for i = 1, 2,
> For Exercise 12.57, test H0: β1 = β6 = 0. Give P-values and comment. Exercise 12.57: The pull strength of a wire bond is an important characteristic. The following data give information on pull strength y, die height x1, post he
> The pull strength of a wire bond is an important characteristic. The following data give information on pull strength y, die height x1, post height x2, loop height x3, wire length x4, bond width on the die x5, and bond width on the post x6. (From Myers,
> In an effort to model executive compensation for the year 1979, 33 firms were selected, and data were gathered on compensation, sales, profits, and employment. The following data were gathered for the year 1979. Consider the model yi = β0
> For the randomized block design with k treatments and b blocks, show that b. E(SSB) = (b – 1)o² + k B3. j=1
> Show that the computing formula for SSB, in the analysis of variance of the randomized complete block design, is equivalent to the corresponding term in the identity of Theorem 13.3.
> Prove Theorem 13.2.
> Show that the mean square error for the analysis of variance in a one-way classification is an unbiased estimate of σ2. SSE k(n – 1)
> Four different locations in the northeast were used for collecting ozone measurements in parts per million. Amounts of ozone were collected in 5 samples at each location. (a) Is there sufficient information here to suggest that there are differences i
> A study is conducted to compare gas mileage for 3 competing brands of gasoline. Four different automobile models of varying size are randomly selected. The data, in miles per gallon, follow. The order of testing is random for each model. (a) Discuss th
> A previous study indicates that the percentage of chain smokers, p, who have lung cancer follows a beta distribution (see Section 6.8) with mean 70% and standard deviation 10%. Suppose a new data set collected shows that 81 out of 120 chain smokers have
> A company that stamps gaskets out of sheets of rubber, plastic, and cork wants to compare the mean number of gaskets produced per hour for the three types of material. Two randomly selected stamping machines are chosen as blocks. The data represent the n
> An experiment was conducted to compare three types of paint for evidence of differences in their wearing qualities. They were exposed to abrasive action and the time in hours until abrasion was noticed was observed. Six specimens were used for each type
> In a study that was analyzed for personnel in the Department of Biochemistry at Virginia Tech, three diets were given to groups of rats in order to study the effect of each on dietary residual zinc in the bloodstream. Five pregnant rats were randomly ass
> Consider a design which is a 23−1 III with 2 center runs. Consider ¯yf as the average response at the design parameter and ¯y0 as the average response at the design center. Suppose the true regression model is E(Y ) = β0 + β1x1 + β2x2 + β3x3 + β11x21+ β2
> Construct a design that contains 9 design points, is orthogonal, contains 12 total runs and 3 degrees of freedom for replication error, and allows for a lack-of-fit test for pure quadratic curvature.
> Verify that your design in Review Exercise 15.43 is indeed resolution IV. Exercise 15.43: Use Table 15.16 to construct a 16-run design with 8 factors that is resolution IV. Table 15.16: Table 15.16: Some Resolution III, IV, V, VI and VII 2k-P Desi
> Use Table 15.16 to construct a 16-run design with 8 factors that is resolution IV. Table 15.16: Table 15.16: Some Resolution III, IV, V, VI and VII 2k-P Designs Number of Number of Factors Design Points Generators 23-1 2III C = ±AB D = ±ABC D = ±AB
> In the study “The Use of Regression Analysis for Correcting Matrix Effects in the X-Ray Fluorescence Analysis of Pyrotechnic Compositions,” published in the Proceedings of the Tenth Conference on the Design of Experime
> Use the data from Exercise 13.14 on page 530 to see if the median amount of nitrogen lost in perspiration is different for the three levels of dietary protein. Exercise 13.14: The study Loss of Nitrogen Through Sweat by Preadolescent Boys Consuming Thre
> In Review Exercise 13.45 on page 555, use the Kruskal-Wallis test, at the 0.05 level of significance, to determine if the chemical analyses performed by the four laboratories give, on average, the same results. Exercise 13.45: Four laboratories are bein
> Service calls come to a maintenance center according to a Poisson process with λ calls per minute. A data set of 20 one-minute periods yields an average of 1.8 calls. If the prior for λ follows an exponential distribution with mean 2, determine the poste
> A study by a chemical company compared the drainage properties of two different polymers. Ten different sludges were used, and both polymers were allowed to drain in each sludge. The free drainage was measured in mL/min. (a) Use the sign test at the 0.
> In the article called “Risky Assumptions” by Paul Slovic, Baruch Fischoff, and Sarah Lichtenstein, published in Psychology Today (June 1980), the risk of dying in the United States from 30 activities and technologies is ranked by members of the League of
> Two judges at a college homecoming parade rank eight floats in the following order: (a) Calculate the rank correlation coefficient. (b) Test the null hypothesis that ρ = 0 against the alternative that ρ > 0. Use α
> A consumer panel tests nine brands of microwave ovens for overall quality. The ranks assigned by the panel and the suggested retail prices are as follows: Is there a significant relationship between the quality and the price of a microwave oven? Use a
> With reference to the weights and chest sizes of infants in Exercise 11.47 on page 436, (a) calculate the rank correlation coefficient; (b) test the hypothesis, at the 0.025 level of significance, that ρ = 0 against the alternative that Ï
> Calculate the rank correlation coefficient for the daily rainfall and amount of particulate removed in Exercise 11.13 on page 400. Exercise 11.13: A study of the amount of rainfall and the quantity of air pollution removed produced the following data:
> With reference to the data of Exercise 11.1 on page 398, (a) calculate the rank correlation coefficient; (b) test the null hypothesis, at the 0.05 level of significance, that ρ = 0 against the alternative that ρ = 0. Compare your r
> The following table gives the recorded grades for 10 students on a midterm test and the final examination in a calculus course: (a) Calculate the rank correlation coefficient. (b) Test the null hypothesis that ρ = 0 against the alternative t
> What is the probability that at least 95% of a population will exceed the smallest value in a random sample of size n = 135?
> How large a sample is required to be 99% confident that at least 80% of the population will be less than the largest observation in the sample?
> Repeat Exercise 18.2 when 1 of the next 4 drinks overflows and the uniform prior distribution is π(p) = 10, 0.05 < p < 0.15. Exercise 18.2: Let us assume that the prior distribution for the proportion p of drinks from a vending machine that overflow is
> What is the probability that the range of a random sample of size 24 includes at least 90% of the population?
> For the situation of Review Exercise 17.8, suppose that additional data are collected as follows: Does the process appear to be in control? Explain. Exercise 17.8: Samples of size 50 are taken every hour from a process producing a certain type of item
> Samples of size 50 are taken every hour from a process producing a certain type of item that is considered either defective or not defective. Twenty samples are taken. (a) Construct a control chart for control of proportion defective. (b) Does the proces
> How large a sample is required to be 95% confident that at least 85% of the distribution of measurements is included between the sample extremes?
> Consider the situation of Example 17.2. The following data are taken on additional samples of size 5. Plot the ¯X - and S-values on the ¯X - and S-charts that were produced with the data in the preliminary sample. Does the process
> Consider an in-control process with mean μ = 25 and σ = 1.0. Suppose that subgroups of size 5 are used with control limits μ ± 3σ/ √ n, and centerline at μ. Suppose that a shift occurs in the mean, and the new mean is μ = 26.5. (a) What is the average nu
> For the situation of Review Exercise 17.2, give numerical estimates of the mean and standard deviation of the diameter for the part being manufactured in the process. Exercise 17.2: Consider the following data taken on subgroups of size 5. The data cont
> Suppose for Review Exercise 17.2 that the buyer has set specifications for the part. The specifications require that the diameter fall in the range covered by 2.40000 ± 0.0100 mm. What proportion of units produced by this process will not c
> Consider the following data taken on subgroups of size 5. The data contain 20 averages and ranges on the diameter (in millimeters) of an important component part of an engine. Display ¯X- and R-charts. Does the process appear to be in control
> A cigarette manufacturer claims that the tar content of brand B cigarettes is lower than that of brand A cigarettes. To test this claim, the following determinations of tar content, in milligrams, were recorded: Use the rank-sum test with Î&plusm
> Rework Exercise 16.6 by using the signed-rank test. Exercise 16.6: Two types of instruments for measuring the amount of sulfur monoxide in the atmosphere are being compared in an air-pollution experiment. The following readings were recorded daily for a
> Rework Exercise 16.7 by using the signed-rank test. Exercise 16.7: The following figures give the systolic blood pressure of 16 joggers before and after an 8-kilometer run: Use the sign test at the 0.05 level of significance to test the null hypothesi
> The following are the numbers of prescriptions filled by two pharmacies over a 20-day period: Use the signed-rank test at the 0.01 level of significance to determine whether the two pharmacies, on average, fill the same number of prescriptions against
> Assuming that the measurements of Exercise 1.14 on page 30 were recorded successively from left to right as they were collected, use the runs test, with α = 0.05, to test the hypothesis that the data represent a random sequence. Exercise 1.14: A tire ma
> Rework Exercise 16.5 by using the signed-rank test. Exercise 16.5: It is claimed that a new diet will reduce a person’s weight by 4.5 kilograms, on average, in a period of 2 weeks. The weights of 10 women were recorded before and after
> A quality control effort is being undertaken for a process where large steel plates are manufactured and surface defects are of concern. The goal is to set up a quality control chart for the number of defects per plate. The data are given below. Set up t
> Consider X1,X2, . . . , Xn independent Poisson random variables with parameters μ1, μ2, . . . , μn. Use the properties of moment-generating functions to show that the random variable / is a Poisson random varia
> Analyze the data of Exercise 16.2 by using the signed-rank test. Exercise 16.2: The following data represent the number of hours of flight training received by 18 student pilots from a certain instructor prior to their first solo flight: Using binomia
> Analyze the data of Exercise 16.1 by using the signed-rank test. Exercise 16.1: The following data represent the time, in minutes, that a patient has to wait during 12 visits to a doctor’s office before being seen by the doctor: Use
> The following figures give the systolic blood pressure of 16 joggers before and after an 8-kilometer run: Use the sign test at the 0.05 level of significance to test the null hypothesis that jogging 8 kilometers increases the median systolic blood pres
> Two types of instruments for measuring the amount of sulfur monoxide in the atmosphere are being compared in an air-pollution experiment. The following readings were recorded daily for a period of 2 weeks: Using the normal approximation to the binomial
> It is claimed that a new diet will reduce a person’s weight by 4.5 kilograms, on average, in a period of 2 weeks. The weights of 10 women were recorded before and after a 2-week period during which they followed this diet, yielding the
> A paint supplier claims that a new additive will reduce the drying time of its acrylic paint. To test this claim, 12 panels of wood were painted, one-half of each panel with paint containing the regular additive and the other half with paint containing t
> A food inspector examined 16 jars of a certain brand of jam to determine the percent of foreign impurities. The following data were recorded: Using the normal approximation to the binomial distribution, perform a sign test at the 0.05 level of signific
> In an industrial production line, items are inspected periodically for defectives. The following is a sequence of defective items, D, and nondefective items, N, produced by this production line: D D N N N D N N D D N N N N N D D D N N D N N N N D N D Use
> The following data represent the number of hours of flight training received by 18 student pilots from a certain instructor prior to their first solo flight: Using binomial probabilities from Table A.1, perform a sign test at the 0.02 level of signific
> The weights of 5 people before they stopped smoking and 5 weeks after they stopped smoking, in kilograms, are as follows: Use the signed-rank test for paired observations to test the hypothesis, at the 0.05 level of significance, that giving up smoking
> The following data represent the time, in minutes, that a patient has to wait during 12 visits to a doctor’s office before being seen by the doctor: Use the sign test at the 0.05 level of significance to test the doctorâ€&#
> Consider Exercise 15.6. Use a +1 and −1 scaling for “high” and “low,” respectively, and do a multiple linear regression with the model Yi = β0 + Î
> Consider Exercise 15.3 once again. Three-factor interactions are often not significant, and even if they are, they are difficult to interpret. The interaction ABD appears to be important. To gain some sense of interpretation, show two AD interaction plot
> Consider Exercise 15.3. It is of interest to the researcher to learn not only that AD, BC, and possibly AB are important, but also what they mean scientifically. Show two-dimensional interaction plots for all three and give an interpretation. Exercise 1
> It is important to study the effect of the concentration of the reactant and the feed rate on the viscosity of the product from a chemical process. Let the reactant concentration be factor A, at levels 15% and 25%. Let the feed rate be factor B, with lev
> In the study An X-Ray Fluorescence Method for Analyzing Polybutadiene-Acrylic Acid (PBAA) Propellants (Quarterly Reports, RK-TR-62-1, Army Ordnance Missile Command), an experiment was conducted to determine whether or not there was a significant differen
> A 22 factorial experiment is analyzed by the Statistics Consulting Center at Virginia Tech. The client is a member of the Department of Housing, Interior Design, and Resource Management. The client is interested in comparing cold start to preheating oven
> A large petroleum company in the Southwest regularly conducts experiments to test additives to drilling fluids. Plastic viscosity is a rheological measure reflecting the thickness of the fluid. Various polymers are added to the fluid to increase viscosit
> Use the runs test to test, at level 0.01, whether there is a difference in the average operating time for the two calculators of Exercise 16.17 on page 670. Exercise 16.17: The following data represent the number of hours that two different types of sci
> A preliminary experiment is conducted to study the effects of four factors and their interactions on the output of a certain machining operation. Two runs are made at each of the treatment combinations in order to supply a measure of pure experimental er
> A Plackett-Burman design was used to study the rheological properties of high-molecular-weight copolymers. Two levels of each of six variables were fixed in the experiment. The viscosity of the polymer is the response. The data were analyzed by the Stati
> Construct a Plackett-Burman design for 10 variables containing 24 experimental runs.
> Consider the 1/16 of the 27 factorial discussed in Section 15.9. List the additional 11 defining contrasts.
> A 25 factorial plan is used to build a regression model containing first-order coefficients and model terms for all two-factor interactions. Duplicate runs are made for each factor. Outline the analysis-of-variance table, showing degrees of freedom for r
> Use the coal cleansing data of Exercise 15.2 on page 609 to fit a model of the type E(Y ) = β0 + β1x1 + β2x2 + β3x3, where the levels are x1, percent solids: 8, 12 x2, flow rate: 150, 250 gal/min x3, pH:
> In Case Study 15.2 involving the coal cleansing data, the percent solids in the process system is known to vary uncontrollably during the process and is viewed as a noise factor with mean 0 and varianceσ2z . The response, cleansing efficiency,
> Consider Case Study 15.1 involving the injection molding data. Suppose mold temperature is difficult to control and thus it can be assumed that in the process it follows a normal distribution with mean 0 and variance σ2z. Of concern is the var
> Consider the following 23 factorial with control variables x1 and x2 and noise variable z. Can x1 and x2 be chosen at levels for which Var(y) is minimized? Explain why or why not.
> Consider an example in which there are two control variables x1 and x2 and a single noise variable z. The goal is to determine the levels of x1 and x2 that are robust to changes in z, i.e., levels of x1 and x2 that minimize the variance produced in the r
> A silver-plating process is used to coat a certain type of serving tray. When the process is in control, the thickness of the silver on the trays will vary randomly following a normal distribution with a mean of 0.02 millimeter and a standard deviation o
> In Myers, Montgomery, and Anderson-Cook (2009), an application is discussed in which an engineer is concerned with the effects on the cracking of a titanium alloy. The three factors are A, temperature; B, titanium content; and C, amount of grain refiner.
> In a metallurgy experiment, it is desired to test the effect of four factors and their interactions on the concentration (percent by weight) of a particular phosphorus compound in casting material. The variables are A, percent phosphorus in the refinemen
> For Exercise 15.27, give all aliases for the six main effects. Exercise 15.27: There are six factors and only eight design points can be used. Construct a 26−3 by beginning with a 23 and use D = AB, E = −AC, and F = BC as the generators.
> Consider Exercise 15.27. Construct another 26−3 that is different from the design chosen in Exercise 15.27. Exercise 15.27: There are six factors and only eight design points can be used. Construct a 26−3 by beginning with a 23 and use D = AB, E = −AC,
> There are six factors and only eight design points can be used. Construct a 26−3 by beginning with a 23 and use D = AB, E = −AC, and F = BC as the generators.
> Consider a 25−1 design with factors A, B, C, D, and E. Construct the design by beginning with a 24 and use E = ABCD as the generator. Show all aliases.
> In the study Durability of Rubber to Steel Adhesively Bonded Joints, conducted at the Department of Environmental Science and Mechanics and analyzed by the Statistics Consulting Center at Virginia Tech, an experimenter measured the number of breakdowns i
> In an experiment conducted at the Department of Mechanical Engineering and analyzed by the Statistics Consulting Center at Virginia Tech, a sensor detects an electrical charge each time a turbine blade makes one rotation. The sensor then measures the amp
> An experiment is conducted so that an engineer can gain insight into the influence of sealing temperature A, cooling bar temperature B, percent polyethylene additive C, and pressure D on the seal strength (in grams per inch) of a bread-wrapper stock. A 1
> Seven factors are varied at two levels in an experiment involving only 16 trials. A 1/8 fraction of a 27 factorial experiment is used, with the defining contrasts being ACD, BEF, and CEG. The data are as follows: Perform an analysis of variance on all

