Question: Contain graphs portraying the decision criterion
Contain graphs portraying the decision criterion for a one-mean z-test. The curve in each graph is the normal curve for the test statistic under the assumption that the null hypothesis is true. For each exercise, determine the:
a. rejection region.
b. nonrejection region.
c. critical value(s).
d. significance level.
e. Construct a graph similar to that in Fig. 9.3 on page 361 that depicts your results from parts (a)–(d).
f. Identify the hypothesis test as two tailed, left tailed, or right tailed.
> We have provided a sample mean, sample size, and population standard deviation. In each case, use the one-mean z-test to perform the required hypothesis test at the 5% significance level. x = 20, n = 32, σ = 4, H0: μ = 22, Ha: μ < 22
> have provided a scenario for a hypothesis test for a population mean. Decide whether the z-test is an appropriate method for conducting the hypothesis test. Assume that the population standard deviation is known in each case. Preliminary data analyses re
> have provided a scenario for a hypothesis test for a population mean. Decide whether the z-test is an appropriate method for conducting the hypothesis test. Assume that the population standard deviation is known in each case. Preliminary data analyses re
> have provided a scenario for a hypothesis test for a population mean. Decide whether the z-test is an appropriate method for conducting the hypothesis test. Assume that the population standard deviation is known in each case. A normal probability plot of
> have provided a scenario for a hypothesis test for a population mean. Decide whether the z-test is an appropriate method for conducting the hypothesis test. Assume that the population standard deviation is known in each case. Preliminary data analyses re
> Explain why considering outliers is important when you are conducting a one-mean z-test.
> We have drawn a smooth curve that represents a distribution. In each case, do the following: a. Identify the shape of the distribution with regard to modality. b. Identify the shape of the distribution with regard to symmetry (or non-symmetry). c. If the
> Let x denote the test statistic for a hypothesis test and x0 its observed value. Then the P-value of the hypothesis test equals a. P(x ≥ x0) for a right-tailed test, b. P(x ≤ x0) for a left-tailed test, c. 2 · min{P(x ≤ x0), P(x ≥ x0)} for a two-tailed t
> The symbol(z) is often used to denote the area under the standard normal curve that lies to the left of a specified value of z. Consider a one-mean z-test. Denote z0 as the observed value of the test statistic z. Express the P-value of the hypothesis tes
> Suppose that, in a hypothesis test, the null hypothesis is in fact false. a. Is it possible to make a Type I error? Explain your answer. b. Is it possible to make a Type II error? Explain your answer.
> Consider a one-mean z-test. Denote z0 as the observed value of the test statistic z. If the test is right tailed, then the P-value can be expressed as P(z ≥ z0). Determine the corresponding expression for the P-value if the test is a. left tailed. b. tw
> We have given the value obtained for the test statistic, z, in a one-mean z-test. We have also specified whether the test is two tailed, left tailed, or right tailed. Determine the P-value in each case and decide whether, at the 5% significance level, th
> We have given the value obtained for the test statistic, z, in a one-mean z-test. We have also specified whether the test is two tailed, left tailed, or right tailed. Determine the P-value in each case and decide whether, at the 5% significance level, th
> We have given the value obtained for the test statistic, z, in a one-mean z-test. We have also specified whether the test is two tailed, left tailed, or right tailed. Determine the P-value in each case and decide whether, at the 5% significance level, th
> We have given the value obtained for the test statistic, z, in a one-mean z-test. We have also specified whether the test is two tailed, left tailed, or right tailed. Determine the P-value in each case and decide whether, at the 5% significance level, th
> We have given the value obtained for the test statistic, z, in a one-mean z-test. We have also specified whether the test is two tailed, left tailed, or right tailed. Determine the P-value in each case and decide whether, at the 5% significance level, th
> We have given the value obtained for the test statistic, z, in a one-mean z-test. We have also specified whether the test is two tailed, left tailed, or right tailed. Determine the P-value in each case and decide whether, at the 5% significance level, th
> We have drawn a smooth curve that represents a distribution. In each case, do the following: a. Identify the shape of the distribution with regard to modality. b. Identify the shape of the distribution with regard to symmetry (or non-symmetry). c. If the
> We have given the P-value for a hypothesis test. Determine the strength of the evidence against the null hypothesis. P = 0.012
> We have given the P-value for a hypothesis test. Determine the strength of the evidence against the null hypothesis. P = 0.001
> We have given the P-value for a hypothesis test. Determine the strength of the evidence against the null hypothesis. P = 0.086
> Suppose that, in a hypothesis test, the null hypothesis is in fact true. a. Is it possible to make a Type I error? Explain your answer. b. Is it possible to make a Type II error? Explain your answer.
> We have given the P-value for a hypothesis test. Determine the strength of the evidence against the null hypothesis. P = 0.184
> We have given the P-value for a hypothesis test. Determine the strength of the evidence against the null hypothesis. P = 0.004
> We have given the P-value for a hypothesis test. Determine the strength of the evidence against the null hypothesis. P = 0.027
> We have given the P-value for a hypothesis test. Determine the strength of the evidence against the null hypothesis. P = 0.35
> We have given the P-value for a hypothesis test. Determine the strength of the evidence against the null hypothesis. P = 0.06
> Which provides stronger evidence against the null hypothesis, a P-value of 0.06 or a P-value of 0.04? Explain your answer.
> We have drawn a smooth curve that represents a distribution. In each case, do the following: a. Identify the shape of the distribution with regard to modality. b. Identify the shape of the distribution with regard to symmetry (or non-symmetry). c. If the
> The document “American Attitudes about Genocide” provided highlights of a nationwide poll with 1000 participants. The survey, conducted by Penn Schoen Berland between June 30 and July 10, 2012, revealed that “66% of respondents believe that genocide is p
> Which provides stronger evidence against the null hypothesis, a P-value of 0.02 or a P-value of 0.03? Explain your answer.
> The P-value for a hypothesis test is 0.083. For each of the following significance levels, decide whether the null hypothesis should be rejected. a. α = 0.05 b. α = 0.10 c. α = 0.06
> The P-value for a hypothesis test is 0.06. For each of the following significance levels, decide whether the null hypothesis should be rejected. a. α = 0.05 b. α = 0.10 c. α = 0.06
> True or false: The P-value is the smallest significance level for which the observed sample data result in rejection of the null hypothesis.
> Suppose that you are considering a hypothesis test for a population mean, μ. In each part, express the alternative hypothesis symbolically and identify the hypothesis test as two tailed, left tailed, or right tailed. a. You want to decide whether the pop
> Explain how the P-value is obtained for a one-mean z-test in case the hypothesis test is a. left tailed. b. right tailed. c. two tailed.
> What is the P-value of a hypothesis test? When does it provide evidence against the null hypothesis?
> State two reasons why including the P-value is prudent when you are reporting the results of a hypothesis test.
> Determine the critical value(s) for a one-mean z-test. For each exercise, draw a graph that illustrates your answer. A two-tailed test with α = 0.05.
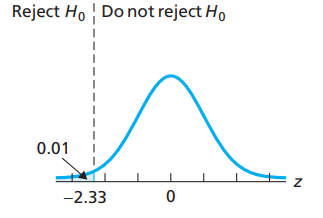
> Determine the critical value(s) for a one-mean z-test. For each exercise, draw a graph that illustrates your answer. A right-tailed test with α = 0.01.
> Identify and sketch three distribution shapes that are symmetric.
> Determine the critical value(s) for a one-mean z-test. For each exercise, draw a graph that illustrates your answer. A left-tailed test with α = 0.05.
> Determine the critical value(s) for a one-mean z-test. For each exercise, draw a graph that illustrates your answer. A left-tailed test with α = 0.01.
> Determine the critical value(s) for a one-mean z-test. For each exercise, draw a graph that illustrates your answer. A right-tailed test with α = 0.05.
> Determine the critical value(s) for a one-mean z-test. For each exercise, draw a graph that illustrates your answer. A two-tailed test with α = 0.10.
> Contain graphs portraying the decision criterion for a one-mean z-test. The curve in each graph is the normal curve for the test statistic under the assumption that the null hypothesis is true. For each exercise, determine the: a. rejection region. b. n
> Suppose that you want to perform a hypothesis test for a population mean, μ. a. Express the null hypothesis both in words and in symbolic form. b. Express each of the three possible alternative hypotheses in words and in symbolic form.
> Contain graphs portraying the decision criterion for a one-mean z-test. The curve in each graph is the normal curve for the test statistic under the assumption that the null hypothesis is true. For each exercise, determine the: a. rejection region. b. n
> Contain graphs portraying the decision criterion for a one-mean z-test. The curve in each graph is the normal curve for the test statistic under the assumption that the null hypothesis is true. For each exercise, determine the: a. rejection region. b. n
> Contain graphs portraying the decision criterion for a one-mean z-test. The curve in each graph is the normal curve for the test statistic under the assumption that the null hypothesis is true. For each exercise, determine the: a. rejection region. b. n
> Suppose that a variable of a population has a reverse-J-shaped distribution and that two simple random samples are taken from the population. a. Would you expect the distributions of the two samples to have roughly the same shape? If so, what shape? b. W
> Contain graphs portraying the decision criterion for a one-mean z-test. The curve in each graph is the normal curve for the test statistic under the assumption that the null hypothesis is true. For each exercise, determine the: a. rejection region. b. n
> Define critical values?
> Define nonrejection region?
> Define rejection region?
> Define test statistic?
> Explain what each of the following would mean. a. Type I error b. Type II error c. Correct decision Now suppose that the results of carrying out the hypothesis test led to nonrejection of the null hypothesis. Classify that conclusion by error type or
> What role does the decision criterion play in a hypothesis test?
> Explain what each of the following would mean. a. Type I error b. Type II error c. Correct decision Now suppose that the results of carrying out the hypothesis test led to rejection of the null hypothesis. Classify that conclusion by error type or as a
> Explain what each of the following would mean. a. Type I error b. Type II error c. Correct decision Now suppose that the results of carrying out the hypothesis test lead to rejection of the null hypothesis. Classify that conclusion by error type or as
> Explain what each of the following would mean. a. Type I error b. Type II error c. Correct decision Now suppose that the results of carrying out the hypothesis test lead to nonrejection of the null hypothesis. Classify that conclusion by error type or
> Suppose that a variable of a population has a bell-shaped distribution. If you take a large simple random sample from the population, roughly what shape would you expect the distribution of the sample to be? Explain your answer.
> Explain what each of the following would mean. a. Type I error b. Type II error c. Correct decision Now suppose that the results of carrying out the hypothesis test lead to nonrejection of the null hypothesis. Classify that conclusion by error type or
> Explain what each of the following would mean. a. Type I error b. Type II error c. Correct decision Now suppose that the results of carrying out the hypothesis test lead to rejection of the null hypothesis. Classify that conclusion by error type or as
> Explain what each of the following would mean. a. Type I error b. Type II error c. Correct decision Now suppose that the results of carrying out the hypothesis test lead to rejection of the null hypothesis. Classify that conclusion by error type or as
> Explain what each of the following would mean. a. Type I error b. Type II error c. Correct decision Now suppose that the results of carrying out the hypothesis test led to nonrejection of the null hypothesis. Classify that conclusion by error type or as
> Data on salaries in the public school system are published annually in Ranking of the States and Estimates of School Statistics by the National Education Association. The mean annual salary of (public) classroom teachers is $55.4 thousand. A hypothesis t
> A study by researchers at the University of Maryland addressed the question of whether the mean body temperature of humans is 98.6◦F. The results of the study by P. Mackowiak et al. appeared in the article “A Critical Appraisal of 98.6◦F, the Upper Limit
> A study by M. Chen et al. titled “Heat Stress Evaluation and Worker Fatigue in a Steel Plant” (American Industrial Hygiene Association, Vol. 64, pp. 352–359) assessed fatigue in steel plant workers due to heat stress. Among other things, the researchers
> Regarding the term null hypothesis: a. Originally, what did the word null in null hypothesis stand for? b. What has the term null hypothesis come to mean now?
> According to the Bureau of Crime Statistics and Research of Australia, as reported on Lawlink, the mean length of imprisonment for motor-vehicle-theft offenders in Australia is 16.7 months. You want to perform a hypothesis test to decide whether the mean
> Dementia is the loss of the intellectual and social abilities severe enough to interfere with judgment, behavior, and daily functioning. Alzheimer’s disease is the most common type of dementia. In the article “Living with Early Onset Dementia: Exploring
> Give two reasons why the use of smooth curves to describe shapes of distributions is helpful.
> Iron is essential to most life forms and to normal human physiology. It is an integral part of many proteins and enzymes that maintain good health. Recommendations for iron are provided in Dietary Reference Intakes, developed by the Institute of Medicine
> Grey seals are one of several types of earless seals. The length of time that a female grey seal nurses her pup is studied by S. Twiss et al. in the article “Variation in Female Grey Seal (Halichoerus grypus) Reproductive Performance Correlates to Proact
> Cadmium, a heavy metal, is toxic to animals. Mushrooms, however, can absorb and accumulate cadmium at high concentrations. The Czech and Slovak governments have set a safety limit for cadmium in dry vegetables at 0.5 part per million (ppm). M. Melgar et
> In the U.S. court system, a defendant is assumed innocent until proven guilty. Suppose that you regard a court trial as a hypothesis test with null and alternative hypotheses H0: Defendant is innocent Ha: Defendant is guilty. a. Explain the meaning of a
> We introduced one-sided one-mean t-intervals. The following relationship holds between hypothesis tests and confidence intervals for one-mean t-procedures: For a right-tailed hypothesis test at the significance level α, the null hypothesis H0: μ = μ0 wil
> Suppose that you are performing a statistical test to decide whether a nuclear reactor should be approved for use. Further suppose that failing to reject the null hypothesis corresponds to approval. What property would you want the Type II error probabil
> We introduced one-sided one-mean t-intervals. The following relationship holds between hypothesis tests and confidence intervals for one-mean t-procedures: For a left-tailed hypothesis test at the significance level α, the null hypothesis H0: μ = μ0 will
> The following relationship holds between hypothesis tests and confidence intervals for one-mean t-procedures: For a two-tailed hypothesis test at the significance level α, the null hypothesis H0: μ = μ0 will be rejected in favor of the alternative hypoth
> Suppose that you want to perform a hypothesis test for a population mean. Assume that the variable under consideration has a symmetric nonnormal distribution and that the population standard deviation is unknown. Further assume that the sample size is la
> Suppose that you want to perform a hypothesis test for a population mean. Assume that the variable under consideration is normally distributed and that the population standard deviation is unknown. a. Is it permissible to use the t-test to perform the hy
> Explain the meaning of Distribution of a variable.
> According to the document Out of Reach, published by the National Low Income Housing Coalition, the fair market rent (FMR) for a two-bedroom unit in the United States is $949. A sample of 100 randomly selected two-bedroom units yielded the data on monthl
> In 2011, the average car in the United States was driven 13.5 thousand miles, as reported by the Federal Highway Administration in Highway Statistics. On the WeissStats site, we provide last year’s distance driven, in thousands of miles, by each of 500 r
> Previous studies have shown that urban bus drivers have an extremely stressful job, and a large proportion of drivers retire prematurely with disabilities due to occupational stress. In the paper, “Hassles on the Job: A Study of a Job Intervention with U
> Use the technology of your choice to decide whether applying the t -test to perform a hypothesis test for the population mean in question appears reasonable. Explain your answers. In the paper “Reassessment of TL Age Estimates of Burnt Flint from the Pal
> Use the technology of your choice to decide whether applying the t -test to perform a hypothesis test for the population mean in question appears reasonable. Explain your answers. An issue of Brokerage Report discussed the capital spending of telecommuni
> Use the technology of your choice to decide whether applying the t -test to perform a hypothesis test for the population mean in question appears reasonable. Explain your answers. In the article “Material Culture as Memory: Combs and Cremations in Early
> Suppose that a hypothesis test is performed at a small significance level. State the appropriate conclusion in each case by referring to Key Fact. a. The null hypothesis is rejected. b. The null hypothesis is not rejected.
> Use the technology of your choice to decide whether applying the t -test to perform a hypothesis test for the population mean in question appears reasonable. Explain your answers. From the Florida State Center for Health Statistics report, Women and Card
> Dirt bikes are simpler and lighter motorcycles that are designed for off-road events. Specifications for dirt bikes can be found through Motorcycle USA on their website www.motorcycle-usa.com. A random sample of 30 dirt bikes have a mean fuel capacity of
> The ankle brachial index (ABI) compares the blood pressure of a patient’s arm to the blood pressure of the patient’s leg. The ABI can be an indicator of different diseases, including arterial diseases. A healthy (or normal) ABI is 0.9 or greater. In a st
> Explain the meaning of Population distribution.
> According to the document Consumer Expenditures, a publication of the Bureau of Labor Statistics, the average consumer unit spent $1736 on apparel and services in 2012. That same year, 25 consumer units in the Northeast had the following annual expenditu
> Alligators perform a spinning maneuver, referred to as a “death roll,” to subdue their prey. Videos were taken of juvenile alligators performing this maneuver in a study for the article “Death Roll of the Alligator, Mechanics of Twist and Feeding in Wate
> Serious golfers and golf equipment companies sometimes use golf equipment testing labs to obtain precise information about particular club heads, club shafts, and golf balls. One golfer requested information about the Jazz Fat Cat 5-iron from Golf Labora
> According to Communications Industry Forecast & Report, published by Veronis Suhler Stevenson, the average person watched 4.55 hours of television per day in 2005. Random sample of 20 people gave the following number of hours of television watched per da
> We have provided a sample mean, sample standard deviation, and sample size. In each case, use the one-mean t -test to perform the required hypothesis test at the 5% significance level. x¯ = 20, s = 4, n = 24, H0: μ = 22, Ha: μ ≠ 22

