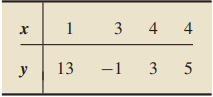
Question: Determine the linear correlation coefficient by
Determine the linear correlation coefficient by using
a. Definition 4.8.
b. Formula 4.3.
Compare your answers in parts (a) and (b).
> A quantitative data set of size 80 has mean 30 and standard deviation 5. At least how many observations lie between 20 and 40?
> −1.5 and 0 a. determine whether it slopes upward, slopes downward, or is horizontal, without graphing the equation. b. find its equation. c. use two points to graph the equation.
> The members of a population have been numbered 1–372. A sample of size 5 is to be taken from the population, using systematic random sampling. a. Apply Procedure 1.1 to determine the sample (i.e., the numbers corresponding to the members of the populatio
> Fill in the blank. The graph of a linear equation with one independent variable is a ____.
> 0 and −0.5 a. determine whether it slopes upward, slopes downward, or is horizontal, without graphing the equation. b. find its equation. c. use two points to graph the equation.
> 0.4 and 1 a. determine whether it slopes upward, slopes downward, or is horizontal, without graphing the equation. b. find its equation. c. use two points to graph the equation.
> Exercise 4.163 a. construct a scatterplot for the data. b. decide whether using the rank correlation coefficient is reasonable. c. decide whether using the linear correlation coefficient is reasonable. d. find and interpret the rank correlation coefficie
> −2 and −3 a. determine whether it slopes upward, slopes downward, or is horizontal, without graphing the equation. b. find its equation. c. use two points to graph the equation.
> Exercise 4.14 a. construct a scatterplot for the data. b. decide whether using the rank correlation coefficient is reasonable. c. decide whether using the linear correlation coefficient is reasonable. d. find and interpret the rank correlation coefficien
> A Knight-Ridder News Service article in an issue of the Wichita Eagle discussed a study on the relationship between country music and suicide. The results of the study, coauthored by S. Stack and J. Gundlach, appeared as the paper “The Effect of Country
> The coefficient of determination of a set of data points is 0.716. a. Can you determine the linear correlation coefficient? If yes, obtain it. If no, why not? b. Can you determine whether the slope of the regression line is positive or negative? Why or w
> A quantitative data set has size 50. At least how many observations lie within three standard deviations to either side of the mean?
> In the article “Comparison of Fiber Counting by TV Screen and Eyepieces of Phase Contrast Microscopy” (American Industrial Hygiene Association Journal, Vol. 63, pp. 756–761), I. Moa et al. reported on determining fiber density by two different methods. T
> The data for estriol levels of pregnant women and birth weights on the WeissStats site. Use the technology of your choice to a. decide whether use of the linear correlation coefficient as a descriptive measure for the data is appropriate. If so, then als
> Surveys that combine one or more of simple random sampling, systematic random sampling, cluster sampling, and stratified sampling employ what is called sampling.
> The data for age and percentage of body fat for 18 randomly selected adults are on the WeissStats site. Use the technology of your choice to a. decide whether use of the linear correlation coefficient as a descriptive measure for the data is appropriate.
> The data for volume, in cubic feet, and diameter at breast height, in inches, for 70 shortleaf pines are on the WeissStats site. Use the technology of your choice to a. decide whether use of the linear correlation coefficient as a descriptive measure for
> The data for gas mileage and engine displacement for 121 vehicles are provided on the WeissStats site. Use the technology of your choice to a. decide whether use of the linear correlation coefficient as a descriptive measure for the data is appropriate.
> The data for per capita income and per capita beer consumption for the 50 states and Washington, D.C.. are on the WeissStats site. Use the technology of your choice to a. decide whether use of the linear correlation coefficient as a descriptive measure f
> The data on shell thickness and concentration of PCBs for 60 Anacapa pelican eggs are on the WeissStats site. Use the technology of your choice to a. decide whether use of the linear correlation coefficient as a descriptive measure for the data is approp
> −3 and 4 a. determine whether it slopes upward, slopes downward, or is horizontal, without graphing the equation. b. find its equation. c. use two points to graph the equation.
> The data for average high and low temperatures in January for a random sample of 50 cities are on the WeissStats site. Use the technology of your choice to a. decide whether use of the linear correlation coefficient as a descriptive measure for the data
> A quantitative data set has size 60. At least how many observations lie within three standard deviations to either side of the mean?
> The data for home size (in square feet) and assessed value (in thousands of dollars) for the same homes are on the WeissStats site. Use the technology of your choice to a. decide whether use of the linear correlation coefficient as a descriptive measure
> The data for lot size (in acres) and assessed value (in thousands of dollars) for a sample of homes in a particular area are on the WeissStats site. Use the technology of your choice to a. decide whether use of the linear correlation coefficient as a des
> The data on domestic and overseas grosses for a random sample of 50 movies are on the WeissStats site. Use the technology of your choice to a. decide whether use of the linear correlation coefficient as a descriptive measure for the data is appropriate.
> Ideally, in stratified sampling, the members of each stratum should be relative to the characteristic under consideration.
> The data for the ages at inauguration and of death for the presidents of the United States are on the WeissStats site. Use the technology of your choice to a. decide whether use of the linear correlation coefficient as a descriptive measure for the data
> The data for number of birdies during a tournament and final score for 63 women golfers are on the WeissStats site. Use the technology of your choice to a. decide whether use of the linear correlation coefficient as a descriptive measure for the data is
> Perform the following tasks. a. Compute the linear correlation coefficient, r. b. Can you conclude from your answer in part (a) that the variables x and y are linearly related? Explain your answer. c. Draw a scatterplot for the data. d. Is use of the lin
> Perform the following tasks. a. Compute the linear correlation coefficient, r. b. Can you conclude from your answer in part (a) that the variables x and y are linearly related? Explain your answer. c. Draw a scatterplot for the data. d. Is use of the lin
> Consider the following set of data points. a. Compute the linear correlation coefficient, r. b. Can you conclude from your answer in part (a) that the variables x and y are unrelated? Explain your answer. c. Draw a scatterplot for the data. d. Is use of
> A random sample of 10 students was taken from an introductory statistics class. The following data were obtained, where x denotes height, in inches, and y denotes score on the final exam. a. What sort of value of r would you expect to find for these data
> A quantitative data set has size 80. At least how many observations lie within two standard deviations to either side of the mean
> 5 and 2 a. determine whether it slopes upward, slopes downward, or is horizontal, without graphing the equation. b. find its equation. c. use two points to graph the equation.
> Following are the data on study time and score for calculus students. a. obtain the linear correlation coefficient. b. interpret the value of r in terms of the linear relationship between the two variables in question. c. discuss the graphical interpreta
> Following are the data on age and crown-rump length for fetuses. a. obtain the linear correlation coefficient. b. interpret the value of r in terms of the linear relationship between the two variables in question. c. discuss the graphical interpretation
> Following are the data on plant weight and quantity of volatile emissions. a. obtain the linear correlation coefficient. b. interpret the value of r in terms of the linear relationship between the two variables in question. c. discuss the graphical inter
> Ideally, in cluster sampling, each cluster should the entire population.
> Following are the size and price data for custom homes. a. obtain the linear correlation coefficient. b. interpret the value of r in terms of the linear relationship between the two variables in question. c. discuss the graphical interpretation of the va
> Following are the age and price data for Corvettes. a. obtain the linear correlation coefficient. b. interpret the value of r in terms of the linear relationship between the two variables in question. c. discuss the graphical interpretation of the value
> Following are the data on percentage of investments in energy securities and tax efficiency. a. obtain the linear correlation coefficient. b. interpret the value of r in terms of the linear relationship between the two variables in question. c. discuss t
> Determine the linear correlation coefficient by using a. Definition 4.8. b. Formula 4.3. Compare your answers in parts (a) and (b).
> Determine the linear correlation coefficient by using a. Definition 4.8. b. Formula 4.3. Compare your answers in parts (a) and (b).
> A quantitative data set has size 40. At least how many observations lie within two standard deviations to either side of the mean?
> Determine the linear correlation coefficient by using a. Definition 4.8. b. Formula 4.3. Compare your answers in parts (a) and (b).
> Determine the linear correlation coefficient by using a. Definition 4.8. b. Formula 4.3. Compare your answers in parts (a) and (b).
> y = −3 a. find the y-intercept and slope. b. determine whether the line slopes upward, slopes downward, or is horizontal, without graphing the equation. c. use two points to graph the equation.
> Determine the linear correlation coefficient by using a. Definition 4.8. b. Formula 4.3. Compare your answers in parts (a) and (b).
> Systematic random sampling is easier to execute than simple random sampling and usually provides comparable results. The exception is the presence of some kind of in the listing of the members of the population.
> Determine the linear correlation coefficient by using a. Definition 4.8. b. Formula 4.3. Compare your answers in parts (a) and (b).
> Determine the linear correlation coefficient by using a. Definition 4.8. b. Formula 4.3. Compare your answers in parts (a) and (b).
> Determine the linear correlation coefficient by using a. Definition 4.8. b. Formula 4.3. Compare your answers in parts (a) and (b).
> Determine the linear correlation coefficient by using a. Definition 4.8. b. Formula 4.3. Compare your answers in parts (a) and (b).
> A quantitative data set has mean 30 and standard deviation 4. At least what percentage of the observations lie between 10 and 50?
> Use the specified grouping method to a. determine a frequency distribution. b. obtain a relative-frequency distribution. c. construct a frequency histogram based on your result from part (a). d. construct a relative-frequency histogram based on your resu
> The coefficient of determination of a set of data points is 0.709 and the slope of the regression line is −3.58. Determine the linear correlation coefficient of the data.
> The linear correlation coefficient of a set of data points is 0.846. a. Is the slope of the regression line positive or negative? Explain your answer. b. Determine the coefficient of determination.
> Answer true or false to the following statement and provide a reason for your answer: If there is a very strong positive correlation between two variables, a causal relationship exists between the two variables.
> Determine whether r is positive, negative, or zero.
> y = 1.5x a. find the y-intercept and slope. b. determine whether the line slopes upward, slopes downward, or is horizontal, without graphing the equation. c. use two points to graph the equation.
> Determine whether r is positive, negative, or zero.
> When the behavior of the interviewer or respondent results in inaccurate responses, we have response bias. a. Explain why a survey question “Do you smoke marijuana” might result in response bias? b. Provide some additional survey situations that might be
> Determine whether r is positive, negative, or zero.
> Fill in the blanks: 1. The symbol that is used for the linear correlation coefficient is ____. 2. A value of r close to ±1 indicates that there is a ___ linear relationship between the variables. 3. A value of r close to ___ indicates that there is eithe
> y = −3x a. find the y-intercept and slope. b. determine whether the line slopes upward, slopes downward, or is horizontal, without graphing the equation. c. use two points to graph the equation.
> A quantitative data set has mean 15 and standard deviation 2. At least what percentage of the observations lie between 7 and 23?
> The linear correlation coefficient is also known by another name. What is it?
> What is one purpose of the linear correlation coefficient?
> As we noted, because of the regression identity, we can express the coefficient of determination in terms of the total sum of squares and the error sum of squares as r2 = 1 − SSE/SST. a. Explain why this formula shows that the coefficient of determinatio
> What can you say about SSE, SSR, and the utility of the regression equation for making predictions if a. r2 = 1? b. r2 = 0?
> J. Greene and J. Touchstone conducted a study on the relationship between the estriol levels of pregnant women and the birth weights of their children. Their findings, “Urinary Tract Estriol: An Index of Placental Function,” were published in the America
> In the paper “Total Body Composition by Dual-Photon (153Gd) Absorptiometry” (American Journal of Clinical Nutrition, Vol. 40, pp. 834–839), R. Mazess et al. studied methods for quantifying body composition. Eighteen randomly selected adults were measured
> The data from Exercise 4.80 for volume, in cubic feet, and diameter at breast height, in inches, for 70 shortleaf pines are on the WeissStats site. a. Decide whether finding a regression line for the data is reasonable. If so, then also do parts (b)–(d).
> When responses are not obtained from some of the individuals in the sample because either those individuals cannot be reached or refuse to participate, we have nonresponse bias. a. Discuss some of the dangers of nonresponse. b. Many sample surveys that a
> The data for gas mileage and engine displacement for 121 vehicles from Exercise 4.78 are provided on the WeissStats site. a. Decide whether finding a regression line for the data is reasonable. If so, then also do parts (b)–(d). b. Obtain the coefficient
> The data for per capita income and per capita beer consumption for the 50 states and Washington, D.C., from Exercise 4.77 are on the WeissStats site. a. Decide whether finding a regression line for the data is reasonable. If so, then also do parts (b)–(d
> We have provided simple data sets for you to practice the basics of finding measures of center. 1, 2, 4, 4 a. mean. b. median. c. mode(s).
> The data for shell thickness and concentration of PCBs for 60 Anacapa pelican eggs from Exercise 4.76 are on the WeissStats site. a. Decide whether finding a regression line for the data is reasonable. If so, then also do parts (b)–(d). b. Obtain the coe
> y = 2 a. find the y-intercept and slope. b. determine whether the line slopes upward, slopes downward, or is horizontal, without graphing the equation. c. use two points to graph the equation.
> The data from Exercise 4.75 for average high and low temperatures in January for a random sample of 50 cities are on the WeissStats site. a. Decide whether finding a regression line for the data is reasonable. If so, then also do parts (b)–(d). b. Obtain
> The data from Exercise 4.74 for home size (in square feet) and assessed value (in thousands of dollars) for the same homes as in Exercise 4.107 are on the WeissStats site. a. Decide whether finding a regression line for the data is reasonable. If so, the
> The data from Exercise 4.73 for lot size (in acres) and assessed value (in thousands of dollars) for a sample of homes in a particular area are on the WeissStats site. a. Decide whether finding a regression line for the data is reasonable. If so, then al
> The data from Exercise 4.72 on domestic and overseas grosses for a random sample of 50 movies are on the WeissStats site. a. Decide whether finding a regression line for the data is reasonable. If so, then also do parts (b)–(d). b. Obtain the coefficient
> The data from Exercise 4.71 for the ages at inauguration and of death for the presidents of the United States are on the WeissStats site. a. Decide whether finding a regression line for the data is reasonable. If so, then also do parts (b)–(d). b. Obtain
> The data from Exercise 4.70 for number of birdies during a tournament and final score for 63 women golfers are on the WeissStats site. a. Decide whether finding a regression line for the data is reasonable. If so, then also do parts (b)–(d). b. Obtain th
> Oftentimes, an accurate and complete list of the population is unavailable. In such cases, one or more groups will be omitted from the sampling process because they are not listed as part of the population. This type of bias is called under coverage. a.
> At the beginning of this chapter, we discussed a freight study commissioned by the Chesapeake and Ohio Railroad Company (C&O). A sample of 2072 waybills from a population of 22,984 waybills was used to estimate the total revenue due C&O. The estimate arr
> A quantitative data set has mean 25 and standard deviation 5. Fill in the following blanks: a. At least 89% of the observations lie between and ___. b. At least % of the observations lie between 15 and 35.
> Following are the data on study time and score for calculus students. a. compute SST, SSR, and SSE. b. compute the coefficient of determination, r 2. c. determine the percentage of variation in the observed values of the response variable explained by th
> Following are the data on age and crown-rump length for fetuses. a. compute SST, SSR, and SSE. b. compute the coefficient of determination, r 2. c. determine the percentage of variation in the observed values of the response variable explained by the reg
> Following are the data on plant weight and quantity of volatile emissions. a. compute SST, SSR, and SSE. b. compute the coefficient of determination, r 2. c. determine the percentage of variation in the observed values of the response variable explained
> Following are the size and price data for custom homes. a. compute SST, SSR, and SSE. b. compute the coefficient of determination, r 2. c. determine the percentage of variation in the observed values of the response variable explained by the regression,
> y = −0.75x − 5 a. find the y-intercept and slope. b. determine whether the line slopes upward, slopes downward, or is horizontal, without graphing the equation. c. use two points to graph the equation.
> Regarding linear equations with one independent variable, answer the following questions: a. What is the general form of such an equation? b. In your expression in part (a), which letters represent constants and which represent variables? c. In your expr
> What does Chebyshev’s rule say about the percentage of observations in any data set that lie within a. four standard deviations to either side of the mean? b. 2.5 standard deviations to either side of the mean?
> Apply Chebyshev’s rule with k = 3 to verify that at least 89% of the observations in any data set lie within three standard deviations to either side of the mean, that is, between x¯ − 3s and x¯ + 3s.
> If the condition for using the empirical rule is met, why should that rule be used instead of Chebyshev’s rule?
> Discuss the pros and cons of Chebyshev’s rule.
> Provide a scenario of your own in which a sample is not representative.

