Question: Eleven student teachers took part in an
Eleven student teachers took part in an evaluation program designed to measure teacher effectiveness and determine what factors are important. The response measure was a quantitative evaluation of the teacher. The regressor variables were scores on four standardized tests given to each teacher. The data are as follows:
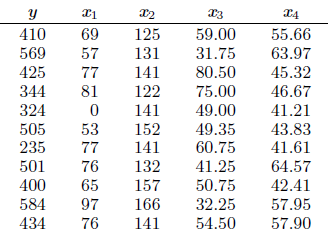
Estimate the multiple linear regression equation μY |x1,x2,x3,x4 = β0 + β1x1 + β2x2 + β3x3 + β4x4.
Transcribed Image Text:
410 69 125 59.00 55.66 569 57 131 31.75 63.97 425 77 141 80.50 45.32 344 81 122 75.00 46.67 324 141 49.00 41.21 505 235 53 152 141 49.35 43.83 41.61 77 60.75 501 76 132 41.25 64.57 400 65 157 50.75 42.41 584 97 166 32.25 57.95 434 76 141 54.50 57.90
> Determine whether or not the given set is (a) open, (b) connected, and (c) simply-connected. {(x, y) | 1 < |x | < 2}
> (a). What happens to the spiral tube in Example 2 (see Figure 5) if we replace cos u by sin u and sin u by cos u? (b). What happens if we replace cos u by cos 2u and sin u by sin 2u?
> Show that F is a conservative vector field. Then find a function f such that F = ∇f. F(x, y, z) = sin yi + x cos yj – sin z k
> Show that the line integral is independent of path and evaluate the integral. ∫C sin y dx + (x cos y - sin y) dy, C is any path from (2, 0) to (1, π)
> Identify the surface with the given vector equation. r (u, v) = (u + v) i + (3 – v) j + (1 + 4u + 5v) k
> Determine whether the points P and Q lie on the given surface. r (u, v) = 〈1 + u - v, u + v2, u2 - v2〉 P (1, 2, 1), Q (2, 3, 3)
> Determine whether the points P and Q lie on the given surface. r (u, v) = 〈u + v, u - 2v, 3 + u – v〉 P (4, -5, 1), Q (0, 4, 6)
> A particle moves in a velocity field V (x, y) = 〈x^2, x, + y^2 〉 If it is at position s2, 1d at time t − 3, estimate its location at time t = 3.01.
> If you have a CAS that plots vector fields (the command is field plot in Maple and Plot Vector Field or Vector Plot in Mathematica), use it to plot F (x, y) = (y2 - 2xy) i +) (3xy - 6x2) j Explain the appearance by finding the set of points (x, y) such t
> Match the functions f with the plots of their gradient vector fields labeled I–IV. Give reasons for your choices. f (x, y) = (x + y)2 II 4 -4 4 -4
> Plot the gradient vector field of f together with a contour map of f. Explain how they are related to each other. f (x, y) = cos x - 2 sin y
> Match the vector fields F on R3 with the plots labeled I–IV. Give reasons for your choices. F (x, y, z) = x i + y j + z k IV z 0 z 0- -10 y 10-1
> (a). What is a function of two variables? (b). Describe three methods for visualizing a function of two variables.
> (a). What is a parametric surface? What are its grid curves? (b). Write an expression for the area of a parametric surface. (c). What is the area of a surface given by an equation z = t (x, y)?
> (a). Find the work done by the force field F (x, y) = x2 i + xy j on a particle that moves once around the circle x2 + y2 = 4 oriented in the counterclockwise direction. (b). Use a computer algebra system to graph the force field and circle on the same s
> (a). Evaluate the line integral ∫C F ∙ dr, where F (x, y) = ex-1 i + xy j and C is given by r(t) = t2 i + t3 j, 0 (b). Illustrate part (a) by using a graphing calculator or computer to graph C and the vectors from the
> Determine whether or not the given set is (a) open, (b) connected, and (c) simply-connected. {(x, y) | 1 < x2 + y2 < 4, y > 0}
> Use Green’s Theorem to prove the change of variables formula for a double integral (Formula 15.9.9) for the case where f (x, y) = 1: Here R is the region in the xy-plane that corresponds to the region S in the uv-plane under the trans
> Let F = ∇f, where f (x, y) = sin (x - 2y). Find curves C1 and C2 that are not closed and satisfy the equation. (a) f. F· dr = 0 JCI (b) f. (b) F. dr = 1
> Use the method of Example 5 to calculate ∫C F ∙ dr, where and C is any positively oriented simple closed curve that encloses the origin. F(x, y) = 2хyi + (у? — х?)j (x? + у?)?
> Is the vector field shown in the figure conservative? Explain.
> Match the vector fields F with the plots labeled I–IV. Give reasons for your choices. F (x, y) = 〈x, -y〉 I 3 -3 3 -3
> (a). How do you find the velocity, speed, and acceleration of a particle that moves along a space curve? (b). Write the acceleration in terms of its tangential and normal components.
> Determine whether or not the vector field is conservative. If it is conservative, find a function f such that F = ∇f. F (x, y, z) = ex sin yz i + zex cos yz j + yex cos yz k
> (a). Write the general form of a second-order homogeneous linear differential equation with constant coefficients. (b). Write the auxiliary equation. (c). How do you use the roots of the auxiliary equation to solve the differential equation? Write the fo
> Determine whether the statement is true or false. If it is true, explain why. If it is false, explain why or give an example that disproves the statement. 1. If y1 and y2 are solutions of y'' + y = 0, then y1 + y2 is also a solution of the equation. 2. I
> Test whether the regression explained by the model in Exercise 12.5 on page 450 is significant at the 0.01 level of significance. 1 Exercise 12.5: The electric power consumed each month by a chemical plant is thought to be related to the average ambient
> Test whether the regression explained by the model in Exercise 12.1 on page 450 is significant at the 0.01 level of significance. Exercise 12.1: A set of experimental runs was made to determine a way of predicting cooking time y at various values of ov
> Compute and interpret the coefficient of multiple determination for the variables of Exercise 12.1 on page 450. Exercise 12.1: A set of experimental runs was made to determine a way of predicting cooking time y at various values of oven width x1 and fl
> Use the data from Exercise 12.16 on page 453. (a) Estimate σ2 using the multiple regression of y on x1, x2, and x3, (b) Compute a 95% prediction interval for the observed gain with the three regressors at x1 = 15.0, x2 = 220.0, and x3 = 6.0.
> Suppose in Review Exercise 11.53 on page 437 that we were also given the number of class periods missed by the 12 students taking the chemistry course. The complete data are shown. (a) Fit a multiple linear regression equation of the form ˆ
> Using the data from Exercise 12.28, test the following at the 0.05 level. (a) H0: β1 = 0 versus H1: β1 = 0; (b) H0: β2 = 0 versus H1: β2 = 0. (c) Do you have any reason to believe that the model in Exercise
> Consider the following data from Exercise 12.13 on page 452. (a) Estimate σ2 using multiple regression of y on x1 and x2. (b) Compute predicted values, a 95% confidence interval for mean wear, and a 95% prediction interval for observed wear
> Using the data of Exercise 12.5 on page 450 and the estimate of σ2 from Exercise 12.19, compute 95% confidence intervals for the predicted response and the mean response when x1 = 75, x2 = 24, x3 = 90, and x4 = 98. Exercise 12.5: The electric
> For Exercise 12.8 on page 451, construct a 90% confidence interval for the mean compressive strength when the concentration is x = 19.5 and a quadratic model is used. Exercise 12.8: The following is a set of coded experimental data on the compressive st
> Using the data of Exercise 12.2 on page 450 and the estimate of σ2 from Exercise 12.17, compute 95% confidence intervals for the predicted response and the mean response when x1 = 900 and x2 = 1.00. Exercise 12.2: In Applied Spectroscopy, the
> The mathematics department of a large university is designing a placement test to be given to incoming freshman classes. Members of the department feel that the average grade for this test will vary from one freshman class to another. This variation of t
> For the model of Exercise 12.1 on page 450, test the hypotheses that β1 = 2 against the alternative that β1 = 2. Use a P-value in your conclusion. Exercise 12.1: A set of experimental runs was made to determine a way of predictin
> For the model of Exercise 12.2 on page 450, test the hypothesis that β1 = 0 at the 0.05 level of significance against the alternative that β1 = 0. Exercise 12.2: In Applied Spectroscopy, the infrared reflectance spectra propertie
> For the model of Exercise 12.7 on page 451, 462 Chapter 12 Multiple Linear Regression and Certain Nonlinear Regression Models test the hypothesis that β2 = 0 at the 0.05 level of significance against the alternative that β2 = 0.
> Referring to Exercise 12.5 on page 450, find the estimate of (a) σ2b2 ; (b) Cov(b1, b4). Exercise 12.5: The electric power consumed each month by a chemical plant is thought to be related to the average ambient temperature x1, the number of d
> Obtain estimates of the variances and the covariance of the estimators b1 and b2 of Exercise 12.2 on page 450. Exercise 12.2: In Applied Spectroscopy, the infrared reflectance spectra properties of a viscous liquid used in the electronics industry as a
> In Applied Spectroscopy, the infrared reflectance spectra properties of a viscous liquid used in the electronics industry as a lubricant were studied. The designed experiment consisted of the effect of band frequency x1 and film thickness x2 on optical d
> For the data of Exercise 12.5 on page 450, estimate σ2. Exercise 12.5: The electric power consumed each month by a chemical plant is thought to be related to the average ambient temperature x1, the number of days in the month x2, the average
> For the data of Exercise 12.1 on page 450, estimate σ2. Exercise 12.1: In Applied Spectroscopy, the infrared reflectance spectra properties of a viscous liquid used in the electronics industry as a lubricant were studied. The designed experim
> For the data of Exercise 12.2 on page 450, estimate σ2. Exercise 12.2: In Applied Spectroscopy, the infrared reflectance spectra properties of a viscous liquid used in the electronics industry as a lubricant were studied. The designed experim
> An engineer at a semiconductor company wants to model the relationship between the gain or hFE of a device (y) and three parameters: emitter-RS (x1), base-RS (x2), and emitter-to-base-RS (x3). The data are shown below: (Data from Myers, Montgomery, a
> The daily profit from a juice vending machine placed in an office building is a value of a normal random variable with unknown mean μ and variance σ2. Of course, the mean will vary somewhat from building to building, and the distributor feels that these
> The personnel department of a certain industrial firm used 12 subjects in a study to determine the relationship between job performance rating (y) and scores on four tests. The data are as follows: Properties of the Least Squares Estimators 453 Estima
> A study was performed on a type of bearing to find the relationship of amount of wear y to x1 = oil viscosity and x2 = load. The following data were obtained. (From Response Surface Methodology, Myers, Montgomery, and Anderson-Cook, 2009.) (a) Estimat
> The following data reflect information from 17 U.S. Naval hospitals at various sites around the world. The regressors are workload variables, that is, items that result in the need for personnel in a hospital. A brief description of the variables is as f
> The following data are given: (a) Fit the cubic model μY |x = β0+β1x+β2x2+β3x3. (b) Predict Y when x = 2. 0 1 2 1 4 5 3 4 5 3 2 3 4
> A set of experimental runs was made to determine a way of predicting cooking time y at various values of oven width x1 and flue temperature x2. The coded data were recorded as follows: Estimate the multiple linear regression equation μY
> Case Study: Consider the data set for Exercise 12.12, page 452 (hospital data), repeated here. (c) Comment on what other analyses should be run. (d) Run appropriate analyses and write your conclusions concerning the final model. Site 1 15.57 44.0
> Show that in choosing the so-called best subset model from a series of candidate models, choosing the model with the smallest s2 is equivalent to choosing the model with the smallest R2adj.
> A study was conducted to determine whether lifestyle changes could replace medication in reducing blood pressure among hypertensives. The factors considered were a healthy diet with an exercise program, the typical dosage of medication for hypertension,
> The burn time for the first stage of a rocket is a normal random variable with a standard deviation of 0.8 minute. Assume a normal prior distribution for μ with a mean of 8 minutes and a standard deviation of 0.2 minute. If 10 of these rockets are fired
> A carbon dioxide (CO2) flooding technique is used to extract crude oil. The CO2 floods oil pockets and displaces the crude oil. In an experiment, flow tubes are dipped into sample oil pockets containing a known amount of oil. Using three different values
> Consider the data of Review Exercise 12.64. Suppose it is of interest to add some “interaction” terms. Namely, consider the model yi = β0 + β1x1i + β2x2i + β3x3i + Î
> In exercise physiology, an objective measure of aerobic fitness is the oxygen consumption in volume per unit body weight per unit time. Thirty-one individuals were used in an experiment in order to be able to model oxygen consumption against age in years
> In a chemical engineering experiment dealing with heat transfer in a shallow fluidized bed, data are collected on the following four regressor variables: fluidizing gas flow rate, lb/hr (x1); supernatant gas flow rate, lb/hr (x2); supernatant gas inlet n
> A small experiment was conducted to fit a multiple regression equation relating the yield y to temperature x1, reaction time x2, and concentration of one of the reactants x3. Two levels of each variable were chosen, and measurements corresponding to the
> Show that, in a multiple linear regression data set, hi =p. 2=1
> In the Department of Fisheries and Wildlife at Virginia Tech, an experiment was conducted to study the effect of stream characteristics on fish biomass. The regressor variables are as follows: average depth (of 50 cells), x1; area of in-stream cover (i.e
> In an experiment to ascertain the effect of load, x, in lb/inches2, on the probability of failure of specimens of a certain fabric type, an experiment was conducted in which numbers of specimens were exposed to loads ranging from 5 lb/in.2 to 90 lb/in.2.
> From a set of streptonignic dose-response data, an experimenter desires to develop a relationship between the proportion of lymphoblasts sampled that contain aberrations and the dosage of streptonignic. Five dosage levels were applied to the rabbits used
> The developer of a new condominium complex claims that 3 out of 5 buyers will prefer a two-bedroom unit, while his banker claims that it would be more correct to say that 7 out of 10 buyers will prefer a two bedroom unit. In previous predictions of this
> In Exercise 12.28, page 462, we have the following data concerning wear of a bearing: (a) The following model may be considered to describe the data: yi = β0 + β1x1i + β2x2i + β12x1ix2i + i, for i = 1, 2,
> For Exercise 12.57, test H0: β1 = β6 = 0. Give P-values and comment. Exercise 12.57: The pull strength of a wire bond is an important characteristic. The following data give information on pull strength y, die height x1, post he
> The pull strength of a wire bond is an important characteristic. The following data give information on pull strength y, die height x1, post height x2, loop height x3, wire length x4, bond width on the die x5, and bond width on the post x6. (From Myers,
> In an effort to model executive compensation for the year 1979, 33 firms were selected, and data were gathered on compensation, sales, profits, and employment. The following data were gathered for the year 1979. Consider the model yi = β0
> For the randomized block design with k treatments and b blocks, show that b. E(SSB) = (b – 1)o² + k B3. j=1
> Show that the computing formula for SSB, in the analysis of variance of the randomized complete block design, is equivalent to the corresponding term in the identity of Theorem 13.3.
> Prove Theorem 13.2.
> Show that the mean square error for the analysis of variance in a one-way classification is an unbiased estimate of σ2. SSE k(n – 1)
> Four different locations in the northeast were used for collecting ozone measurements in parts per million. Amounts of ozone were collected in 5 samples at each location. (a) Is there sufficient information here to suggest that there are differences i
> A study is conducted to compare gas mileage for 3 competing brands of gasoline. Four different automobile models of varying size are randomly selected. The data, in miles per gallon, follow. The order of testing is random for each model. (a) Discuss th
> A previous study indicates that the percentage of chain smokers, p, who have lung cancer follows a beta distribution (see Section 6.8) with mean 70% and standard deviation 10%. Suppose a new data set collected shows that 81 out of 120 chain smokers have
> A company that stamps gaskets out of sheets of rubber, plastic, and cork wants to compare the mean number of gaskets produced per hour for the three types of material. Two randomly selected stamping machines are chosen as blocks. The data represent the n
> An experiment was conducted to compare three types of paint for evidence of differences in their wearing qualities. They were exposed to abrasive action and the time in hours until abrasion was noticed was observed. Six specimens were used for each type
> In a study that was analyzed for personnel in the Department of Biochemistry at Virginia Tech, three diets were given to groups of rats in order to study the effect of each on dietary residual zinc in the bloodstream. Five pregnant rats were randomly ass
> Consider a design which is a 23−1 III with 2 center runs. Consider ¯yf as the average response at the design parameter and ¯y0 as the average response at the design center. Suppose the true regression model is E(Y ) = β0 + β1x1 + β2x2 + β3x3 + β11x21+ β2
> Construct a design that contains 9 design points, is orthogonal, contains 12 total runs and 3 degrees of freedom for replication error, and allows for a lack-of-fit test for pure quadratic curvature.
> Verify that your design in Review Exercise 15.43 is indeed resolution IV. Exercise 15.43: Use Table 15.16 to construct a 16-run design with 8 factors that is resolution IV. Table 15.16: Table 15.16: Some Resolution III, IV, V, VI and VII 2k-P Desi
> Use Table 15.16 to construct a 16-run design with 8 factors that is resolution IV. Table 15.16: Table 15.16: Some Resolution III, IV, V, VI and VII 2k-P Designs Number of Number of Factors Design Points Generators 23-1 2III C = ±AB D = ±ABC D = ±AB
> In the study “The Use of Regression Analysis for Correcting Matrix Effects in the X-Ray Fluorescence Analysis of Pyrotechnic Compositions,” published in the Proceedings of the Tenth Conference on the Design of Experime
> Use the data from Exercise 13.14 on page 530 to see if the median amount of nitrogen lost in perspiration is different for the three levels of dietary protein. Exercise 13.14: The study Loss of Nitrogen Through Sweat by Preadolescent Boys Consuming Thre
> In Review Exercise 13.45 on page 555, use the Kruskal-Wallis test, at the 0.05 level of significance, to determine if the chemical analyses performed by the four laboratories give, on average, the same results. Exercise 13.45: Four laboratories are bein
> Service calls come to a maintenance center according to a Poisson process with λ calls per minute. A data set of 20 one-minute periods yields an average of 1.8 calls. If the prior for λ follows an exponential distribution with mean 2, determine the poste
> A study by a chemical company compared the drainage properties of two different polymers. Ten different sludges were used, and both polymers were allowed to drain in each sludge. The free drainage was measured in mL/min. (a) Use the sign test at the 0.
> In the article called “Risky Assumptions” by Paul Slovic, Baruch Fischoff, and Sarah Lichtenstein, published in Psychology Today (June 1980), the risk of dying in the United States from 30 activities and technologies is ranked by members of the League of
> Two judges at a college homecoming parade rank eight floats in the following order: (a) Calculate the rank correlation coefficient. (b) Test the null hypothesis that ρ = 0 against the alternative that ρ > 0. Use α
> A consumer panel tests nine brands of microwave ovens for overall quality. The ranks assigned by the panel and the suggested retail prices are as follows: Is there a significant relationship between the quality and the price of a microwave oven? Use a
> With reference to the weights and chest sizes of infants in Exercise 11.47 on page 436, (a) calculate the rank correlation coefficient; (b) test the hypothesis, at the 0.025 level of significance, that ρ = 0 against the alternative that Ï
> Calculate the rank correlation coefficient for the daily rainfall and amount of particulate removed in Exercise 11.13 on page 400. Exercise 11.13: A study of the amount of rainfall and the quantity of air pollution removed produced the following data:
> With reference to the data of Exercise 11.1 on page 398, (a) calculate the rank correlation coefficient; (b) test the null hypothesis, at the 0.05 level of significance, that ρ = 0 against the alternative that ρ = 0. Compare your r
> The following table gives the recorded grades for 10 students on a midterm test and the final examination in a calculus course: (a) Calculate the rank correlation coefficient. (b) Test the null hypothesis that ρ = 0 against the alternative t
> What is the probability that at least 95% of a population will exceed the smallest value in a random sample of size n = 135?
> How large a sample is required to be 99% confident that at least 80% of the population will be less than the largest observation in the sample?
> Repeat Exercise 18.2 when 1 of the next 4 drinks overflows and the uniform prior distribution is π(p) = 10, 0.05 < p < 0.15. Exercise 18.2: Let us assume that the prior distribution for the proportion p of drinks from a vending machine that overflow is

