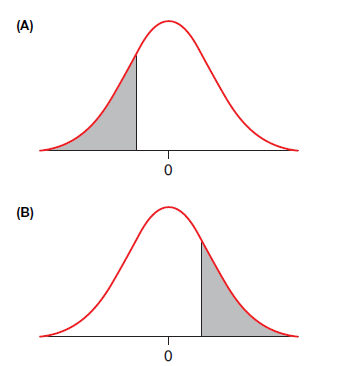
Question: For each graph, state whether the shaded
For each graph, state whether the shaded area could represent a p-value. Explain why or why not. If yes, state whether the area could represent the p-value for a one-sided or a two-sided alternative hypothesis.
> Marco is interested in whether Proposition P will be passed in the next election. He goes to the university library and takes a poll of 100 students. Since 58% favor Proposition P, Marco believes it will pass. Explain what is wrong with his approach.
> Using your result from Exercise 7.107, solve for n by (1) dividing both sides of the equation by 2, (2) squaring both sides of the equation, (3) cross-multiplying, and (4) solving for n.
> From Formula 7.2, an estimate for margin of error for a 95% confidence interval is m= 2√ˆp(1 - ˆp) n where n is the required sample size andˆp is the sample proportion. Since we do not know a value for ˆp, we use a conservative estimate of 0.50 f
> Four women selected from a photo of 123 were found to have a sample mean height of 71 inches (5 feet 11 inches). The population mean for all 123 women was 64.6 inches. Is this evidence that the sampling procedure was biased? Explain.
> Suppose that, when taking a random sample of 4 from 123 women, you get a mean height of only 60 inches (5 feet). The procedure may have been biased. What else could have caused this small mean?
> You want to find the mean weight of the students at your college. You calculate the mean weight of a sample of members of the football team. Is this method biased? If so, would the mean of the sample be larger or smaller than the true population mean for
> If you walked around your school campus and asked people you met how many keys they were carrying, would you be obtaining a random sample? Explain.
> Maria opposes capital punishment and wants to find out if a majority of voters in her state support it. She goes to a church picnic and asks everyone there for their opinion. Because most of them oppose capital punishment, she concludes that a vote in he
> Babies in the United states have a mean birth length of 20.5 inches with a standard deviation of 0.90 inch. The shape of the distribution of birth lengths is approximately Normal. a. How long is a baby born at the 20th percentile? b. How long is a baby b
> A teacher giving a true/false test wants to make sure her students do better than they would if they were simply guessing, so she forms a hypothesis to test this. Her null hypothesis is that a student will get 50% of the questions on the exam correct. Th
> a. If a rifleman’s gunsight is adjusted incorrectly, he might shoot bullets consistently close to 2 feet left of the bull’s-eye target. Draw a sketch of the target with the bullet holes. Does this show lack of precision or bias? b. Draw a second sketch o
> The mother of a teenager has heard a claim that 25% of teenagers who drive and use a cell phone reported texting while driving. She thinks that this rate is too high and wants to test the hypothesis that fewer than 25% of these drivers have texted while
> Refer to Exercise 8.97. Suppose 14 out of 20 voters in Pennsylvania report having voted for an independent candidate. The null hypothesis is that the population proportion is 0.50. What value of the test statistic should you report?
> Judging on the basis of experience, a politician claims that 50% of voters in Pennsylvania have voted for an independent candidate in past elections. Suppose you surveyed 20 randomly selected people in Pennsylvania, and 12 of them reported having voted f
> A poll on a proposition showed that we are 99% confident that the population proportion of voters supporting it is between 52% and 62%. Find the sample proportion that supported the proposition.
> In the primaries leading up to the 2016 presidential election, the Business Insider reported that Bernie Sanders and Hilary Clinton were in a “statistical tie” in the polls leading up to the Vermont primary. Clinton led Sanders 43% to 35% in the polls, w
> According to a 2017 Gallup poll, 17% of Americans report they rarely feel stressed. Suppose 80 Americans are randomly sampled. Find the probability of the following: a. Wxactly 15 rarely feel stressed b. More than 20 rarely feel stressed c. At most 10 ra
> According to a 2017 Gallup poll, 44% of Americans report they frequently feel stressed. Suppose 200 Americans are randomly sampled. Find the probability of the following: a. Fewer than 80 frequently feel stressed b. At least 90 frequently feel stressed c
> In 2018 Gallup reported that 52% of Americans are dissatisfied with the quality of the environment in the United States. This was based on a 95% confidence interval with a margin of error of 4 percentage points. Assume the conditions for constructing the
> According to the Bureau of Labor Statistics, 71.9% of young women enroll in college directly after high school graduation. Suppose a random sample of 200 female high school graduates is selected and the proportion who enroll in college is obtained. a. Wh
> See problem 6.89 for information about USMLE scores. a. What USMLE score would correspond with a z-score of -2? b. What USMLE score corresponds with a z-score of 1? c. Find the z-score that corresponds with a USMLE score of 250. Would a score of 250 be c
> Whales have one of the longest gestation periods of any mammal. According to whalefacts.org, the mean gestation period for a whale is 14 months. Assume the distribution of gestation periods is Normal with a standard deviation of 1.2 months. a. Find the s
> A poll on a proposition showed that we are 95% confident that the population proportion of voters supporting it is between 40% and 48%. Find the sample proportion that supported the proposition.
> A study of human body temperatures using healthy women showed a mean of 98.4 °F and a standard deviation of about 0.70 °F. Assume the temperatures are approximately Normally distributed. a. Find the percentage of healthy women with temperatures below 98.
> A study of human body temperatures using healthy men showed a mean of 98.1 °F and a standard deviation of 0.70 °F. Assume the temperatures are approximately Normally distributed. a. Find the percentage of healthy men with temperatures below 98.6 °F (that
> A study of U.S. births published on the website Medscape from WebMD reported that the average birth length of babies was 20.5 inches and the standard deviation was about 0.90 inch. Assume the distribution is approximately Normal. Find the percentage of b
> A study of U.S. births published on the website Medscape from WebMD reported that the average birth length of babies was 20.5 inches and the standard deviation was about 0.90 inch. Assume the distribution is approximately Normal. Find the percentage of b
> a. If a rifleman’s gunsight is adjusted correctly, but he has shaky arms, the bullets might be scattered widely around the bull’s-eye target. Draw a sketch of the target with the bullet holes. Does this show variation (lack of precision) or bias? b. Draw
> Determine whether each of the following variables would best be modeled as continuous or discrete: a. Number of girls in a family b. Height of a tree c. Commute time d. Concert attendance
> A 2003 study of dreaming published in the journal Perceptual and Motor Skills found that out of a random sample of 113 people, 92 reported dreaming in color. However, the proportion of people who reported dreaming in color that was established in the 194
> A community college used enrollment records of all students and reported that that the percentage of the student population identifying as female in 2010 was 54% whereas the proportion identifying as female in 2018 was 52%. Would it be appropriate to use
> Suppose you tested 50 coins by flipping each of them many times. For each coin, you perform a significance test with a significance level of 0.05 to determine whether the coin is biased. Assuming that none of the coins is biased, about how many of the 50
> According to dogtime.com, the mean weight of an adult St. Bernard dog is 150 pounds. Assume the distribution of weights is Normal with a standard deviation of 10 pounds. a. Find the standard score associated with a weight of 170 pounds. b. Using the Empi
> A researcher studying extrasensory perception (ESP) tests 300 students. Each student is asked to predict the outcome of a large number of coin flips. For each student, a hypothesis test using a 5% significance level is performed. If the p-value is less t
> A study is done to see whether a coin is biased. The alternative hypothesis used is two-sided, and the obtained z-value is 1. Assuming that the sample size is sufficiently large and that the other conditions are also satisfied, use the Empirical Rule to
> A study is done to see whether a coin is biased. The alternative hypothesis used is two-sided, and the obtained z-value is 2. Assuming that the sample size is sufficiently large and that the other conditions are also satisfied, use the Empirical Rule to
> A student is tested to determine whether she can tell butter from margarine. She is blindfolded and given small bites of toast that has been spread with either butter or margarine that have been randomly chosen. The experiment is designed so that she wil
> A student who claims that he can tell tap water from bottled water is blindly tested with 20 trials. At each trial, tap water or bottled water is randomly chosen and presented to the student who much correctly identify the type of water. The experiment i
> Use technology or a Normal table to find each of the following. Include an appropriately labeled sketch of the Normal curve for each part with the appropriate area shaded. a. Find the probability that a z-score will be 2.12 or greater. b. Find the probab
> Use technology or a Normal table to find each of the following. Include an appropriately labeled sketch of the Normal curve for each part with the appropriate area shaded. a. Find the probability that a z-score will be 2.03 or less. b. Find the probabili
> For each of the following, state whether a one-proportion z-test or a two-proportion z-test would be appropriate, and name the population(s). a. A researcher takes a random sample of voters in western states and voters in southern states to determine if
> For each of the following, state whether a one-proportion z-test or a two-proportion z-test would be appropriate, and name the population(s). a. A polling agency takes a random sample of voters in California to determine if a ballot proposition will pass
> Use the table or technology to find the answer to each question. Include an appropriately labeled sketch of the Normal curve for each part. Shade the appropriate region. A section of the Normal table is provided in the previous exercise. a. Find the area
> For each question, find the area to the right of the given z-score in a standard Normal distribution. In this question, round your answers to the nearest 0.000.Include an appropriately labeled sketch of the N(0, 1) curve. a. z = -4.00 b. z = -8.00 c. z =
> Use the table or technology to find the answer to each question. Include an appropriately labeled sketch of the Normal curve for each part. Shade the appropriate region. A section of the Normal table is provided. a. Find the area in a Standard Normal cur
> Quantitative SAT scores are approximately Normally distributed with a mean of 500 and a standard deviation of 100. Choose the correct StatCrunch output for finding the probability that a randomly selected person scores less than 450 on the quantitative S
> Assume college women’s heights are approximately Normally distributed with a mean of 65 inches and a standard deviation of 2.5 inches. Choose the Stat- Crunch output for finding the percentage of college women who are taller than 67 inc
> Assume that the lengths of pregnancy for humans is approximately Normally distributed, with a mean of 267 days and a standard deviation of 10 days. Use the Empirical Rule to answer the following questions. Do not use the technology or the Normal table. B
> The Empirical Rule applies rough approximations to probabilities for any unimodal, symmetric distribution. But for the Normal distribution we can be more precise. Use the figure and the fact that the Normal curve is symmetric to answer the questions. Do
> For each graph, indicate whether the shaded area could represent a p-value. Explain why or why not. If yes, state whether the area could represent the p-value for a one-sided or a two-sided alternative hypothesis.
> According to a 2017 AAA survey, 35% of Americans planned to take a family vacation (a vacation more than 50 miles from home involving two or more immediate family members). Suppose a recent survey of 300 Americans found that 115 planned on taking a famil
> According to a 2018 survey by Timex reported in Shape magazine, 73% of Americans report working out one or more times each week. A nutritionist is interested in whether this percentage has increased. A random sample of 200 Americans found 160 reported wo
> Suppose we are testing people to see whether the rate of use of seat belts has changed from a previous value of 88%. Suppose that in our random sample of 500 people we see that 450 have the seat belt fastened. Which of the following figures has the corre
> In carrying out a study of views on capital punishment, a student asked a question two ways: 1. With persuasion: “My brother has been accused of murder and he is innocent. If he is found guilty, he might suffer capital punishment. Now d
> A taste test is done to see whether a person can tell Coke from Pepsi. In each case, 20 random and independent trials are done (half with Pepsi and half with Coke) in which the person determines whether she or he is drinking Coke or Pepsi. One person get
> The average birth weight of elephants is 230 pounds. Assume that the distribution of birth weights is Normal with a standard deviation of 50 pounds. Find the birth weight of elephants at the 95th percentile.
> According to a Gallup poll, 11.55% of American adults have diabetes. Suppose a researcher wonders if the diabetes rate in her area is higher than the national rate. She surveys 150 adults in her area and finds that 21 of them have diabetes. a. If the reg
> Which of the graphs in Exercise 7.37 is centered farthest from 0.50? Graph from 7.37:
> One of the graphs shows the proportion of heads from flipping a fair coin 10 times, repeatedly. The others do not. Which graph represents the coin flips? Explain how you know.
> 1, 3, 5, 7, and 9 are odd and 0, 2, 4, 6, and 8 are even. Consider a 30-digit line from a random number table. a. How many of the 30 digits would you expect to be odd on average? b. If you actually counted, would you get exactly the number you predicted
> A large collection of one-digit random numbers should have about 50% odd and 50% even digits, because five of the ten digits are odd (1, 3, 5, 7, and 9) and five are even (0, 2, 4, 6, and 8). Find the proportion of odd-numbered digits in the following li
> Suppose college men’s heights are approximately Normally distributed with a mean of 70.0 inches and a population standard deviation of 3 inches. What height is at the 20th percentile? Include an appropriately labeled Normal curve to support your answer.
> Suppose college women’s heights are approximately Normally distributed with a mean of 65 inches and a population standard deviation of 2.5 inches. What height is at the 20th percentile? Include an appropriately labeled sketch of the Normal curve to suppo
> The distribution of grade point averages GPAs for medical school applicants in 2017 were approximately Normal, with a mean of 3.56 and a standard deviation of 0.34. Suppose a medical school will only consider candidates with GPAs in the top 15% of the ap
> A 20-question multiple choice quiz has five choices for each question. Suppose that a student just guesses, hoping to get a high score. The teacher carries out a hypothesis test to determine whether the student was just guessing. The null hypothesis is p
> Scores on the 2017 MCAT, an exam required for all medical school applicants, were approximately Normal with a mean score of 505 and a standard deviation of 9.4. a. Suppose an applicant had an MCAT score of 520. What percentile corresponds with this score
> The weight of newborn hippopotami is approximately Normal, with a mean of 88 pounds and a standard deviation of 10 pounds. a. What is the probability that a newborn hippo weighs between 90 and 110 pounds? b. Suppose baby hippos that weigh at the 5th perc
> A manager at a casual dining restaurant noted that 15% of customers ordered soda with their meal. In an effort to increase soda sales, the restaurant begins offering free refills with every soda order for a two-week trial period. During this trial period
> The National Association for Law Placement estimated that 86.7% of law school graduates in 2015 found employment. An economist thinks the current employment rate for law school graduates is different from the 2015 rate. Pick the correct pair of hypothese
> In 2016, the Centers for Disease Control and Prevention estimated that the flu vaccine was 73% effective against the influenza B virus. An immunologist suspects that the current flu vaccine is less effective against this virus. Pick the correct pair of h
> A friend is tested to see whether he can tell bottled water from tap water. There are 30 trials (half with bottled water and half with tap water), and he gets 18 right. a. Pick the correct null hypothesis: i. pn = 0.50 ii. pn = 0.60 iii. p = 0.50 iv. p =
> According to a 2015 University of Michigan poll, 71.5% of high school seniors in the United States had a driver’s license. A sociologist thinks this rate has declined. The sociologist surveys 500 randomly selected high school seniors and finds that 350 h
> A college chemistry instructor thinks the use of embedded tutors (tutors who work with students during regular class meeting times) will improve the success rate in introductory chemistry courses. The passing rate for introductory chemistry is 62%. The i
> In 2016 a Harris poll estimated that 3.3% of American adults are vegetarian. A nutritionist thinks this rate has increased and will take a random sample of American adults and record whether or not they are vegetarian. State the null and alternative hypo
> In problem 8.16, a college chemistry instructor thinks the use of embedded tutors will improve the success rate in introductory chemistry courses. The instructor carried out a hypothesis test and found that the observed value of the test statistic was 2.
> A hospital readmission is an episode when a patient who has been discharged from a hospital is readmitted again within a certain period. Nationally the readmission rate for patients with pneumonia is 17%. A hospital was interested in knowing whether thei
> Choose one of the answers in each case. In statistical inference, measurements are made on a _____ (sample or population), and generalizations are made to a _____ (sample or population).
> In problem 8.15 the nutritionist was interested in knowing if the rate of vegetarianism in American adults has increased. She carried out a hypothesis test and found that the observed value of the test statistic was 2.77. We can calculate that the p-valu
> A college chemistry instructor thinks the use of embedded tutors will improve the success rate in introductory chemistry courses. The passing rate for introductory chemistry is 62%. During one semester, 200 students were enrolled in introductory chemistr
> In 2016 the Harris poll estimated that 3.3% of American adults are vegetarian. A nutritionist thinks this rate has increased. The nutritionist samples 150 American adults and finds that 11 are vegetarian. a. What is pn, the sample proportion of vegetaria
> According to Green Car Reports, 4.4% of cars sold in California in 2017 were hybrid cars. Suppose in a random sample of 500 recently sold cars in California 18 were hybrid. a. Write the null and alternative hypotheses to test that hybrid car sales in Cal
> According to a 2017 Pew Research Center report, 37% of adults aged 18 to 29 had student loan debt. Suppose in a random sample of adults from this age group 48 out of 120 had student loan debt. a. Give the null and alternative hypotheses to test that the
> An economist is testing the hypothesis that the employment rate for law school graduates is different from 86.7%. The economist is using a 5% significance level and these hypotheses: H0: p = 0.867 and Ha: p 0.867. Explain what the 5% significance level
> An immunologist is testing the hypothesis that the current flu vaccine is less than 73% effective against the flu virus. The immunologist is using a 1% significance level and these hypotheses: Ho: p = 0.73 and Ha: p 6 0.73. Explain what the 1% significan
> The label on a can of mixed nuts says that the mixture contains 40% peanuts. After opening a can of nuts and finding 22 peanuts in a can of 50 nuts, a consumer thinks the proportion of peanuts in the mixture differs from 40%. The consumer writes these hy
> Choose one of the answers given. The null hypothesis is always a statement about a _____ (sample statistic or population parameter).
> Quantitative SAT scores are approximately Normally distributed with a mean of 500 and a standard deviation of 100. On the horizontal axis of the graph, indicate the SAT scores that correspond with the provided z-scores. (See the labeling in Exercise 6.14
> In 2017 Pew Research Center polled 3930 adults in the United States and found that 43% reported playing video games often on some kind of electronic device. a. Identify the population and the sample. b. What is the parameter of interest? What is the stat
> The city of San Francisco provides an open data set of commercial building energy use. Each row of the data set represents a commercial building. A sample of 100 buildings from the data set had a mean floor area of 32,470 square feet. Of the sample, 28%
> The standard deviation of all professional NBA basketball players is 29.9 pounds. A sample of 50 professional basketball players has a standard deviation of 26.7 pounds. Which number is σ, and which number is s?
> The mean weight of all professional NBA basketball players is 218.8 pounds. A sample of 50 professional basketball players has a mean weight of 217.6 pounds. Which number is µ, and which number is x ?
> Two symbols are used for the standard deviation: σ and s. a. Which represents a parameter, and which represents a statistic? b. To estimate the commute time for all students at a college, 100 students are asked to report their commute times in minutes. T
> Two symbols are used for the mean: µ and x. a. Which represents a parameter, and which a statistic? b. In determining the mean age of all students at your school, you survey 30 students and find the mean of their ages. Is this mean x or µ?
> Use the data given in Exercise 7.23. Make the two given tables into one table by combining men for capital punishment into one group, men opposing it into another, women for it into one group, and women opposing it into another. Show your two-way table.
> The website scholarshipstats.com collected data on all 5341 NCAA basketball players for the 2017 season and found a mean height of 77 inches. Is the number 77 a parameter or a statistic? Also identify the population and explain your choice.
> To determine if patrons are satisfied with performance quality, a theater surveys patrons at an evening performance by placing a paper survey inside their programs. All patrons receive a program as they enter the theater. Completed surveys are placed in
> A school district conducts a survey to determine whether voters favor passing a bond to fund school renovation projects. All registered voters are called. Of those called, 15% answer the survey call. Of those who respond, 62% say they favor passing the b
> Assume your class has 30 students and you want a random sample of 10 of them. A student suggests asking each student to flip a coin, and if the coin comes up heads, then he or she is in your sample. Explain why this is not a good method.
> Assume your class has 30 students and you want a random sample of 10 of them. Describe how to randomly select 10 people from your class using the random number table.
> The Centers for Disease Control and Prevention (CDC) conducts an annual Youth Risk Behavior Survey, surveying over 15,000 high school students. The 2015 survey reported that, while cigarette use among high school youth had declined to its lowest levels,

