Question: For the data in the following matrix: /
For the data in the following matrix:
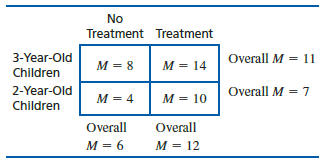
a. Which two means are compared to describe the treatment main effect?
b. Which two means are compared to describe the main effect of age?
c. Is there an interaction between age and treatment?
Explain your answer.
> Solve the following problems. Find the mean, median, and mode for the scores in the following frequency distribution table. Based on the three values for central tendency, what is the most likely shape for this distribution of scores (symmetrical, positi
> For the following set of scores: a. Construct a frequency distribution table to organize the scores. Include cumulative frequency and cumulative percent. b. What is the percentile rank of the upper real limit of X = 5? c. What is the upper real limit of
> Anderson (1999) was interested in the effects of attention load on reaction time. Participants in her study received a dual-task procedure in which they needed to respond as quickly as possible to a stimulus while simultaneously paying attention to the s
> Solve the following problems. Find the mean, median, and mode for the following scores. Based on the relative values for the mean, median, and mode, what is the most likely shape for this distribution of scores (symmetrical, positively skewed, or negativ
> For the following frequency distribution table, identify the shape of the distribution.
> What shape is the distribution displayed in the following informal histogram? Identify the major and minor modes.
> Find the mean, median, and mode for the following scores: 8, 7, 5, 7, 0, 10, 2, 4, 11, 7, 8, 7
> Find the mean, median, and mode for the distribution of scores in the following frequency distribution table.
> For the following sample of n = 10 scores: 2, 3, 4, 4, 5, 5, 5, 6, 6, 7 a. Assume that the scores are measurements of a discrete variable and find the median. b. Assume that the scores are measurements of a continuous variable and find the precise median
> Find the median for the following set of scores: 1, 4, 8, 7, 13, 26, 6
> Find the median for the following set of scores: 1, 9, 3, 6, 4, 3, 11, 10
> In 2016, the 50th percentile score for household income in the United States was $59,039. What statistic for central tendency is this?
> We know that the average IQ of everyone in the United States is 100. We randomly select 10 people and observe that their average IQ is 105. a. The value of 105 is a_____________. b. The value of 100 is a ______________.
> A sample of n =12 scores has ΣX = 72. What is the sample mean?
> A population of scores has a mean of μ = 50. Calculate the mean for each of the following. a. A constant value of 50 is added to each score. b. A constant value of 50 is subtracted from each score. c. Each score is multiplied by a constant value of 2. d.
> A sample of scores has a mean of M 5 6. Calculate the mean for each of the following. a. A constant value of 3 is added to each score. b. A constant value of 1 is subtracted from each score. c. Each score is multiplied by a constant value of 6. d. Each s
> A population of N = 10 scores has a mean of μ = 12. If one score with a value of X = 21 is removed from the population, then what is the value of the new population mean?
> A sample of n = 5 scores has a mean of M = 12. If one new score with a value of X = 17 is added to the sample, then what is the mean for the new sample?
> A sample of n = 6 scores has a mean of M = 10. If one score with a value of X = 12 is removed from the sample, then what is the value of the new sample mean?
> A sample of n = 6 scores has a mean of M = 10. If one score is changed from X = 12 to X = 0, what is the value of the new sample mean?
> A sample of n = 10 scores has a mean of M = 7. If one score is changed from X = 21 to X = 11, what is the value of the new sample mean?
> Find the mean for the scores in the following frequency distribution table:
> Define the terms statistic and parameter and explain how these terms are related to the concept of sampling error.
> Calculate the range and interquartile range for the following set of scores from a continuous variable: 5, 1, 6, 5, 4, 6, 7, 12. Identify the score that corresponds to the 75th percentile and the score that corresponds to the 25th percentile. Why is the
> Using the following informal histogram, calculate each of the following. a. n b. ΣX c. ΣX2
> A researcher conducted an experiment on the effect of caffeine on memory in college students in the United States. The researcher randomly assigned each of 100 students to one of two groups. One group received caffeinated coffee followed by a memory test
> Define the terms population and sample, and explain the role of each in a research study.
> A researcher is interested in the texting habits of high school students in the United States. The researcher selects a group of 100 students, measures the number of text messages that each individual sends each day, and calculates the average number for
> A communications company has developed three new designs for a smartphone. To evaluate consumer response, a sample of 240 college students is selected and each student is given all three phones to use for one week. At the end of the week, the students mu
> One sample of n = 10 scores has a mean of 8, and a second sample of n = 5 scores has a mean of 2. If the two samples are combined, what is the mean for the combined sample?
> Statistical methods are classified into two major categories: descriptive and inferential. Describe the general purpose for the statistical methods in each category.
> Automobile insurance is much more expensive for teenage drivers than for older drivers. To justify this cost difference, insurance companies claim that the younger drivers are much more likely to be involved in costly accidents. To test this claim, a res
> A professor in the psychology department would like to determine whether there has been a significant change in grading practices over the years. It is known that the overall grade distribution for the department in 1985 had 14% As, 26% Bs, 31% Cs, 19% D
> A psychologist examining art appreciation selected an abstract painting that had no obvious top or bottom. Hangers were placed on the painting so that it could be hung with any one of the four sides at the top. The painting was shown to a sample of n = 6
> Data from the Department of Motor Vehicles indicate that 80% of all licensed drivers are older than age 25. a. In a sample of n = 50 people who recently received speeding tickets, 33 were older than age 25 and the other 17 were age 25 or younger. Is the
> A developmental psychologist would like to determine whether infants display any color preferences. A stimulus consisting of four color patches (red, green, blue, and yellow) is projected onto the ceiling above a crib. Infants are placed in the crib, one
> The student population at the state college consists of 30% freshmen, 25% sophomores, 25% juniors, and 20% seniors. The college theater department recently staged a production of a modern musical. A researcher recorded the class status of each student en
> A recent study indicates that people tend to select video game avatars with characteristics similar to those of their creators (Bélisle & Bodur, 2010). Participants who had created avatars for a virtual community game completed a questio
> Many parents allow their underage children to drink alcohol in limited situations when an adult is present to supervise. The idea is that teens will learn responsible drinking habits if they first experience alcohol in a controlled environment. Other par
> Captive animals in laboratories or zoos benefit from environmental enrichment. In a recent experiment on the effects of enrichment on animal behavior, Robbins and Margulis (2014) compared the effects of different types of auditory enrichment on captive g
> The Internet is rapidly becoming an essential source of information about health, nutrition, finances, and current events. Neunschwander, Abbott, and Mobley (2012) were interested in inequality of access to the Internet as a function of the characteristi
> A sample of n = 9 scores has ΣX = 108. What is the sample mean?
> In a classic study, Loftus and Palmer (1974) investigated the relationship between memory for eyewitnesses and the questions they are asked. In the study, participants watched a film of an automobile accident and then were questioned about the accident.
> Parametric tests (such as t or ANOVA) differ from nonparametric tests (such as chi-square) primarily in terms of the assumptions they require and the data they use. Explain these differences.
> For the following scores, a. Sketch a scatter plot showing the six data points. b. Just looking at the scatter plot, estimate the value of the Pearson correlation. c. Compute the Pearson correlation.
> The following set of X values is the same as those used in Problem 23. For the following set of data: a. Compute the Pearson correlation statistic and compare your answer to the answer that you found for Problem 23. b. Find the linear regression equation
> The following results are from an independent-measures, two-factor study with n 5 10 participants in each treatment condition. a. Use a two-factor ANOVA with a = .05 to evaluate the main effects and the interaction. b. Compute h2 to measure the effect si
> A researcher conducts an independent-measures, two-factor study with two levels of factor A and two levels of factor B, using a sample of n 5 8 participants in each treatment condition. a. What are the df values for the F-ratio evaluating the main effect
> The following matrix presents the results from an independent-measures, two-factor study with a sample of n = 10 participants in each treatment condition. Note that one treatment mean (“M = ?”) is missing. a. What valu
> Suppose that a researcher conducts an independent samples experiment comparing three treatments. Participants serve in the experiment either online or by visiting the researcher’s lab. Scores for this hypothetical experiment are listed
> The following results are from an independent-measures, two-factor study with n = 4 participants in each treatment condition. a. Use a two-factor ANOVA with a = .05 to evaluate the main effects and the interaction. b. Test the simple effect of factor A a
> Find each of the following values for the distribution shown in the following polygon. a. n b. ΣX c. ΣX2
> Explain what happens during each of the two stages of the two-factor ANOVA.
> The following results are from an independent-measures, two-factor study with n = 5 participants in each treatment condition. a. Use a two-factor ANOVA with a = .05 to evaluate the main effects and the interaction. b. Test the simple effect of factor A a
> In a classic study of the effect of memory on caffeine, Loke (1988) studied the effect of caffeine on the serial position effect. In memory tests, the serial position effect refers to the observation that memory for items at the beginning and end of a li
> You might have heard the claim that students have specific “learning styles” and that each student learns best when the method of instruction matches their specific learning style. This claim has not held up to experim
> Emoticons, like and , are helpful for expressing emotion in communications that otherwise have limited emotional content (e.g., emails, text messages, and social media posts). Derks, Bos, and von Grumbkow (2007) conducted an independent sample experiment
> Most sports injuries are immediate and obvious, like a broken leg. However, some can be more subtle, like the neurological damage that may occur when soccer players repeatedly head a soccer ball. To examine effects of repeated heading, McAllister et al.
> Define each of the following terms: a. Factor b. Level c. Two-factor study
> Describe the similarities between an F-ratio and a t statistic.
> The following scores are from an independent-measures study comparing two treatment conditions. a. Use an independent-measures t test with a = .05 to determine whether there is a significant mean difference between the two treatments. b. Use an ANOVA wit
> To create the following data we started with the same sample means and variances that appeared in problem 29, but doubled the sample size to n = 10. a. Predict how the increase in sample size should affect the F-ratio for these data compared to the value
> For the following set of scores: a. Construct a stem and leaf plot. b. What is the shape of the distribution?
> The following data summarize the results from an independent-measures study comparing three treatment conditions. a. Use an ANOVA with a = .05 to determine whether there are any significant differences among the three treatment means. Note: Because the s
> For the preceding problem you should find that there are significant differences among the three treatments. One reason for the significance is that the sample variances are relatively small. To create the following data, we kept the same sample means th
> The following data were obtained from an independent- measures research study comparing three treatment conditions. Use an ANOVA with a = .05 to determine whether there are any significant mean differences among the treatments.
> Many know the feeling of being too groggy to take an 8 a.m. exam—we need to be more alert and aroused to do our best. Some of us also know the feeling of being too aroused by the prospect of an exam to do our best. Thus, the best level
> Why should you use ANOVA instead of several t tests to evaluate mean differences when an experiment consists of three or more treatment conditions?
> When you get a surprisingly low price on a product do you assume that you got a really good deal or that you bought a low-quality product? Research indicates that you are more likely to associate low price and low quality if someone else makes the purcha
> The following data are from a repeated-measures study examining the effect of a treatment by measuring a group of n = 9 participants before and after they receive the treatment. a. Calculate the difference scores and MD. b. Compute SS, sample variance, a
> The following data are from a repeated-measures study examining the effect of a treatment by measuring a group of n = 11 participants before and after they receive the treatment. a. Calculate the difference scores and MD. b. Compute SS, sample variance,
> How does the numerator of the repeated-measures t-statistic compare to the numerator of the single sample t-statistic?
> A repeated-measures and an independent-measures study both produce a t statistic with df = 15. How many subjects participated in each experiment?
> For the following set of scores: a. Construct a frequency distribution table. b. Sketch a histogram showing the distribution. c. What is the shape of the distribution?
> If you are using coffee to compensate for sleep loss, you might want to consider drinking your coffee under blue light. Beaven and Ekstrom (2013) recruited n 5 21 participants who completed a series of cognitive alertness and reaction time tasks under co
> Traumatic brain injury (TBI) is a significant health problem. TBI is caused by impacts to the head that might occur during contact sports, motor vehicle accidents, and similar events. TBI is known to produce cognitive impairments and reductions in brain
> A repeated-measures, a matched-subjects, and an independent-measures study all produce a t statistic with df = 10. How many participants were used in each study?
> A researcher conducts an experiment comparing two treatment conditions with 20 scores in each condition. a. If an independent-measures design is used, how many participants are needed for the study? b. If a repeated-measures design is used, how many part
> Explain the difference between a matched-subjects design and a repeated-measures design.
> To construct the following data, we started with the scores in Problem 20 and scrambled the scores in Treatment 2 to eliminate the consistency of the individual differences. a. If the data were from an independent-measures study using two separate sample
> Gamification refers to the application of game design and development to social, industrial, and educational settings. For example, a gamification program might award points or achievements to people for reaching specific goals. A recent experiment on ga
> Exercise is known to produce positive psychological effects. Interestingly, not all exercise is equally effective. It turns out that exercising in a natural environment (e.g., jogging in the woods) produces better psychological outcomes than exercising i
> Problem 17 demonstrates that removing individual differences can substantially reduce variance and lower the standard error. However, this benefit only occurs if the individual differences are consistent across treatment conditions. In Problem 17, for ex
> Playing three-dimensional video games can improve cognitive function in older adults. In a recent experiment (West et al., 2017), a sample of n = 15 older adults were instructed to play Super Mario 64 and similar 3-D games for six months. Participants’ s
> Place the following scores in a frequency distribution table. Based on the frequencies, what is the shape of the distribution?
> Swearing is a common, almost reflexive, response to pain. Whether you knock your shin into the edge of a coffee table or smash your thumb with a hammer, most of us respond with a streak of obscenities. One question, however, is whether swearing has any e
> Participants enter a research study with unique characteristics that produce different scores from one person to another. For an independent-measures study, these individual differences can cause problems. Identify the problems and briefly explain how th
> A sample of difference scores from a repeated-measures experiment has a mean of MD = 4 with a standard deviation of s = 6. a. If n = 9, is this sample sufficient to reject the null hypothesis using a two-tailed test with a = .05? b. Would you reject H0 i
> a. A repeated-measures study with a sample of n = 8 participants produces a mean difference of MD = 3 with a variance of s2 = 72. Use a two tailed hypothesis test with a = .05 to determine whether it is likely that this sample came from a population with
> a. A repeated-measures study with a sample of n = 6 participants produces a mean difference of MD = 4 with SS= 30. Use a two-tailed hypothesis test with a = .05 to determine whether this sample provides evidence of a significant treatment effect. b. Now
> There is some evidence suggesting that you are likely to improve your test score if you rethink and change answers on a multiple-choice exam (Johnston, 1975). To examine this phenomenon, a teacher gave the same final exam to two sections of a psychology
> Callahan (2009) demonstrated that Tai Chi can significantly reduce symptoms for individuals with arthritis. Participants were 18 years old or older with doctor-diagnosed arthritis. Self-reports of pain and stiffness were measured at the beginning of an e
> The stimulant Ritalin has been shown to increase attention span and improve academic performance in children with ADHD (Evans et al., 2001). To demonstrate the effectiveness of the drug, a researcher selects a sample of n = 20 children diagnosed with the
> A long history of psychology research has demonstrated that memory is usually improved by studying material on multiple occasions rather than one time only. This effect is commonly known as distributed practice, or spacing effects. In a recent paper exam
> Does posting calorie content for menu items affect people’s choices in fast-food restaurants? According to results obtained by Elbel, Gyamfi, and Kersh (2011), the answer is no. The researchers monitored the calorie content of food purchases for children
> Draw a polygon for the distribution of scores shown in the following table.
> Research results suggest a relationship between the TV viewing habits of 5-year-old children and their future performance in high school. For example, Anderson, Huston, Wright, and Collins (1998) report that high school students who regularly watched Ses
> Two separate samples receive different treatments. After treatment, the first sample has n = 5 with SS = 60, and the second has n = 9 with SS = 84. a. Compute the pooled variance for the two samples. b. Calculate the estimated standard error for the samp
> One sample has SS = 80 and a second sample has SS = 48. a. If n = 17 for both samples, find each of the sample variances, and calculate the pooled variance. Because the samples are the same size, you should find that the pooled variance is exactly halfwa
> In 1974, Loftus and Palmer conducted a classic study demonstrating how the language used to ask a question can influence eyewitness memory. In the study, college students watched a film of an automobile accident and then were asked questions about what t

