Question: How much variability is the rein loan
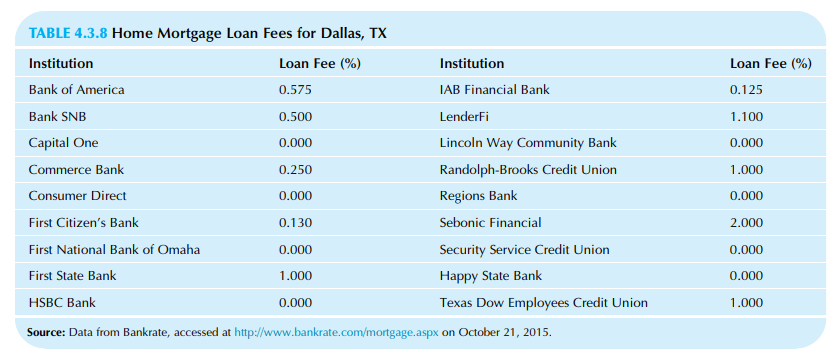
How much variability is the rein loan fees for home mortgages? Find and interpret the standard deviation, range, and coefficient of variation for the data in Table 4.3.8 of Chapter 4.
Table 4.3.8:
Transcribed Image Text:
TABLE 4.3.8 Home Mortgage Loan Fees for Dallas, TX Institution Loan Fee (%) Institution Loan Fee (%) Bank of America 0.575 IAB Financial Bank 0.125 Bank SNB 0.500 LenderFi 1.100 Capital One 0.000 Lincoln Way Community Bank 0.000 Commerce Bank 0.250 Randolph-Brooks Credit Union 1.000 Consumer Direct 0.000 Regions Bank 0.000 First Citizen's Bank 0.130 Sebonic Financial 2.000 First National Bank of Omaha 0.000 Security Service Credit Union 0.000 First State Bank 1.000 Happy State Bank 0.000 HSBC Bank 0.000 Texas Dow Employees Credit Union 1.000 Source: Data from Bankrate, accessed at http://www.bankrate.com/mortgage.aspx on October 21, 2015.
> Would the average-based procedure they are currently using ordinarily be a good method? Or is it fundamentally flawed? Justify your answers.
> a. What is the variance? b. What are the measurement units of the variance? c. Which is the more easily interpreted variability measure, the standard deviation or the variance? Why? d. Once you know the standard deviation, does the variance provide any a
> a. What is the standard deviation? b. What does the standard deviation tell you about the relationship between individual data values and the average? c. What are the measurement units of the standard deviation? d. What is the difference between the samp
> When each data value is multiplied by a fixed number, what happens to a. The average, median, and mode? b. The standard deviation and range? c. The coefficient of variation?
> What is a weighted average? When should it be used instead of a simple average?
> What is the average? Interpret it in terms of the total of all values in the data set.
> What is an outlier? How do you decide whether a data point is an outlier or not?
> What is a percentile? In particular, is it a percentage (e.g., 23%), or is it specified in the same units as the data (e.g., $35.62)?
> How do you usually define the mode for a quantitative data set? Why is this definition ambiguous?
> Consider the cumulative distribution function: a. What is it? b. How is it drawn? c. What is it used for? d. How is it related to the histogram and box plot?
> What kinds of trouble do outliers cause?
> View each column as a collection of independent observations of a random variable. a. In each case, what kind of variable is represented, continuous or discrete? Why? b.* Consider the event “annual salary is above $40,000.” Find the value of the binomial
> Why is it important in a report to explain how you dealt with an outlier?
> What is a bimodal distribution? What should you do if you find one?
> Why is it important to identify the source of funding when evaluating the results of a statistical study?
> Distinguish between primary and secondary data.
> Differentiate between probability and statistics.
> Differentiate between time-series data and cross sectional data.
> What is the difference between ordinal and nominal qualitative data?
> What is the main problem with skewness? How can it be solved in some cases?
> What is the difference between discrete and continuous quantitative variables?
> What is the difference between a histogram and a bar chart?
> Answer the parts of exercise 1 using experience in place of annual salary. Data from exercise 1: Break down the annual salaries into three groups according to training level (A, B, or C). a.* Draw box plots to compare these three groups. Comment on wha
> What can you gain by exploring data in addition to looking at summary results from an automated analysis?
> Why is random sampling a good method to use for selecting items for study?
> What general questions can be answered by analysis of a. Univariate data? b. Bivariate data? c. Multivariate data?
> What are the five basic ways in which data sets can be classified?
> List and briefly describe the different methods for summarizing a data set.
> Consider the quality of cars, as measured by the number of cars requiring extra work after assembly, in each day’s production for 15 days: 30, 34, 9, 14, 28, 9, 23, 0, 5, 23, 25, 7, 0, 3, 24 a. Find the average number of defects per day. b. Find the medi
> Your firm is considering the introduction of a new toothpaste. At a strategy session, it is agreed that a marketing study will be successful with probability 0.65. It is also agreed that the probability of a successful product launch is 0.40. However, gi
> You are operations manager for a plant that produces copy machines. At the end of the day tomorrow, you will find out how many machines were produced and, of these, how many are defective. a. Describe the random experiment identified here. b. What is the
> The coming year is expected to be a good one with probability0.70. Given that it is a good year, you expect that a dividend will be declared with probability 0.90. However, if it is not a good year, then a dividend will occur with probability 0.20. a. Dr
> There are two locations in town (north and south) under consideration for a new restaurant, but only one location will actually become available. If it is built in the north, the restaurant stands a 90% chance of successfully surviving its first year. Ho
> Answer the parts of exercise 1 using age in place of annual salary. Data from exercise 1: Break down the annual salaries into three groups according to training level (A, B, or C). a.* Draw box plots to compare these three groups. Comment on what you s
> Your firm is planning a new style of advertising and figures that the probability of increasing the number of customers is 0.63, while the probability of increasing sales is 0.55. The probability of increasing sales given an increase in the number of cus
> It is currently difficult to hire in the technology sector. Your company believes that the chances of successfully hiringthisyearare0.13.Giventhatyourcompanyissuccessful in hiring, the chances of finishing the project on time are 0.78, but if hiring is n
> A repair shop has two technicians with different levels of training. The technician with advanced training is able to fix problems 92% of the time, while the other has a success rate of 80%. Assume you have a 30% chance of obtaining the technician with a
> The human resources department of a company is considering using a screening test as part of the hiring process for new employees and is analyzing the results of a recent study. It was found that 63% of applicants score high on the test, but only 79% of
> Your company maintains a database within formation on your customers, and you are interested in analyzing patterns observed over the past quarter. In particular, 23% of customers in the database placed new orders within this period. However, for those cu
> Two events are mutually exclusive, one with probability 0.38 and the other with probability 0.54. a. Find the conditional probability that the first event happens given that the second event happens. b. Find the probability of the union of these two even
> Your firm has classified orders as either large or small in dollar amounts and as either light or heavy in shipping weight. In the recent past, 28% of orders have been large dollar amounts, 13% of orders have been heavy, and 10% of orders have been large
> The probability of getting a big order currently under negotiation is 0.32. The probability of losing money this quarter is 0.54. a. Assume that these are mutually exclusive events. Find the probability of getting the order or losing money this quarter.
> As a stock market analyst for a major brokerage house, you are responsible for knowing everything about the automotive companies. In particular, Ford is scheduled to release its net earnings for the past quarter soon, and you do not know what that number
> Based on a demand analysis forecast, a factory plans to produce 80,000 video game cartridges this quarter, on average, with an estimated uncertainty of 25,000 cartridges as the standard deviation. The fixed costs for this equipment are $72,000 per quarte
> Break down the annual salaries into three groups according to training level (A, B, or C). a.* Draw box plots to compare these three groups. Comment on what you see. b.* Find the average for each training level, and comment. c.* Find the between-sample a
> Repeat problem 6 with the extreme outlier omitted, and write a paragraph comparing the results with and without the outlier. Data from problem 6: Consider the number of executives for all Seattle corporations with 500 or more employees 19: 12, 15, 5, 1
> Consider the number of executives for all Seattle corporations with 500 or more employees 19: 12, 15, 5, 16, 7, 18, 15, 12, 4, 3, 22, 4, 12, 4, 6, 8, 4, 5, 6, 4, 22, 10, 11, 4, 7, 6, 10, 10, 7, 8, 26, 9, 11, 41, 4, 16, 10, 11, 12, 8, 5, 9, 18, 6, 5 a. Fi
> Consider the assets of stock mutual funds, as shown in Table 5.5.3. Answer the parts of the previous problem using the column of assets instead of the rates of return. Table 5.5.3: TABLE 5.5.3 Natural Resources Mutual Funds: Rates of Return (12 mo
> Using the data from Table 2.6.7 of Chapter 2 for the 30 Dow Jones Industrial companies percent changes since January 2015: a. Find the standard deviation of the percent change. b. Find the range of the percent change. Table 2.6.7: TABLE 2.6.7 Closi
> Use the data set from problem 21 of Chapter 3 on poor quality in the production of electric motors. a. Find the standard deviation and range to summarize the typical batch-to-batch variability in quality of production. b. Remove the two outliers and re c
> Using the data from Table 3.8.4 in Chapter 3 for the market values of the portfolio investments of College Retirement Equities Growth Fund (CREF) in the media sector: a. Find the standard deviation of portfolio value for these firms’ st
> For the municipal bond yields of Table 3.8.1 in Chapter 3: a. Find the standard deviation of the yield. b. Find the range. c. Find the coefficient of variation. d. Use these summaries to describe the extent of variability among these yields. Table 3.8.1
> For the international goods and services tax data of Table 5.5.10, which shows these taxes as a percentage of GDP (gross domestic product, a measure of total national economic activity) and as a percentage of revenue: a. Draw a box plot for each variable
> Different countries have different taxation strategies: Some tax income more heavily than others, while others concentrate on goods and services taxes. Consider the relative size of goods and services taxes for selected countries’ inter
> Write a three- to five-page report summarizing the relationship between gender and salary for these employees. Be sure to discuss the results of the following statistical analyses: (a) a two-sample t-test of male salaries against female salaries and (b)
> Consider the return on equity, expressed like an interest rate in percentage points per year, for a sample of companies: 5.5, 10.6, 19.0, 24.5, 6.6, 26.8, 6.2, 2.4, 28.3, 2.3 a. Find the average and standard deviation of the return on equity. b. Interpre
> Samples from the mine show the following percentages of gold: 1.1, 0.3, 1.5, 0.4, 0.8, 2.2, 0.7, 1.4, 0.2, 4.5, 0.2, 0.8 a. Compute and interpret the sample standard deviation. b. Compute and interpret the coefficient of variation. c. Which data value ha
> Here are first-year sales (in thousands) for some recent new product introductions that are similar to one you are considering. 10, 12, 16, 47, 39, 22, 10, 29 a. Find the average and standard deviation. Interpret the standard deviation. b. After you went
> Consider the following productivity measures (on a scale from 0 to 100) for a population of employees: 85.7, 78.1, 69.1, 73.3, 86.8, 72.4, 67.5, 76.8, 80.2, 70.0 a. Find the average productivity. b. Find and interpret the standard deviation of productivi
> Consider the annualized stock return over the decade from 2000 to 2010, July to July, expressed as an annual interest rate in percentage points per year, for major pharmaceutical companies as shown in Table 5.5.2. For these top firms in this industry gro
> Here are rates of return for a sample of recent on-site service contracts: 78.9%, 22.5%, 5.2%, 997.3%, 20.7%, 13.5%, 429.7%, 88.4%, 52.1%, 960.1%, 38.8%, 70.9%, 73.3%, 47.0%, 1.5%, 23.9%, 35.6%, 62.0%, 75.7%, 14.0%, 81.2%, 46.9%, 135.1%, 34.6%, 85.3%, 73
> Consider the variability in traffic congestion in Table 5.5.5 for northeastern and for southwestern cities. a. Compare population variability of these two groups of cities. In particular, which group shows more variability in congestion from city to city
> We have all been stopped by traffic at times and have had to sit there while freeway traffic has slowed to a crawl. If you have someone with you (or some good music), the experience may be easier to put up with, but what does traffic congestion cost soci
> You have been trying to control the weight of a chocolate and peanut butter candy bar by intervening in the production process. Table 5.5.4 shows the weights of two representative samples of candy bars from the day’s production, one tak
> Let us compare the distribution of the number of lifetime gifts of those who made a current donation to that of those who did not. We will use two data sets, each indicating the number of gifts (life time gifts, previous to this mailing) given by the 20,
> Consider the prediction of annual salary from age alone (as compared to exercise 1, where experience was also used as an X variable). a. Find the regression equation to predict annual salary from age. b. Using results from part a of exercise 1 and this e
> Consider the number of gifts (lifetime gifts, previous to this mailing) given by the 20,000 people represented in the donations database (on the companion site). a. Find the average and standard deviation. b. Draw a histogram for this data set. Indicate
> Planning to start an advertising agency? Table 5.5.1 reports the size of account budgets, within the Internet category, for selected firms. a. Find the average budget size. b. Find the standard deviation of budget sizes, viewing these firms as a sample o
> The beta of a firm’s stock indicates the degree to which changes in stock price track changes in the stock market as a whole and is interpreted as the market risk of the portfolio. A beta of 1.0 indicates that, on average, the stock rises (or falls) the
> Consider the profits of health care companies in the Fortune 500, as shown in Table 4.3.3 a. Draw a histogram of this data set, and briefly describe the shape of the distribution. b. Find the profit of the average firm. c. Find the median profit level. d
> A wine store carries 86 types of wine produced in 2007, 125 types from 2008, 73 from 2009, and 22 from 2010. Identify the types of wine as the elementary units for analysis. a. Find the mode of the year of production. What does this tell you? b. Find the
> Consider the running times of selected films from a video library as shown in Table 4.3.10. a. Find the average running time. b. Find the median running time. c. Which is larger, the average or the median? Based on your answer, do you expect to find stro
> Using the data from Table 3.8.4 in Chapter 3, for the market values of the portfolio investments of College Retirement Equities Growth Fund in the media sector: a. Find the average market value for these firms’ stock in CREFâ€
> For the yields of municipal bonds (Table 3.8.1 in Chapter 3): a. Find the average yield. b. Find the median yield. c. Find the quartiles. d. Find the five-number summary. e. Draw a box plot of these yields. f. Identify the outliers, if any, and draw a de
> Consider the percentage change in the value of the dollar with respect to Asia-Pacific currencies, year-to-date as of mid-October 2015 (Table 4.3.9). a. Find the average percentage change in the value of the dollar, averaging over all of these countries.
> Consider the monthly sales of 17selectedsalesrepresentatives (in thousands of dollars): 23, 14, 26, 22, 28, 21, 34, 25, 32, 32, 24, 34, 22, 25, 22, 17, 20 a. Find the average and median. b. Draw the box plot.
> Consider the prediction of annual salary from age and experience. a. Find and interpret the regression equation and regression coefficients. b. Find and interpret the standard error of estimate. c. Find and interpret the coefficient of determination. d.
> Consider the following list of your products’ share of 20 major metropolitan areas: 0.7%, 20.8%, 2.3%, 7.7%, 5.6%, 4.2%, 0.8%, 8.4%, 5.2%, 17.2%, 2.7%, 1.4%, 1.7%, 26.7%, 4.6%, 15.6%, 2.8%, 21.6%, 13.3%, 0.5% a. Find the average and the median. b. Draw a
> Consider the strength of cotton yarn used in a weaving factory, in pounds of force at breakage, measured from a sample of yarn from the supplies room: 117, 135, 94, 79, 90, 85, 173, 102, 78, 85, 100, 205, 93, 93, 177, 148, 107 a. Find the average breakin
> Consider the loan fees charged for granting home mortgages, as shown in Table 4.3.8, for Dallas TX, 30-year fixed rate for home purchase, with credit Score 740+, and with 20% down payment. These are given as a percentage of the loan amount and are one-ti
> Table 4.3.7 shows percent increases from the offer price of initial public stock offerings, as most of these newly traded companies increased in value, whereas some of them lost money. a. Draw a cumulative distribution function for this dataset. b. Find
> Consider the revenues (in $ millions) for the top 12 companies in the Fortune 500 (from http://fortune.com/ fortune500/ accessed October 20, 2015.), as shown in Table 4.3.6. a. Find the five-number summary. b. Draw a box plot. Table 4.3.6: TABLE 4.
> Consider the percent change in housing values over a five-year period for regions of the United States, as shown in Table 4.3.5. a. Find the mean and median percent change in housing values. b. Find the five-number summary for this data set. c. Draw a bo
> You have begun a quality improvement campaign in your paper mill, and, as a result, lots of pieces of paper come to your desk. Each one describes a recent problem with customers according to the following codes: A = paper unavailable, B = paper too thick
> Consider the 20,000 people in the donations database (on the companion site). a. Construct box plots to compare median household income and per capita income (these specify two columns in the database) by putting the two box plots on the same scale. b. D
> Using the data from Table 2.6.8 of Chapter 2 for daily values for the Dow Jones Industrial Average: a. Find the mean net change. b. Find the median net change. c. Find the five-number summary for net change. d. Draw a box plot for net change. e. Find the
> Using the data from Table 2.6.7 of Chapter 2 for the 30 Dow Jones Industrial companies percent changes since January 2015: a. Find the mean percent change. b. Find the median percent change. c. Find the five-number summary for percent change. d. Draw the
> Consider predicting annual salary from age, experience, and an interaction term. a. Create a new variable, “interaction,” by multiplying age by experience for each employee. b. Find the regression equation to predict annual salary from age, experience, a
> Many marketers assumed that consumers would go for reduced-calorie foods in a big way. While these “light” foods caught on to some extent, they hadn’t yet sold in the large quantities their producers
> Use the data set from problem 21 of Chapter 3 on poor quality in the production of electric motors. a. Find the average and median to summarize the typical level of problems with quality of production. b. Remove the two outliers, and re compute the avera
> Consider the 20,000 median household income values in the donations database (available on the companion site). These represent the median household income for the neighborhood of each potential donor in the database. a. Construct a cumulative distributi
> Consider the data on CEO compensation in computer programming, data processing, and other related services firms from Table 3.8.7 of Chapter 3. a. Draw a detailed box plot. b. Find the 10th percentile of compensation. Table 3.8.7: TABLE 3.8.7 CEOo
> Consider the costs charged for treatment of heart failure and shock by hospitals in the Puget Sound area, using the data from Table 3.8.6 of Chapter 3. a. Summarize the costs. b. Draw a box plot. c. Draw a cumulative distribution function. d. If your hos
> Recall in the example on CEO compensation by prepackaged software companies from Chapter 3 that we identified an outlier (Lawrence J. Ellison of Oracle Corp, with compensation of $56.81 million). a. Draw a detailed box plot for this dataset. How many out
> Consider the following list of your product’s market share of 20 major metropolitan areas: 0.7%, 20.8%, 2.3%, 7.7%, 5.6%, 4.2%, 0.8%, 8.4%, 5.2%, 17.2%, 2.7%, 1.4%, 1.7%, 26.7%, 4.6%, 15.6%, 2.8%, 21.6%, 13.3%, 0.5%. a. Construct an appropriate histogram
> Consider the 20,000 median household income values in the donations database (available at the companion site). These represent the median household income for the neighborhood of each potential donor in the database. a. Construct a histogram. b. Describ
> Using the data from Table 2.8 of Chapter 2 for daily values for the Dow Jones Industrial Average: a. Construct a histogram for net change during September 2015. b. Describe the shape of the distribution. c. Construct a histogram for percent change during
> Using the data from Table 2.7 of Chapter 2 for the 30 Dow Jones Industrial companies: a. Construct a histogram for percent change since January 2015. b. Describe the shape of the distribution. Table 2.7: TABLE 2.6.7 Closing Price and Year-to-Date P
> Now examine the effect of training level on annual salary, with and without adjusting for age and experience. a. Find the average annual salary for each of the three training levels and compare them. b. Find the multiple regression equation to predict an
> Consider the following list of prices (in dollars) charged by different pharmacies for 12 60-mg tablets of the prescription drug Tylenol No. 4 with codeine: 17 6.75, 12.19, 9.09, 9.09, 13.09, 13.45, 7.89, 12.00, 10.49, 15.30, 13.29. a. Construct a histog

