Question: In the article “Randomized Stratified Sampling
In the article “Randomized Stratified Sampling Methodology for Water Quality in Distribution Systems” (Journal of Water Resources Planning and Management, Vol. 130, Issue 4, pp. 330–338), V. Speight et al. proposed the method of stratified sampling to collect water samples for water-quality testing. The following table separates the Durham, North Carolina water distribution system into strata based on distance from the nearest treatment plant.
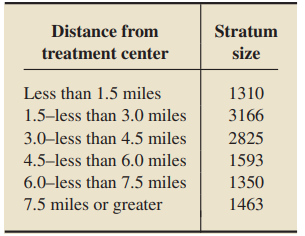
Use the table to design a procedure for obtaining a stratified sample (with proportional allocation) of 80 water samples from Durham.
> The National Center for Health Statistics publishes information on the duration of marriages in Vital Statistics of the United States. Which measure of center is more appropriate for data on the duration of marriages, the mean or the median? Explain your
> An integral part of doing business in the dot-com culture of the late 1990s was frequenting the party circuit centered in San Francisco. Here high-tech companies threw as many as five parties a night to recruit or retain talented workers in a highly comp
> Regarding z-scores: a. How is a z-score obtained? b. What is the interpretation of a z-score? c. An observation has a z-score of 2.9. Roughly speaking, what is the relative standing of the observation?
> Regarding outliers: a. What is an outlier? b. Explain how you can identify potential outliers, using only the first and third quartiles.
> Regarding the five-number summary: a. Identify its components. b. How can it be employed to describe center and variation? c. What graphical display is based on it?
> A data set of size 152 with roughly a bell-shaped distribution has mean 25 and standard deviation 4. Approximately how many observations lie between 17 and 33?
> A data set with roughly a bell-shaped distribution has mean 45 and standard deviation 12. Approximately what percentage of the observations lie between 33 and 57?
> Define a. descriptive measures. b. measures of center. c. measures of variation.
> Research by W. Clark and L. Midanik (Alcohol Consumption and Related Problems: Alcohol and Health Monograph 1. DHHS Pub. No. (ADM) 82–1190) examined, among other issues, alcohol consumption patterns of U.S. adults by marital status. Data for marital stat
> A quantitative data set has been grouped by using limit grouping with equal-width classes. The lower and upper limits of the first class are 3 and 8, respectively, and the class width is 6. a. What is the class mark of the second class? b. What are the l
> When is the use of single-value grouping particularly appropriate?
> Some users of statistics prefer pie charts to bar charts because people are accustomed to having the horizontal axis of a graph show order. For example, someone might infer from “Republican” is less than “Other” because “Republican” is shown to the left
> In a bar chart, unlike in a histogram, the bars do not abut. Give a possible reason for that.
> Identify two main types of graphical displays that are used for qualitative data.
> What is the relationship between a frequency or relative frequency distribution of a quantitative data set and that of a qualitative data set?
> For a qualitative data set, what is a a. frequency distribution? b. relative-frequency distribution?
> The U.S. Census Bureau divides the states in the United States into nine divisions: East North Central (ENC), East South Central (ESC), Middle Atlantic (MAC), Mountain (MTN), New England (NED), Pacific (PAC), South Atlantic (SAC), West North Central (WNC
> Firearms, live ammunition, and spent cartridge casings are often submitted to crime laboratories to be processed for latent fingerprints. B. Maldonado explored the chances of successfully recovering fingerprints in the article, “Study on Developing Laten
> From the ESPN Web site, we obtained the age of the oldest player on each of the major league baseball teams during one season. Here are the data. a. Construct a dotplot for these data. b. Use your dotplot from part (a) to identify the modality and symmet
> Provide a reason why the classification of data is important.
> The Air Travel Consumer Report is a monthly product of the Department of Transportation’s Office of Aviation Enforcement and Proceedings. The report is designed to assist consumers with information on the quality of services provided by the airlines. Fol
> The Prescott National Bank has six tellers available to serve customers. The data in the following table provide the number of busy tellers observed during 25 spot checks. a. Use single-value grouping to organize these data into frequency and relative-fr
> In the article “Comparing the lifetime of two brands of batteries” (Journal of Statistics Education, Vol. 21, No. 1, pp. 1–19) by P. Dunn, two brands of AA alkaline batteries were compared. The following table gives the number of pulses required for a sa
> Refer to Problem 19. Construct a stem and-leaf diagram for the inauguration ages of the first 44 presidents of the United States. a. Use one line per stem. b. Use two lines per stem. c. Which of the two stem-and-leaf diagrams that you just constructed co
> Refer to Problem 19. Construct a dotplot for the ages at inauguration of the first 44 presidents of the United States. Data from Problem 19: From the Information Please Almanac, we obtained the ages at inauguration for the first 44 presidents of the Uni
> This problem is about data. a. What are data? b. How is data type determined?
> From the Information Please Almanac, we obtained the ages at inauguration for the first 44 presidents of the United States (from George Washington to Barack H. Obama). a. Identify the classes for grouping these data, using limit grouping with classes of
> Refer to Example: a. Explain why a frequency histogram of the DVD prices with single-value classes would be essentially identical to the dotplot. b. Would the dotplot and a frequency histogram be essentially identical with other than single-value classes
> According to Wikipedia, the world’s five largest hydroelectric plants, based on installed capacity, are as shown in the following table. Capacities are in megawatts. a. What type of data is given in the first column of the table? b. What type of data is
> A variable of a population has a left-skewed distribution. a. If a large simple random sample is taken from the population, roughly what shape will the distribution of the sample have? Explain your answer. b. If two simple random samples are taken from t
> The Japan Automobile Manufacturers Association provides data on exported vehicles in Motor Vehicle Statistics of Japan. In 2010, cars, trucks, and buses constituted 88.3%, 9.3%, and 2.4% of vehicle exports, respectively. A random sample of last year’s ex
> Draw a smooth curve that represents a symmetric trimodal (three-peak) distribution.
> Sketch the curve corresponding to each of the following specific distribution shapes. a. Bell shaped b. Triangular c. Reverse J shaped d. Uniform
> Explain the relative positioning of the bars in a histogram to the numbers that label the horizontal axis when each of the following quantities is used to label that axis. a. Lower class limits b. Lower class cutpoints c. Class marks d. Class midpoints
> A quantitative data set has been grouped by using cutpoint grouping with equal-width classes of width 8. a. If the midpoint of the first class is 10, what are its lower and upper cutpoints? b. What is the class midpoint of the second class? c. What are t
> A quantitative data set has been grouped by using cutpoint grouping with equal-width classes. a. If the lower and upper cutpoints of the first class are 5 and 15, respectively, what is the common class width? b. What is the midpoint of the second class?
> A quantitative data set has been grouped by using limit grouping with equal-width classes of width 5. The class limits are whole numbers. a. If the class mark of the first class is 8, what are its lower and upper limits? b. What is the class mark of the
> The U.S. National Oceanic and Atmospheric Administration publishes temperature data in Climatography of the United States. According to that document, the annual average maximum and minimum temperatures for selected cities in the United States are as pro
> Life expectancy is the average number of years to be lived by a group of people born in the same year if mortality at each age remains constant in the future. From the World FactBook, published by the Central Intelligence Agency (CIA), we obtained the li
> The U.S. Department of Agriculture collects data pertaining to the value of agricultural exports and publishes its findings in U.S. Agricultural Trade Update. For one year, the values of these exports, by state, are provided on the WeissStats site. Data
> In the article “Graphical Display of Two Way Contingency Tables” (The American Statistician, Vol. 28, No. 1, pp. 9–12), R. Snee presented data on hair color and eye color among 592 students in an elementary statistics course at the University of Delaware
> The National Center for Health Statistics collects data on health insurance coverage status and coverage type. The following data from the National Health Interview Survey provides the frequency, in millions, of the current health status for persons aged
> The following graph is based on one that appeared in an Arizona Republic newspaper article entitled “Hand That Rocked Cradle Turns to Work as Women Reshape U.S. Labor Force.” The graph depicts the labor force participation rates for the years 1960, 1980,
> In the article, “Squeaky Clean Fossil Fuels” (New Scientist, Vol. 186, No. 2497, p. 26), F. Pearce reported on the benefits of using clean fossil fuels that release no carbon dioxide (CO2), helping to reduce the threat of global warming. One technique of
> An experiment is to be conducted to compare four different brands of gasoline for gas mileage. a. Suppose that you randomly divide 24 cars into four groups of6 cars each and then randomly assign the four groups to the four brands of gasoline, one group p
> A classic study, conducted in 1935 by B. Lowe at the Iowa Agriculture Experiment Station, analyzed differences in the amount of fat absorbed by doughnuts in cooking with four different fats. For the experiment, 24 batches of doughnuts were randomly divid
> Designing medication packaging that resists opening by children, but yields readily to adults, presents numerous challenges. In the article “Painful Design” (American Scientist, Vol. 93, No. 2, pp. 113–118), H. Petroski examined the packaging used for Al
> In “Effects of Plant Density on Tomato Yields in Western Nigeria” (Experimental Agriculture, Vol. 12(1), pp. 43–47), B. Adelana reported on the effect of tomato variety and planting density on yield. Four tomato varieties (Harvester, Pusa Early Dwarf, If
> An issue of Inside MS contained an article describing AVONEX (interferon beta-1a), a drug used in the treatment of relapsing forms of multiple sclerosis (MS). Included in the article was a report on “. . . adverse events and selected laboratory abnormali
> Refer to Problem 17. a. Use systematic random sampling to obtain a sample of 15 athletes. b. In this case, is systematic random sampling an appropriate alternative to simple random sampling? Explain your answer. Data from Problem 17: As part of ESPN’s S
> The article “Study Links Hepatitis B and Cancer of Pancreas” by D. Grady, appeared in the September 29, 2008 issue of the NewYork Times. It reported that, for the first time, a study showed that people with pancreatic cancer are more likely than those wi
> An American roulette wheel contains 18 red numbers, 18 black numbers, and 2 green numbers. The following table shows the frequency with which the ball landed on each color in 200 trials.
> The National Association of Colleges and Employers(NACE) compiles information on salary offers to new college graduates and publishes the results in Salary Survey
> We presented selected OECD healthcare data for the 34 member countries for the year 2011 or, in a few cases, the nearest year to that. Recall that % GDP is an abbreviation for “healthcare expenditures as a percentage of gross domestic product,” LE for “l
> An article appearing in the Los Angeles Times discussed the study “Leisure Activities and the Risk of Dementia in the Elderly” (New England Journal of Medicine, Vol. 348, pp. 2508–2516) by J. Verghese et al. The article in the Times, titled “Crosswords R
> TalkBack Live, a production of CNN, conducted on-line surveys on various issues. One survey, called a QuickVote, of 680 people asked “Would you vote for a third-party candidate?” Of the 680 people surveyed, 608 (89.4%) responded “yes” and 72 (10.6%) resp
> As part of ESPN’s SportsCenturyRetrospective, a panel chosen by ESPN ranked the top 100 North American athletes of the twentieth century. For a class project, you are to obtain a simple random sample of 15 of these 100 athletes and briefly describe their
> From the FlightStats On-time Performance Report Summary, we found that, in July 2013, the top five North American airlines in terms of percentage of on-time arrivals were Hawaiian (H), Horizon (Z), Compass (C), Alaska (A), and Jazz (J). a. List the 10 p
> A researcher wants to estimate the average income of parents of college students. To accomplish that, he surveys a sample of 250 students at Yale. Is this a representative sample? Explain your answer.
> In an issue of Discover (Vol. 26, No. 2, pp. 10–11), J. Netting described the research of E. Tibbetts of the University of Arizona in the article, “The Kind of Face Only a Wasp Could Trust.” Tibbetts found that wasps signal their strength and status with
> An article appearing in an issue of the Arizona Republic reported on a study conducted by G. Duncan of the University of Michigan. According to the report, “Persistent poverty during the first 5 years of life leaves children with IQs 9.1 points lower at
> In the article “Food Allergy Advice May Be Peanuts” (Science News, Vol. 174, No. 12, pp. 8–9), N. Seppa reports that early exposure to peanuts seems to lessen the risk of nut allergy. Of 4000 Jewish children sampled in Britain, 1.85% had peanut allergies
> Research by G. Visser and C. Barker in “A Geography of British Backpacker Tourists in South Africa” (Geography, Vol. 89, No. 3, pp. 226–239) reflected on the impact of British backpacker tourists visiting South Africa. A sample of British backpackers was
> In a national poll taken on August 7–11, 2013, by Gallup, Inc., 1039 adults who were employed full or part time were asked the following question: “If you won 10 million dollars in the lottery, would you continue to work, or would you stop working?” Sixt
> Drug dealer motivation is traditionally attributed to greed or social pressures. Researchers R. Highland and D. Dabney explore possible personality characteristics as a motivation in the article “Using Adlerian Theory to Shed Light on Drug Dealer Motivat
> From ESPN MLB Scoreboard, we obtained the following major league baseball scores for August 14, 2013. Is this study descriptive or inferential? Explain your answer.
> Identify and explain the significance of the three basic principles of experimental design.
> Describe each of the following sampling methods and indicate conditions under which each is appropriate. a. Systematic random sampling b. Cluster sampling c. Stratified random sampling with proportional allocation
> Which of the following sampling procedures involve the use of probability sampling? a. A college student is hired to interview a sample of voters in her town. She stays on campus and interviews 100 students in the cafeteria. b. A pollster wants to interv
> Explain the meaning of a. a representative sample. b. probability sampling. c. simple random sampling.
> Before planning and conducting a study to obtain information, what should be done?
> Regarding observational studies and designed experiments: a. Describe each type of statistical study. b. With respect to possible conclusions, what important difference exists between these two types of statistical studies?
> the Focus database and Focus sample contain information on the undergraduate students at the University of Wisconsin - Eau Claire (UWEC). Now would be a good time for you to review the discussion about these data sets. Suppose that you want to conduct ex
> The Focus database and Focus sample contain information on the undergraduate students at the University of Wisconsin - Eau Claire (UWEC). Now would be a good time for you to review the discussion about these data sets. Begin by opening the Focus sample (
> Focus database and Focus sample contain information on the undergraduate students at the University of Wisconsin Eau Claire (UWEC). Now would be a good time for you to review the discussion about these data sets. The following problems are designed for u
> The Association of American Medical Colleges (AAMC) compiles data on medical school faculty and publishes the results in AAMC Faculty Roster. The following table presents a frequency distribution of rank for medical school faculty during one year.
> The Focus database and Focus sample contain information on the undergraduate students at the University of Wisconsin - Eau Claire (UWEC). Now would be a good time for you to review the discussion about these data sets. Open the Focus sample worksheet (Fo
> Focus database and Focus sample contain information on the undergraduate students at the University of Wisconsin - Eau Claire (UWEC). Now would be a good time for you to review the discussion about these data sets. a. Open the Focus sample (FocusSample)
> The Focus database and Focus sample contain information on the undergraduate students at the University of Wisconsin - Eau Claire (UWEC). Now would be a good time for you to review the discussion about these data sets. a. For each of the following variab
> The Focus database and Focus sample contain information on the undergraduate students at the University of Wisconsin - Eau Claire (UWEC). Now would be a good time for you to review the discussion about these data sets. Open the Focus sample worksheet (Fo
> The Focus database and Focus sample contain information on the undergraduate students at the University of Wisconsin - Eau Claire (UWEC). Now would be a good time for you to review the discussion about these data sets. Open the Focus sample worksheet (Fo
> The Focus database and Focus sample contain information on the undergraduate students at the University of Wisconsin - Eau Claire (UWEC). Now would be a good time for you to review the discussion about these data sets. Open the Focus sample worksheet (F
> The Focus database and Focus sample contain information on the undergraduate students at the University of Wisconsin - Eau Claire (UWEC). Now would be a good time for you to review the discussion about these data sets. Open the Focus sample worksheet (Fo
> The Focus database and Focus sample contain information on the undergraduate students at the University of Wisconsin - Eau Claire (UWEC). Now would be a good time for you to review the discussion about these data sets. Open the Focus sample worksheet (Fo
> The Focus database and Focus sample contain information on the undergraduate students at the University of Wisconsin—Eau Claire (UWEC). Now would be a good time for you to review the discussion about these data sets. According to ACT High School Profile
> Focus sample contain information on the undergraduate students at the University of Wisconsin - Eau Claire (UWEC). Now would be a good time for you to review the discussion about these data sets. a. Open the Focus sample (FocusSample) in the statistical
> The Higher Education Research Institute of the University of California, Los Angeles, publishes information on characteristics of incoming college freshmen in The American Freshman. In 2000, 27.7% of incoming freshmen characterized their political views
> Explain two ways in which descriptive statistics and inferential statistics are interrelated.
> Identify some methods used in descriptive statistics.
> What are the two major types of statistics? Describe them in detail.
> Define the following terms: a. Population b. Sample
> A nationwide survey of 1000 U.S. adults, conducted in March 2013 by Rasmussen Reports (field work by Pulse Opinion Research, LLC), found that 50% of respondents favored a plan to break up the 12 megabanks, which then controlled about 69% of the banking i
> In an article titled “Who has designs on your student’s minds?” author G. Brumfiel postulated that support for Darwinism increases with level of education. The following table provides percentages of U.S. adults, by educational level, who believe that ev
> In a June 2013 article, published online by The Street, B. O’Connell discussed the results of a survey on opportunities for graduating college students. In one aspect of the survey, the following percentage estimates were reported on which college majors
> From the Stock Performance Guide, published online by 1stock1 on the website 1Stock1.com, we found the closing values of the Dow Jones Industrial Averages as of the end of December for the years 2004 through 2013.
> The U.S. Substance Abuse and Mental Health Services Administration collects and publishes data on nonmedical drug use, by type of drug and age group, in National Survey on Drug Use and Health. The following table provides data for the years 2003 and 2008
> Zillow.com is an online database that provides real estate information for U.S. homes that are for rent or sale. It also presents statistics on recently sold homes. The following table gives various information on all homes sold in several different citi
> Observing that the proportion of blue M&Ms in his bowl of candy appeared to be less than that of the other colors, R. Fricker, Jr., decided to compare the color distribution in randomly chosen bags of M&Ms to the theoretical distribution reported by M&M/
> From the Statistical Abstract of the United States and the article “Average Salaries in the NBA, NFL, MLB and NHL” by J. Dorish, published on the Yahoo! Contributor Network, we obtained the following data on average professional athletes’ salaries for th
> Data from a sample of Americans yielded the following estimates of average TV viewing time per month for all Americans 2 years old and older. The times are in hours and minutes; Q1 stands for first quarter.

