Question: In the graphs for Exercise 7.33,
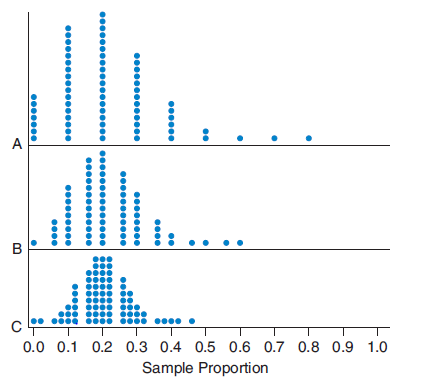
In the graphs for Exercise 7.33, explain how you can tell from the shape of the graph which has the largest sample size and which has the smallest sample size.
Graph from exercise 7.33:
> According to the National Health Center, the heights of 6-year-old girls are Normally distributed with a mean of 45 inches and a standard deviation of 2 inches. a. In which percentile is a 6-year-old girl who is 46.5 inches tall? b. If a 6-year-old girl
> College women have heights with the following distribution (inches): N (65, 2.5). a. Find the height at the 75th percentile. b. Find the height at the 25th percentile. c. Find the interquartile range for heights. d. Is the interquartile range larger or s
> Critical reading SAT scores are distributed as N(500, 100). a. Find the SAT score at the 75th percentile. b. Find the SAT score at the 25th percentile. c. Find the interquartile range for SAT scores. d. Is the interquartile range larger or smaller than t
> A proponent of a new proposition on a ballot wants to know the population percentage of people who support the bill. Suppose a poll is taken, and 580 out of 1000 randomly selected people support the proposition. Should the proponent use a hypothesis test
> A proponent of a new proposition on a ballot wants to know whether the proposition is likely to pass. Suppose a poll is taken, and 580 out of 1000 randomly selected people support the proposition. Should the proponent use a hypothesis test or a confidenc
> For each question, find the area to the right of the given z-score in a standard Normal distribution. In this question, round your answers to the nearest 0.000.Include an appropriately labeled sketch of the N(0, 1) curve. a. z = 4.00 b. z = 10.00 (Hint:
> A magician has shaved an edge off one side of a six-sided die, and as a result, the die is no longer “fair.” The figure shows a graph of the probability density function (pdf). Show the pdf in table format by listing a
> Suppose a poll is taken that shows 220 out of 400 randomly selected Twitter users feel that Twitter should do more to decrease hateful and abusive content on the site. Test the hypothesis that the majority (more than 50%) of Twitter users feel the site s
> Some experts believe that 20% of all freshwater fish in the United States have such high levels of mercury that they are dangerous to eat. Suppose a fish market has 250 fish tested, and 60 of them have dangerous levels of mercury. Test the hypothesis tha
> Historically (from about 2001 to 2014), 57% of Americans believed that global warming is caused by human activities. A March 2017 Gallup poll of a random sample of 1018 Americans found that 692 believed that global warming is caused by human activities.
> A 2018 Gallup poll of 2228 randomly selected U.S. adults found that 39% planned to watch at least a “fair amount” of the 2018 Winter Olympics. In 2014, 46% of U.S. adults reported planning to watch at least a “fair amount.” a. Does this sample give evide
> A 2018 Gallup poll of 3635 randomly selected Facebook users found that 2472 get most of their news about world events on Facebook. Research done in 2013 found that only 47% of all Facebook users reported getting their news about world events on Facebook.
> In a Northeastern University/ Gallup poll of 461 young Americans aged 18 to 35, 152 reported they would be comfortable riding in a self-driving car. Suppose we are testing the hypothesis that more than 30% of Americans in this age group would be comforta
> About 30% of the population in Silicon Valley, a region in California, are between the ages of 40 and 65, according to the U.S. Census. However, only 2% of the 2100 employees at a laid-off man’s former Silicon Valley company are between the ages of 40 an
> Samuel Morse determined that the percentage of a’s in the English language in the 1800s was 8%. A random sample of 600 letters from a current newspaper contained 60 a’s. Using the 0.10 level of significance, test the hypothesis that the proportion of a’s
> Samuel Morse determined that the percentage of t’s in the English language in the 1800s was 9%. A random sample of 600 letters from a current newspaper contained 48 t’s. Using the 0.10 level of significance, test the hypothesis that the proportion of t’s
> Suppose it is known that 60% of employees at a company use a Flexible Spending Account (FSA) benefit. a. If a random sample of 200 employees is selected, do we expect that exactly 60% of the sample uses an FSA? Why or why not? b. Find the standard error
> Determine whether each of the following variables would best be modeled as continuous or discrete. a. The weight of a car in pounds b. The weight of a car in kilograms
> Suppose it is known that 20% of students at a certain college participate in a textbook recycling program each semester. a. If a random sample of 50 students is selected, do we expect that exactly 20% of the sample participates in the textbook recycling
> According to one source, 50% of plane crashes are due at least in part to pilot error (http://www.planecrashinfo .com). Suppose that in a random sample of 100 separate airplane accidents, 62 of them were due to pilot error (at least in part.) a. Test the
> According to a 2017 Pew Research report, 40% of millennials have a BA degree. Suppose we take a random sample of 500 millennials and find the proportion who have a BA degree. a. What value should we expect for our sample proportion? b. What is the standa
> According to the 2017 SAT Suite of Assessments Annual Report, the average ERW (English, Reading, Writing) SAT score in Florida was 520. Assume the scores are Normally distributed with a standard deviation of 100. Answer the following including an appropr
> According to the 2017 SAT Suite of Assessments Annual Report, the average SAT math score for students in Illinois was 556. Assume the scores are Normally distributed with a standard deviation of 100. Answer the following including an appropriately labele
> The distribution of red blood cell counts is different for men and women. For both, the distribution is approximately Normal. For men, the middle 95% range from 4.5 to 5.7 million cells per microliter and for women, the middle 95% have red blood cells co
> The distribution of white blood cell count per cubic millimeter of whole blood is approximately Normal with mean 7500 and standard deviation 1750 for healthy patients. Use technology or a table to answer these questions. For each include an appropriately
> According to National Vital Statistics, the average length of a newborn baby is 19.5 inches with a standard deviation of 0.9 inches. The distribution of lengths is approximately Normal. Use technology or a table to answer these questions. For each includ
> Determine whether each of the following variables should best be modeled as continuous or discrete. a. The height of a person in inches b. The weight of a person in pounds
> Determine whether each of the following variables would best be modeled as continuous or discrete. a. The number of cars passing through an intersection in one hour b. The weight of a person
> Determine whether each of the following variables would best be modeled as continuous or discrete. a. The height of a high-rise apartment building b. The number of floors in a high-rise apartment building
> Sir William Blackstone (1723–1780) wrote influential books on common law. He made this statement: “All presumptive evidence of felony should be admitted cautiously; for the law holds it better that ten guilty persons escape, than that one innocent party
> According to a 2017 survey conducted by Netflix, 46% of couples have admitted to “cheating” on their significant other by streaming a TV show ahead of their partner. Suppose a random sample of 80 Netflix subscribers is selected. a. What percentage of the
> A test is conducted in which a coin is flipped 30 times to test whether the coin is unbiased. The null hypothesis is that the coin is fair. The alternative is that the coin is not fair. One of the accompanying figures represents the p-value after getting
> A researcher carried out a hypothesis test using a two-sided alternative hypothesis. Which of the following z-scores is associated with the smallest p-value? Explain. z = 0.50 z = 1.00 z = 2.00 z = 3.00
> According to the British Medical Journal, the distribution of weights of newborn babies is approximately Normal, with a mean of 3390 grams and a standard deviation of 550 grams. Use a technology or a table to answer these questions. For each include an a
> The length of gestation for hippopotami is approximately Normal, with a mean of 270 days and a standard deviation of 7 days. a. What percentage of hippos have a gestation period less than 260 days? b. Complete this sentence: Only 6% of hippos will have a
> Assume a standard Normal distribution. Draw a separate, well-labeled Normal curve for each part. a. Find an approximate z-score that gives a left area of 0.7000. b. Find an approximate z-score that gives a left area of 0.9500.
> Assume a standard Normal distribution. Draw a separate, well-labeled Normal curve for each part. a. Find the z-score that gives a left area of 0.7123. b. Find the z-score that gives a left area of 0.1587.
> In a standard Normal distribution, if the area to the left of a z-score is about 0.1000, what is the approximate z-score?
> In a standard Normal distribution, if the area to the left of a z-score is about 0.6666, what is the approximate z-score? First locate, inside the table, the number closest to 0.6666. Then find the z-score by adding 0.4 and 0.03; refer to the table. Draw
> The Normal model N(150, 10) describes the distribution of scores on the LSAT, a standardized test required by most law schools. Which of the following questions asks for a probability, and which asks for a measurement? Identify the type of problem and th
> The Normal model N(69, 3) describes the distribution of male heights in the United States. Which of the following questions asks for a probability, and which asks for a measurement? Identify the type of problem and then answer the given question. a. To b
> The average winter daily temperature in Chicago has a distribution that is approximately Normal, with a mean of 28 degrees and a standard deviation of 8 degrees. What percentage of winter days in Chicago have a daily temperature of 35 degrees or warmer?
> New York City’s mean minimum daily temperature in February is 27°F (http://www.ny.com). Suppose the standard deviation of the minimum temperature is 6°F and the distribution of minimum temperatures in February is approximately Normal. What percentage of
> According to Anthropometric Survey data, the distribution of arm spans for females is approximately Normal with a mean of 65.4 inches and a standard deviation of 3.2 inches. a. What percentage of women have arm spans less than 61 inches? b. Olympic swimm
> According to a 2017 AAA survey, 35% of Americans planned to take a family vacation (a vacation more than 50 miles from home involving two or more immediate family members. Suppose a recent survey of 300 Americans found that 115 planned on taking a family
> Bob Ross hosted a weekly television show, The Joy of Painting, on PBS in which he taught viewers how to paint. During each episode, he produced a complete painting while teaching viewers how they could produce a similar painting. Ross completed 30,000 pa
> According to Anthropometric Survey data, the distribution of arm spans for males is approximately Normal with a mean of 71.4 inches and a standard deviation of 3.3 inches. a. What percentage of men have arm spans between 66 and 76 inches? b. Professional
> Assuming that the true proportion of success for the trials shown in the graph for Exercise 7.33 is 0.2, explain whether any of the graphs shows bias. Graph from exercise 7.33:
> Which of the dotplots given in Exercise 7.33 has the largest standard error, and which has the Smallest standard error? Exercise 7.33:
> A Zener deck of cards has cards that show one of five different shapes with equal representation, so that the probability of selecting any particular shape is 0.20. A card is selected randomly, and a person is asked to guess which card has been chosen. T
> Suppose that, when taking a random sample of three students’ GPAs, you get a sample mean of 3.90. This sample mean is far higher than the collegewide (population) mean. Does that prove that your sample is biased? Explain. What else could have caused this
> According to The Washington Post, 72% of high school seniors have a driver’s license. Suppose we take a random sample of 100 high school seniors and find the proportion who have a driver’s license. a. What value should we expect for our sample proportion
> Suppose a shoe store stocks shoes in women’s sizes 5 through 9. These shoes will fit women with feet that are 21.6 through 25 centimeters long. What percentage of women will be able to find shoes that fit in this store? Use the statistics for the mean an
> Suppose a shoe store stocks shoes in men’s sizes 7 through 12. These shoes will fit men with feet that are 24.6 to 28.8 centimeters long. What percentage of boys aged 16 to 17 will not be able to find shoes that fit in this store? Use the statistics for
> According to the Digital Human Modeling Project, the distribution of foot lengths of women is approximately Normal with a mean of 23.1 centimeters and a standard deviation of 1.1 centimeters. In the United States, a women’s shoe size of 6 fits feet that
> According to a 2018 survey by Timex reported in Shape magazine, 73% of Americans report working out one or more times each week. A nutritionist is interested in whether this percentage has increased. A random sample of 200 Americans found 160 reported wo
> According to the Digital Human Modeling Project, the distribution of foot lengths of 16- to 17-year-old boys is approximately Normal with a mean of 25.2 centimeters and a standard deviation of 1.2 centimeters. In the United States, a man’s size 11 shoe f
> A friend claims he can predict how a six-sided die will land. The parameter, p, is the long-run likelihood of success, and the null hypothesis is that the friend is guessing. a. Pick the correct null hypothesis. i. p = 1/6 ii. p > 1/6 iii. p < 1/6 iv. p
> A friend claims he can predict the suit of a card drawn from a standard deck of 52 cards. There are four suits and equal numbers of cards in each suit. The parameter, p, is the probability of success, and the null hypothesis is that the friend is just gu
> According to a 2016 report by the Census Bureau, 60.1% of women and 57.6% of men have completed some college education or higher. Would it be appropriate to do a two-proportion z-test to determine whether the proportions of men and women who had complete
> Pew Research reported that in the 2016 presidential election, 53% of all male voters voted for Trump and 41% voted for Clinton. Among all women voters, 42% voted for Trump and 54% voted for Clinton. Would it be appropriate to do a two-proportion z-test t
> A multiple-choice test has 50 questions with four possible options for each question. For each question, only one of the four options is correct. A passing grade is 35 or more correct answers. a. What is the probability that a person will guess correctly
> Suppose you wanted to test the claim that the majority of U.S. voters are satisfied with the government response to the opioid crisis. State the null and alternative hypotheses you would use in both words and symbols.
> In the mid-1800s, Dr. Ignaz Semmelweiss decided to make doctors wash their hands with a strong disinfectant between patients at a clinic with a death rate of 9.9%. Semmelweiss wanted to test the hypothesis that the death rate would go down after the new
> Suppose a friend says he can predict whether a coin flip will result in heads or tails. You test him, and he gets 20 right out of 20. Do you think he can predict the coin flip (or has a way of cheating)? Or could this just be something that is likely to
> Suppose a friend says he can predict whether a coin flip will result in heads or tails. You test him, and he gets 10 right out of 20. Do you think he can predict the coin flip (or has a way of cheating)? Or could this just be something that occurs by cha
> Suppose you attend a school that offers both traditional courses and online courses. You want to know the average age of all the students. You walk around campus asking those students that you meet how old they are. Would this result in an unbiased sampl
> Marco is interested in whether Proposition P will be passed in the next election. He goes to the university library and takes a poll of 100 students. Since 58% favor Proposition P, Marco believes it will pass. Explain what is wrong with his approach.
> Using your result from Exercise 7.107, solve for n by (1) dividing both sides of the equation by 2, (2) squaring both sides of the equation, (3) cross-multiplying, and (4) solving for n.
> From Formula 7.2, an estimate for margin of error for a 95% confidence interval is m= 2√ˆp(1 - ˆp) n where n is the required sample size andˆp is the sample proportion. Since we do not know a value for ˆp, we use a conservative estimate of 0.50 f
> Four women selected from a photo of 123 were found to have a sample mean height of 71 inches (5 feet 11 inches). The population mean for all 123 women was 64.6 inches. Is this evidence that the sampling procedure was biased? Explain.
> Suppose that, when taking a random sample of 4 from 123 women, you get a mean height of only 60 inches (5 feet). The procedure may have been biased. What else could have caused this small mean?
> You want to find the mean weight of the students at your college. You calculate the mean weight of a sample of members of the football team. Is this method biased? If so, would the mean of the sample be larger or smaller than the true population mean for
> If you walked around your school campus and asked people you met how many keys they were carrying, would you be obtaining a random sample? Explain.
> Maria opposes capital punishment and wants to find out if a majority of voters in her state support it. She goes to a church picnic and asks everyone there for their opinion. Because most of them oppose capital punishment, she concludes that a vote in he
> Babies in the United states have a mean birth length of 20.5 inches with a standard deviation of 0.90 inch. The shape of the distribution of birth lengths is approximately Normal. a. How long is a baby born at the 20th percentile? b. How long is a baby b
> A teacher giving a true/false test wants to make sure her students do better than they would if they were simply guessing, so she forms a hypothesis to test this. Her null hypothesis is that a student will get 50% of the questions on the exam correct. Th
> a. If a rifleman’s gunsight is adjusted incorrectly, he might shoot bullets consistently close to 2 feet left of the bull’s-eye target. Draw a sketch of the target with the bullet holes. Does this show lack of precision or bias? b. Draw a second sketch o
> The mother of a teenager has heard a claim that 25% of teenagers who drive and use a cell phone reported texting while driving. She thinks that this rate is too high and wants to test the hypothesis that fewer than 25% of these drivers have texted while
> Refer to Exercise 8.97. Suppose 14 out of 20 voters in Pennsylvania report having voted for an independent candidate. The null hypothesis is that the population proportion is 0.50. What value of the test statistic should you report?
> Judging on the basis of experience, a politician claims that 50% of voters in Pennsylvania have voted for an independent candidate in past elections. Suppose you surveyed 20 randomly selected people in Pennsylvania, and 12 of them reported having voted f
> A poll on a proposition showed that we are 99% confident that the population proportion of voters supporting it is between 52% and 62%. Find the sample proportion that supported the proposition.
> In the primaries leading up to the 2016 presidential election, the Business Insider reported that Bernie Sanders and Hilary Clinton were in a “statistical tie” in the polls leading up to the Vermont primary. Clinton led Sanders 43% to 35% in the polls, w
> According to a 2017 Gallup poll, 17% of Americans report they rarely feel stressed. Suppose 80 Americans are randomly sampled. Find the probability of the following: a. Wxactly 15 rarely feel stressed b. More than 20 rarely feel stressed c. At most 10 ra
> According to a 2017 Gallup poll, 44% of Americans report they frequently feel stressed. Suppose 200 Americans are randomly sampled. Find the probability of the following: a. Fewer than 80 frequently feel stressed b. At least 90 frequently feel stressed c
> In 2018 Gallup reported that 52% of Americans are dissatisfied with the quality of the environment in the United States. This was based on a 95% confidence interval with a margin of error of 4 percentage points. Assume the conditions for constructing the
> According to the Bureau of Labor Statistics, 71.9% of young women enroll in college directly after high school graduation. Suppose a random sample of 200 female high school graduates is selected and the proportion who enroll in college is obtained. a. Wh
> See problem 6.89 for information about USMLE scores. a. What USMLE score would correspond with a z-score of -2? b. What USMLE score corresponds with a z-score of 1? c. Find the z-score that corresponds with a USMLE score of 250. Would a score of 250 be c
> Whales have one of the longest gestation periods of any mammal. According to whalefacts.org, the mean gestation period for a whale is 14 months. Assume the distribution of gestation periods is Normal with a standard deviation of 1.2 months. a. Find the s
> A poll on a proposition showed that we are 95% confident that the population proportion of voters supporting it is between 40% and 48%. Find the sample proportion that supported the proposition.
> A study of human body temperatures using healthy women showed a mean of 98.4 °F and a standard deviation of about 0.70 °F. Assume the temperatures are approximately Normally distributed. a. Find the percentage of healthy women with temperatures below 98.
> A study of human body temperatures using healthy men showed a mean of 98.1 °F and a standard deviation of 0.70 °F. Assume the temperatures are approximately Normally distributed. a. Find the percentage of healthy men with temperatures below 98.6 °F (that
> A study of U.S. births published on the website Medscape from WebMD reported that the average birth length of babies was 20.5 inches and the standard deviation was about 0.90 inch. Assume the distribution is approximately Normal. Find the percentage of b
> A study of U.S. births published on the website Medscape from WebMD reported that the average birth length of babies was 20.5 inches and the standard deviation was about 0.90 inch. Assume the distribution is approximately Normal. Find the percentage of b
> a. If a rifleman’s gunsight is adjusted correctly, but he has shaky arms, the bullets might be scattered widely around the bull’s-eye target. Draw a sketch of the target with the bullet holes. Does this show variation (lack of precision) or bias? b. Draw
> Determine whether each of the following variables would best be modeled as continuous or discrete: a. Number of girls in a family b. Height of a tree c. Commute time d. Concert attendance
> A 2003 study of dreaming published in the journal Perceptual and Motor Skills found that out of a random sample of 113 people, 92 reported dreaming in color. However, the proportion of people who reported dreaming in color that was established in the 194
> A community college used enrollment records of all students and reported that that the percentage of the student population identifying as female in 2010 was 54% whereas the proportion identifying as female in 2018 was 52%. Would it be appropriate to use
> Suppose you tested 50 coins by flipping each of them many times. For each coin, you perform a significance test with a significance level of 0.05 to determine whether the coin is biased. Assuming that none of the coins is biased, about how many of the 50
> According to dogtime.com, the mean weight of an adult St. Bernard dog is 150 pounds. Assume the distribution of weights is Normal with a standard deviation of 10 pounds. a. Find the standard score associated with a weight of 170 pounds. b. Using the Empi

