Question: Supermarkets often place similar types of cereal
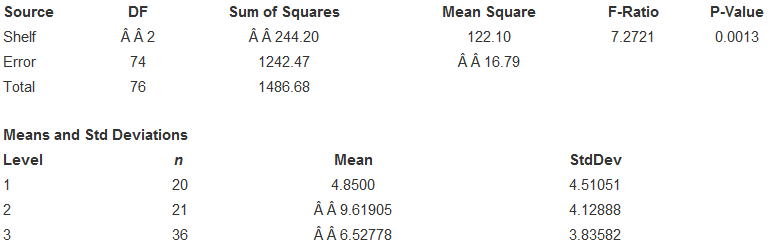
Supermarkets often place similar types of cereal on the same supermarket shelf. We have data on the shelf as well as the sugar, sodium, and calorie content of 77 cereals. Does sugar content vary by shelf? At the top of the next column is a boxplot and an ANOVA table for the 77 cereals.
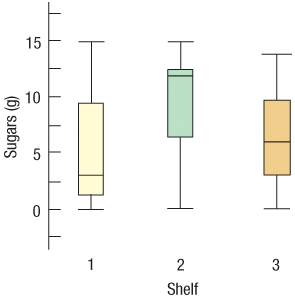
1. What are the null and alternative hypotheses?
2. What does the ANOVA table say about the null hypothesis? (Be sure to report this in terms of Sugars and Shelves.)
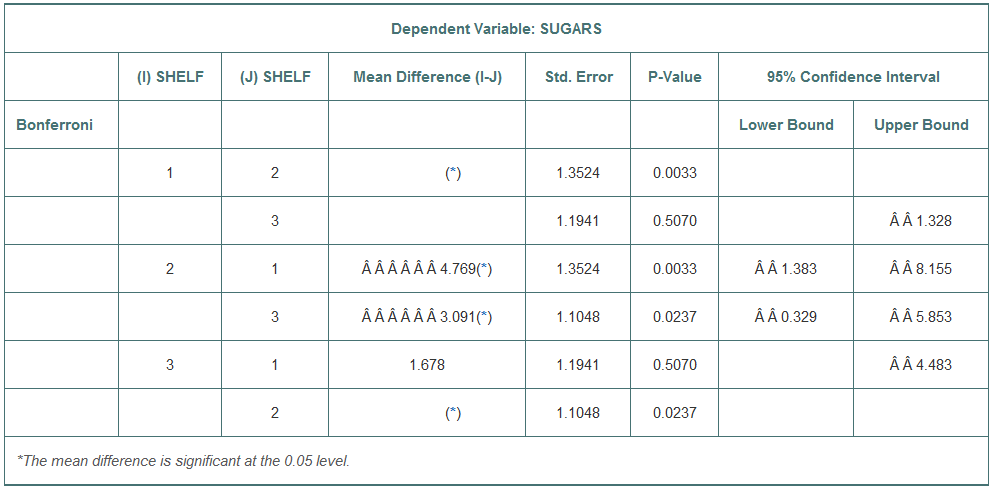
3. Can we conclude that cereals on shelf 2 have a higher mean sugar content than cereals on shelf 3? Can we conclude that cereals on shelf 2 have a higher mean sugar content than cereals on shelf 1? What can we conclude?
4. To check for significant differences between the shelf means, we can use a Bonferroni test, whose results are shown below. For each pair of shelves, the difference is shown along with its standard error and significance level. What does it say about the questions in part c?
> Find an article in a newspaper, a magazine, or the Internet that discusses an average. 1. Does the article discuss the W for the data? 2. What are the units of the variable? 3. Is the average used the median or the mean? How can you tell? 4. Is the choic
> Find a graph other than a histogram that shows the distribution of a quantitative variable in a newspaper, a magazine, or the Internet. 1. Does the article identify the W? 2. Discuss whether the display is appropriate for the data. 3. Discuss what the di
> Find a histogram that shows the distribution of a variable in a newspaper, a magazine, or the Internet. 1. Does the article identify the W? 2. Discuss whether the display is appropriate. 3. Discuss what the display reveals about the variable and its dist
> Find a table of categorical data from a newspaper, a magazine, or the Internet. 1. Is it clearly labeled? 2. Does it display percentages or counts? 3. Does the accompanying article tell the W of the variables? 4. Do you think the article correctly interp
> Find a frequency table of categorical data from a newspaper, a magazine, or the Internet. 1. Is it clearly labeled? 2. Does it display percentages or counts? 3. Does the accompanying article tell the W of the variable? 4. Do you think the article correct
> Find a pie chart of categorical data from a newspaper, a magazine, or the Internet. 1. Is the graph clearly labeled? 2. Does it violate the area principle? 3. Does the accompanying article tell the W of the variable? 4. Do you think the article correctly
> Look again at the table of political views for the Intro Stats students in Exercise 30. 1. Find the conditional distributions (percentages) of political views for the females. 2. Find the conditional distributions (percentages) of political views for the
> Find a bar chart of categorical data from a newspaper, a magazine, or the Internet. 1. Is the graph clearly labeled? 2. Does it violate the area principle? 3. Does the accompanying article tell the W of the variable? 4. Do you think the article correctly
> Here is a mosaic plot of the data on being successful from Exercise 10: 1. Are the differences in sample sizes in the four groups very large? Explain briefly. 2. Which factor seems more important in determining how someone responded: Age or Gender? Expla
> The organization Monitoring the Future (www.monitoringthefuture.org) asked 2048 eighth graders who said they smoked cigarettes what brands they preferred. The table shows brand preferences for two regions of the country. Write a few sentences describing
> The New York Times combined survey data (economix.blogs.nytimes.com/2013/07/10/working-parents-wanting-fewer-hours/) with data from the U.S. Bureau of Labor Statistics (BLS) (www.bls.gov/news.release/archives/famee_04262013.htm) comparing how mothers and
> Pew Research (www.pewsocialtrends.org/2013/03/14/modern-parenthood-roles-of-moms-and-dads converge-as-they-balance-work-and-family/) surveyed parents and asked how many hours they spent in various activities. They compared 2011 responses with those from
> Look again at the table of smoking prevalence in Exercise 19. 1. Compare the smoking rate among 1824-year-old women to that of men during the time covered by this table. 2. Relatively few women over the age of 65 smoke. What other variables might affect
> The Centers for Disease Control and Prevention provide data on smoking rates by year and for men and women separately. Here is a table with some of that information: 1. What was the smoking rate among 1824-year-old men in 1974? 2. How has the smoking rat
> You find a number of cartoons throughout this text. Are they Are cartoons simply entertaining, or will they help with learning? Lawrence M. Lesser, Dennis K. Pearl, and John J. Weber III (Assessing fun items effectiveness in increasing learning of colleg
> A recent article in Geophysical Research Letters (Asteroid impact effects and their immediate hazards for human populations, 10.1002/2017GL073191) simulated the consequences of an earth impact by an asteroid of 400 m in diameter. They estimate that for a
> The Motion Picture Association of America studies the ethnicity of moviegoers to understand changes in the demographics of moviegoers over time. Here are the numbers of moviegoers (in millions) classified as Hispanic, African American, Caucasian, and Oth
> Look again at the table of post-graduation plans for the senior class in Exercise 29. 1. Find the conditional distributions (percentages) of plans for the white students. 2. Find the conditional distributions (percentages) of plans for the minority stude
> In 2012, the following data were reported by the U.S. Census Bureau. The data show the number of people (in thousands) living above and below the poverty line in each of the four regions of the United States. Based on these data, do you think there is an
> Find a bar graph or pie chart of categorical data from a newspaper, a magazine, or the Internet. 1. Is the graph clearly labeled? 2. Does the graph violate the area principle? 3. Does the accompanying article tell the W of the variable? 4. Do you think t
> Find a contingency table of categorical data from a newspaper, a magazine, or the Internet. 1. Is it clearly labeled? 2. Does it display percentages or counts? 3. Does the accompanying article tell the W of the variables? 4. Do you think the article corr
> The following table shows the reasons given by people 16 years of age and older in the United States who are not in the labor force for not working in early 2015. Counts are in thousands of people. (bls.gov/cps/cpsaat35.htm) 1. What percent of the unempl
> Refer to the experiment in Exercise 7 . After collecting her data and analyzing the results, the student reports that the F-ratio for Power is 13.56 and the F-ratio for Time is 9.36. 1. What are the P-values? 2. What would you conclude? 3. What else abou
> In Chapter 25 we saw a student experiment to study the effect of Tire Pressure and Acceleration on gas mileage. He devises a system so that his Jeep Wagoneer uses gasoline from a one-liter container. He uses 3 levels of Tire Pressure (low, medium, and fu
> In the previous chapter we saw a two-factor experiment to test how microwave power and temperature affect popping. She chooses 3 levels of Power (low, medium, and high) and 3 Times (3 minutes, 4 minutes, and 5 minutes), running one bag at each condition.
> Another student performs a one-way ANOVA on the container data of Exercise 20 , using the 4 treatments water room, water outside, coffee room, and coffee outside. Perform this analysis and comment on the differences between this analysis and the one in E
> Another student analyzed the battery data from Exercise 25, using a one-way ANOVA. He considered the experimental factor to be an 8-level factor consisting of the 8 possible combinations of Brand and Environment. Here are the boxplots for the 8 treatment
> In an experiment on growing sweet peas, a team of students selected 2 factors at 4 levels each and recorded Weight, Stem Length, and Root Length after 612 days of growth. They grew plants using various amounts of Water and Quickgrow solution, a fertilize
> The U.S. Department of Labor (www.bls.gov) collects data on the number of U.S. workers who are employed at or below the minimum wage. Here is a table showing the number of hourly workers by Age and Sex and the number who were paid at or below the prevail
> A student experiment was run to test the performance of 4 brands of batteries under 2 different Environments (room temperature and cold). For each of the 8 treatments, 2 batteries of a particular brand were put into a flashlight. The flashlight was then
> Refer back to the experiment in Exercise 22 . Instead of Total counts, redo the analysis using log(Total counts) as the response. Do your conclusions change? How? Are the assumptions of the model better satisfied?
> Refer back to the experiment in Exercise 21 . Instead of mpg redo the analysis using log (mpg) as the response. Do your conclusions change? How? Are the assumptions of the model better satisfied?
> A gas chromatograph is an instrument that measures the amounts of various compounds in a sample by separating its constituents. Because different components are flushed through the system at different rates, chromatographers are able to both measure and
> An experiment to test a new gasoline additive, Gasplus, was performed on three different cars: a sports car, a minivan, and a hybrid. Each car was tested with both Gasplus and regular gas on 10 different occasions and their gas mileage was recorded. Here
> Building on the cup experiment of the Chapter 4 Step-By-Step, a student selects one type of container and designs an experiment to see whether the type of Liquid stored and the outside Environment affect the ability of a cup to maintain temperature. He r
> The students running the sprouts experiment (Exercise 12 ) also kept track of the number of beans sprouted (out of 40) for each of the 36 dishes. Here are the partial boxplots of Sprouts plotted against Salinity and Temperature: 1. State the hypotheses a
> For his final project, Jonathan examined the effects of two factors on how well stains are removed when washing clothes. On each of 16 new white handkerchiefs, he spread a teaspoon of dirty motor oil (obtained from a local garage). He chose 4 Temperature
> A student performed an experiment to see if her favorite sneakers and the time of day might affect her free throw percentage. She tried shooting with and without her favorite sneakers and in the early morning and at night. For each treatment combination,
> Refer back to Exercise 14 . Perform your own analysis of the data to see if eating fish and contracting prostate cancer are related.
> How have movies changed during the decade from 2006 to 2015? Here is a contingency table showing the proportion of movies with each of the MPAA categories in each year: 1. Are these column percents or row percents? How can you tell? 2. Does it look like
> Refer back to Exercise 13 . Perform your own analysis of the data to see if baldness and heart disease are related. Do your conclusions support the claim that baldness is a cause of heart disease? Explain.
> The Chapter 3 Step-By-Step looked at a Swedish study that asked 6272 men how much fish they ate and whether or not they had prostate cancer. (Data in Fish diet) Here are summary counts: 1. Comment on her analysis. What problems, if any, do you find with
> A retrospective study examined the link between baldness and the incidence of heart disease. In the study, 1435 middle-aged men were selected at random and examined to see whether they showed signs of Heart Disease (or not) and what amount of Baldness th
> An experiment on mung beans was performed to investigate the environmental effects of salinity and water temperature on sprouting. Forty beans were randomly allocated to each of 36 petri dishes that were subject to one of four levels of Salinity (0, 4, 8
> The National Highway Transportation Safety Administration runs crash tests in which stock automobiles are crashed into a wall at 35 mph with dummies in both the passenger and the driver seats. The THOR Alpha crash dummy is capable of recording 134 channe
> Refer to the experiment in Exercise 8 . After analyzing his data the student reports that the F-ratio for Tire Pressure is 4.29 with a P-value of 0.030, the F-ratio for Acceleration is 2.35 with a P-value of 0.143, and the F-ratio for the Interaction eff
> A pharmaceutical company tested three formulations of a pain relief medicine for migraine headache sufferers. For the experiment, 27 volunteers were selected and 9 were randomly assigned to one of three drug formulations. The subjects were instructed to
> To see how much of a difference time of day made on the speed at which he could download files, a college sophomore performed an experiment. He placed a file on a remote server and then proceeded to download it at three different time periods of the day.
> We also have data on the protein content of the cereals in Exercise 19 by their shelf number. Here are the boxplot and ANOVA table: 1. What are the null and alternative hypotheses? 2. What does the ANOVA table say about the null hypothesis? (Be sure to r
> Students in an Intro Stats course were asked to describe their politics as Liberal, Moderate, or Conservative. Here are the results: 1. What percent of the class is male? 2. What percent of the class considers themselves to be Conservative? 3. What perce
> A biology student is studying the effect of 10 different fertilizers on the growth of mung bean sprouts. She sprouts 12 beans in each of 10 different petri dishes, and adds the same amount of fertilizer to each dish. After one week she measures the heigh
> A school district superintendent wants to test a new method of teaching arithmetic in the fourth grade at his 15 schools. He plans to select 8 students from each school to take part in the experiment, but to make sure they are roughly of the same ability
> In a statement to a Senate Public Works Committee, a senior executive of Texaco, Inc., cited a study on the effectiveness of auto filters on reducing noise. Because of concerns about performance, two types of filters were studied, a standard silencer and
> A student wants to investigate the effects of real vs. substitute eggs on his favorite brownie recipe. He enlists the help of 10 friends and asks them to rank each of 8 batches on a scale from 1 to 10. Four of the batches were made with real eggs, four w
> Particulate matter is a serious form of air pollution often arising from industrial production. One way to reduce the pollution is to put a filter, or scrubber, at the end of the smokestack to trap the particulates. An experiment to determine which smoke
> An experiment to determine the effect of several methods of preparing cultures for use in commercial yogurt was conducted by a food science research group. Three batches of yogurt were prepared using each of three methods: traditional, ultrafiltration, a
> A regression model for data on breakfast cereals originally looked like this: Dependent variable is: Calories R squared =84.5% R-squared (adjusted)=83.4% s=7.947 with 776=71 degrees of freedom Let’s take a closer look at the coefficien
> HIV One ongoing health problem in the part of Africa encompassing the outlying countries for the regression model of Exercise 17 is HIV/AIDS. Could that explain these outliers? Here another model, now with the logarithm of the HIV incidence included as a
> Here the residual plot corresponding to the regression model of Exercise 18 : The extreme case this time is Weight Watchers Pepperoni (makes sense, doesn’t it?). We can make one more indicator for Weight Watchers. Here the model: Depend
> The residual plot of Exercise 17 calls out some countries that have particularly large negative residuals. They are Gabon, Swaziland, Botswana, Namibia, and South Africa. What do these countries have in common? (Hint: Consult a map.) What does it mean fo
> Prior to graduation, a high school class was surveyed about its plans. The following table displays the results for white and minority students (the Minority group included African American, Asian, Hispanic, and Native American students): 1. What percent
> A plot of Studentized residuals against predicted values for the regression model found in Exercise 16 now looks like this. It has been colored according to Type of pizza and separate regression lines fitted for each type: 1. Comment on this diagnostic p
> At the top of the next column is a regression analysis to predict Life expectancy using the data of Exercise 15 and a plot of the residuals Response variable is: Life expectancy 240 total cases of which 20 are missing Comment on the model and the residua
> Here a plot of the Studentized residuals against the predicted values for the regression model found in Exercise 14 : The two extraordinary cases in the plot of residuals are Reggio and Michelina, two gourmet pizzas. 1. Interpret these residuals. What do
> Here is a scatterplot matrix of the variables as re-expressed in Exercise 13 using a version that places Normal probability plots on the diagonal. 1. Comment on their suitability for a regression model to predict Life expectancy. The points are colored a
> Union rated frozen pizzas. Their report includes the number of Calories, Fat content, and Type (cheese or pepperoni, represented here as an indicator variable that is 1 for cheese and 0 for pepperoni). Here a regression model to predict the Score awarded
> The United States Central Intelligence Agency maintains a public site called the World Factbook at www.cia.gov/library/publications/the-worldfactbook/. There you find a wealth of variables about all the countries of the world. Let’s exa
> In Chapter 9 , Exercises 14 , 18, 29, and 30, we considered data on hill races in Scotland. These are overland races that climb and descend hills sometimes several hills in the course of one race. Here is a regression analysis to predict the Women Record
> In Exercise 25 of Chapter 9 , we considered a multiple regression model for predicting calories in breakfast cereals. The regression looked like this: Dependent variable is: Calories R-squared =38.4% R-squared (adjusted)=35.9% s=15.60 with 774=73 degrees
> In previous chapters we have looked at data from the 50 states. Here an analysis of data from a few years earlier. The Murder rate is per 100,000, HS Graduation rate is in %, Income is per capita income in dollars, Illiteracy rate is per 1000, and Life E
> The following software output provides information about the Size (in square feet) of 18 homes in Ithaca, New York, and the city assessed Value of those homes. Dependent variable is Value 1. Explain why inference for linear regression is appropriate with
> The Pew Research survey cited in Exercise 27 also asked what employment sector the respondents worked in and whether their job gave them a sense of identity or whether it was just what they do for a living. This table summarizes their responses: 1. Is th
> For each of the following, list the sample space and tell whether you think the events are equally likely: 1. Toss 2 coins; record the order of heads and tails. 2. A family has 3 children; record the number of boys. 3. Flip a coin until you get a head or
> The following software output is based on the mortality rate (deaths per 100,000 people) and the education level (average number of years in school) for 58 U.S. cities. Dependent variable is Mortality 1. Comment on the assumptions for inference. 2. Is th
> A sample of 84 model- 2011 cars from an online information service was examined to see how fuel efficiency (as highway mpg) relates to the cost (Manufacturer Suggested Retail Price in dollars) of cars. Here are displays and computer output: Dependent var
> Remember the Little League instructional video discussed in Chapter 21, Exercise 35? Ads claimed it would improve the performances of Little League pitchers. To test this claim, 20 Little Leaguers threw 50 pitches each, and we recorded the number of stri
> The professor teaching the introductory statistics class discussed in Exercise 57 wonders whether performance on homework can accurately predict midterm scores. 1. To investigate it, she fits a regression of the sum of the two midterms scores on homework
> The dataset below shows midterm and homework scores from an introductory statistics course. 1. Fit a model predicting the second midterm score from the first. 2. Comment on the model you found, including a discussion of the assumptions and conditions for
> Researchers at the University of Denver Infant Study Center wondered whether temperature might influence the age at which babies learn to crawl. Perhaps the extra clothing that babies wear in cold weather would restrict movement and delay the age at whic
> Tablet computers 2014 Cnet.com tests tablet computers and continuously updates its list. As of January 2014, the list included the battery life (in hours) and luminous intensity (i.e., screen brightness, in cd/m2). We want to know if Battery life is rela
> Consider again the relationship between the sales and profits of Fortune 500 companies that you analyzed in Exercise 52. 1. Find a 95% confidence interval for the slope of the regression line. Interpret your interval in context. 2. Last year, the drug ma
> Consider again the relationship between the population and ozone level of U.S. cities that you analyzed in Exercise 51. 1. Give a 90% confidence interval for the slope of the relationship between ozone level and population. 2. For the cities studied, the
> A business analyst was interested in the relationship between a company sales and its profits. She collected data (in millions of dollars) from a random sample of Fortune 500 companies and created the regression analysis and summary statistics shown. The
> Pew Research surveyed 5006 U.S. adults to ask their opinions about the state of jobs in the United States in 2016. (www.pewsocialtrends.org/2016/10/06/the-state-of-american-jobs/) Respondents were asked how satisfied they are with their current job and
> The Environmental Protection Agency is examining the relationship between the ozone level (in parts per million) and the population (in millions) of U.S. cities. Part of the regression analysis is shown. Dependent variable is Ozone Dependent variable is
> A skeptic suggests that reduced sea ice isn’t due to global climate change at all. He offers the following model, including Year since 1979 as another predictor as an alternative to the model in Exercise 23 (Data in Sea ice): Response variable is: Extent
> The output shows an attempt to model the association between average January Temperature (in degrees Fahrenheit) and Latitude (in degrees north of the equator) for 59 U.S. cities. Which of the assumptions for inference do you think are violated? Explain.
> Further analysis of the data for the breakfast cereals in Exercise 46 looked for an association between Fiber content and Calories by attempting to construct a linear model. Here are three graphs. Which of the assumptions for inference are violated? Expl
> Is your IQ related to the size of your brain? A group of female college students took a test that measured their verbal IQs and also underwent an MRI scan to measure the size of their brains (in 1000s of pixels). The scatterplot and regression analysis a
> A healthy cereal should be low in both calories and sodium. Data for 77 cereals were examined and judged acceptable for inference. The 77 cereals had between 50 and 160 calories per serving and between 0 and 320 mg of sodium per serving. HereÃ&cen
> Consider once again the CO2 and global temperature data of Exercise 41. The mean CO2 level for these data is 352.566 ppm. 1. Find a 90% confidence interval for the mean global temperature anomaly if the CO2 level reaches 450 ppm. 2. Find a 90% prediction
> Consider again the data in Exercise 40 about the gas mileage and weights of cars. 1. Create a 95% confidence interval for the average fuel efficiency among cars weighing 2500 pounds, and explain what your interval means. 2. Create a 95% prediction interv
> Consider the CO2 and global temperature data of Exercise 41. 1. Find a 90% confidence interval for the slope of the true line describing the association between Temp and CO2. 2. Explain in this context what your confidence interval means.
> Consider again the data in Exercise 40 about the gas mileage and weights of cars. 1. Create a 95% confidence interval for the slope of the regression line. 2. Explain in this context what your confidence interval means.
> In an effort to reduce the number of gun-related homicides, some cities have run buyback programs in which the police offer cash (often $50) to anyone who turns in an operating handgun. Chance magazine looked at results from a four-year period in Milwauk
> Data collected from around the globe (including the sea ice data of Exercise 23) show that the earth is getting warmer. The generally accepted explanation relates climate change to an increase in atmospheric levels of carbon dioxide (CO2) because CO2 is
> A consumer organization has reported test data for 50 car models. We will examine the association between the weight of the car (in thousands of pounds) and the fuel efficiency (in miles per gallon). Here are the scatterplot, summary statistics, and regr
> The price of a car depends on its age as well as on its mileage. Here is a regression in which the age of the cars (in years) is included in the regression model from Exercise 34: Response variable is: Price 1. What is the interpretation of the coefficie
> Biologists studying the effects of acid rain on wildlife collected data from 172 streams in the Adirondack Mountains. They recorded the pH (acidity) of the water and the BCI, a measure of biological diversity. Here a scatterplot of BCI against pH for the
> Based on the analysis of marriage ages given in Exercise 33, find a 95% confidence interval for the rate at which the age gap is closing. Explain what your confidence interval means

