Question: The following data were collected on
The following data were collected on nonconformances for a period of 10 days:
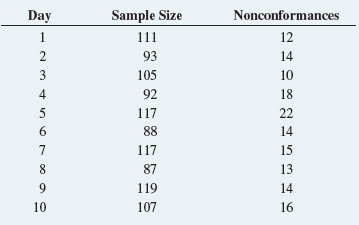
a. On what day is the proportion of nonconformances largest? Smallest?
b. What are the LCL and UCL?
c. Are there any special causes of variation?
> For a potential investment of $1,000, if a stock has an EMV of $100 and a standard deviation of $25, what is the a. rate of return? b. coefficient of variation? c. return-to-risk ratio?
> What is the difference between a risk averter and a risk seeker?
> How is Bayes’ theorem used to revise probabilities in light of sample information?
> What are the advantages and disadvantages of using expected monetary value (EMV) as compared to the return-to-risk ratio (RTRR)?
> How does the expected value of perfect information differ from the expected profit under certainty?
> What is the meaning of the expected value of perfect information (EVPI)?
> The DellaVecchia Garden Center purchases and sells Christmas trees during the holiday season. It purchases the trees for $10 each and sells them for $30 each. Any trees not sold by Christmas day are sold for $1 each to a company that makes wood chips. Th
> An author is trying to choose between two publishing companies that are competing for the marketing rights to her new novel. Company A has offered the author $10,000 plus $2 per book sold. Company B has offered the author $2,000 plus $4 per book sold. Th
> An entrepreneur is planning to market a new brand of bottled unsweetened, organic iced tea. The profit on each bottle of iced tea to be sold has been set at $0.50. The entrepreneur needs to decide on the size of the bottling plant to produce the iced tea
> For this problem, use the following payoff table: a. Construct an opportunity loss table. b. Construct a decision tree.
> For this problem, use the following payoff table: a. Construct an opportunity loss table. b. Construct a decision tree.
> What is the difference between attribute control charts and variables control charts?
> How does expected monetary value (EMV) differ from expected opportunity loss (EOL)?
> Under what circumstances do you use a p chart?
> What should you do to improve a process when only common causes of variation are present?
> What should you do to improve a process when special causes of variation are present?
> What is the difference between common cause variation and special cause variation?
> Refer to Problem 19.22 concerning waiting time for customers at a bank (data stored in BankTime ). Suppose management has set a USL of five minutes on waiting time and specified that at least 99% of the waiting times must be less than five minutes in ord
> Refer to Problem 19.27 concerning a filling machine for a tea bag manufacturer (data stored in Tea3 ). In that problem, you should have concluded that the process is in control. The label weight for this product is 5.5 grams, the LSL is 5.2 grams, and th
> Refer to the data in Problem 19.25 concerning the tensile strengths of bolts of cloth (stored in Tensile ). There is no USL for tensile strength, and the LSL is 13. a. Estimate the percentage of bolts that are within specifications. b. Calculate the Cpk
> Referring to the data of Problem 19.24, stored in SpWater , the researchers stated, “Some of the benefits of a capable process are increased customer satisfaction, increased operating efficiencies, and reduced costs.” To illustrate this point, the author
> Why can’t an opportunity loss be negative?
> A manufacturing company makes brackets for bookshelves. The brackets provide critical structural support and must have a 90-degree bend {1 degree. Measurements of the bend of the brackets were taken at 18 different times. Five brackets were sampled at ea
> A filling machine for a tea bag manufacturer produces approximately 170 tea bags per minute. The process manager monitors the weight of the tea placed in individual bags. A subgroup of n = 4 tea bags is taken every 15 minutes for 25 consecutive time peri
> The director of radiology at a large metropolitan hospital has the business objective of improving the scheduling in the radiology facilities. On a typical day, 250 patients are transported to the radiology department for treatment or diagnostic procedur
> The data in Tensile represent the tensile strengths of bolts of cloth. The data were collected in subgroups of three bolts of cloth over a 25-hour period. a. Construct a control chart for the range. b. Construct a control chart for the mean. c. Is the pr
> An article in the Mid-American Journal of Business presents an analysis for a spring water bottling operation. One of the characteristics of interest is the amount of magnesium, measured in parts per million (ppm), in the water. The data in the table on
> The manager of a branch of a local bank has the business objective of reducing the waiting times of customers for teller service during the 12:00 noon-to-1:00 p.m. lunch hour. A subgroup of four customers is selected (one at each 15-minute interval durin
> The following summary of data is for subgroups of n = 4 for a 10-day period: a. Compute control limits for the range. b. Is there evidence of special cause variation in (a)? c. Compute control limits for the mean. d. Is there evidence of special cause
> The following summary of data is for subgroups of n = 3 for a 10-day period: a. Compute control limits for the range. b. Is there evidence of special cause variation in (a)? c. Compute control limits for the mean. d. Is there evidence of special cause
> For subgroups of n = 3, what is the value of a. the d2 factor? b. the d3 factor? c. the D3 factor? d. the D4 factor? e. the A2 factor?
> How are opportunity losses computed from payoffs?
> For subgroups of n = 4, what is the value of a. the d2 factor? b. the d3 factor? c. the D3 factor? d. the D4 factor? e. the A2 factor?
> Rochester-Electro-Medical Inc. is a manufacturing company based in Tampa, Florida, that produces medical products. Management had the business objective of improving the safety of the workplace and began a safety sampling study. The following data (store
> A member of the volunteer fire department for Trenton, Ohio, decided to apply the control chart methodology he learned in his business statistics class to data collected by the fire department. He was interested in determining whether weeks containing mo
> Falls are one source of preventable hospital injury. Although most patients who fall are not hurt, a risk of serious injury is involved. The data in PtFalls represent the number of patient falls per month over a 28-month period in a 19-bed AIDS unit at a
> The branch manager of a savings bank has recorded the number of errors of a particular type that each of 12 tellers has made during the past year. The results (stored in Teller ) are as follows: a. Do you think the bank manager will single out Gina for
> To improve service quality, the owner of a dry-cleaning business has the business objective of reducing the number of drycleaned items that are returned for rework per day. Records were kept for a four-week period (the store is open Monday through Saturd
> The following data were collected on the number of nonconformities per unit for 10 time periods: a. Construct the appropriate control chart and determine the LCL and UCL. b. Are there any special causes of variation?
> The following data were collected on the number of nonconformities per unit for 10 time periods: a. Construct the appropriate control chart and determine the LCL and UCL. b. Are there any special causes of variation?
> Obtain a version of the red bead experiment for your class. a. Conduct the experiment in the same way as described in this section. b. Remove 400 red beads from the bead bowl before beginning the experiment. How do your results differ from those in (a)?
> In the red bead experiment, how do you think many managers would have reacted after Day 1? Day 2? Day 3?
> What are the advantages and disadvantages of a payoff table as compared to a decision tree?
> A regional manager of a telecommunications company is responsible for processing requests concerning additions, changes, and deletions of service. She forms a service improvement team to look at the corrections to the orders in terms of central office eq
> The manager of the accounting office of a large hospital has the business objective of reducing the number of incorrect account numbers entered into the computer system. A subgroup of 200 account numbers is selected from each day’s output, and each accou
> The bottling division of Sweet Suzy’s Sugarless Cola maintains daily records of the occurrences of unacceptable cans flowing from the filling and sealing machine. The data in Colaspc lists the number of cans filled and the number of nonconforming cans fo
> A hospital administrator has the business objective of reducing the time to process patients’ medical records after discharge. She determined that all records should be processed within 5 days of discharge. Thus, any record not processed within 5 days of
> The following data (stored in Canister) represent the findings from a study conducted at a factory that manufactures film canisters. For 32 days, 500 film canisters were sampled and inspected. The following table lists the number of defective film canist
> A medical transcription service enters medical data on patient files for hospitals. The service has the business objective of improving the turnaround time (defined as the time between sending data and the time the client receives completed files). After
> The following data were collected on nonconformances for a period of 10 days: a. On what day is the proportion of nonconformances largest? Smallest? b. What are the LCL and UCL? c. Are there any special causes of variation?
> What are the different approaches to choosing an appropriate forecasting model?
> How does autoregressive modeling differ from the other approaches to forecasting?
> What is the difference between an event and an alternative course of action?
> For the following payoff table, the probability of event 1 is 0.8, the probability of event 2 is 0.1, and the probability of event 3 is 0.1: a. Determine the optimal action based on the maximax criterion. b. Determine the optimal action based on the ma
> How does the least-squares linear trend forecasting model developed in this chapter differ from the least-squares linear regression model considered in Chapter 13?
> Under what circumstances is the exponential trend model most appropriate?
> What is the difference between moving averages and exponential smoothing?
> What are the different components of a time-series model?
> What is a time series?
> The file Gold contains the price in London for an ounce of gold (in US$) at the end of each quarter from 2004 through 2016. Source: Data extracted from USAGold, “Daily Gold Price History,” bit.ly/2w8iBSl. a. Plot the data. b. Develop an exponential trend
> The file Silver-Q contains the price in London for an ounce of silver (in US$) at the end of each quarter from 2004 through 2016. Source: Data extracted from USAGold, “Daily Silver Price History,” bit.ly/2w8iBSl. a. Plot the data. b. Develop an exponenti
> The file CallCenter contains the monthly call volume for an existing product. Source: Data extracted from S. Madadevan and J. Overstreet, “Use of Warranty and Reliability Data to Inform Call Center Staffing,” Quality Engineering 24 (2012): 386–399. a. Co
> The file Freezer from January 2012 to December 2016 contains the number (in thousands) of freezer shipments in the United States from January 2012 to December 2016. Source: Data extracted from www.statista.com and “Forecasts/Shipments Archives,” bit.ly/2
> Are gasoline prices higher during the height of the summer vacation season than at other times? The file GasPrices contains the mean monthly prices (in $/gallon) for unleaded gasoline in the United States from January 2006 to June 2017. Source: Data extr
> Refer to Problems 20.3–20.5 and 20.12–20.14, respectively. In which problems do you think the expected monetary value (risk-neutral) criterion is inappropriate? Why?
> The data in Toys R Us are quarterly revenues (in $millions) for Toys R Us from 1996-Q1 through 2017-Q1. Source: Data extracted from Standard & Poor’s Stock Reports, November 1995, November 1998, and April 2002, and Toys R Us, Inc., www.toysrus.com. a. Do
> Refer to the exponential model given in Problem 16.42. a. What is the fitted value of the series in the fourth quarter of 2017? b. What is the fitted value of the series in the first quarter of 2017? c. What is the forecast in the fourth quarter of 2017?
> In forecasting a quarterly time series over the five-year period from the first quarter of 2013 through the fourth quarter of 2017, the exponential trend forecasting equation is given by where quarter zero is the first quarter of 2013. Take the antilog
> In forecasting daily time-series data, how many dummy variables are needed to account for the seasonal component day of the week?
> In forecasting a monthly time series over a five-year period from January 2013 to December 2017, the exponential trend forecasting equation for January is Take the antilog of the appropriate coefficient from this equation and interpret the a. Y interce
> Refer to the results for Problem 16.13 on page 645 that used the file GDP , a. perform a residual analysis. b. compute the standard error of the estimate (SYX). c. compute the MAD. d. On the basis of (a) through (c), are you satisfied with your linear tr
> Using the average baseball salary data for Problem 16.18 on page 645 and Problem 16.30 on page 655 (stored in BBSalaries ), a. perform a residual analysis for each model. b. compute the standard error of the estimate (SYX) for each model. c. compute the
> Using the number of passenger cars produced in the U.S. data for Problem 16.17 on page 645 and Problem 16.29 on page 655 (stored in CarProduction ), a. perform a residual analysis for each model. b. compute the standard error of the estimate (SYX) for ea
> In recent years, the share of Greek yogurts in the U.S. yogurt market has grown from 1% to over 50%, greatly increasing the variety of Greek yogurts available for sale. The file Yogurt contains the attributes of 17 regular plain, Greek plain, and regular
> With an assist from Moneyball: The Art of Winning an Unfair Game, a book by Michael Lewis, published in 2003 (and later adapted for the movie Moneyball), the management of professional teams in sports such as baseball, football, basketball, and hockey ha
> The manager of a warehouse for a telecommunications company is involved in a process that receives expensive circuit boards and returns them to central stock so that they can be reused at a later date. Speedy processing of these circuit boards is critica
> Develop a model to predict the asking price of houses in Silver Spring, Maryland, based on living space, lot size, whether the has a fireplace, the number of bedrooms, the number of bathrooms, age, whether it has central air conditioning, the number of p
> A specialist in baseball analytics seeks to study which baseball teams were most similar in a recent season. The specialist has collected data in Baseball related to ERA, saves, runs scored, hits allowed, walks allowed, and errors for that recent season.
> A market research study has been conducted by a travel website that specializes in restaurants with the business objective to determine which food cuisines are perceived to be similar and which are perceived to be different. The following cuisine types w
> Using the yearly amount of solar power generated by utilities (in millions of kWh) in the United States from 2002 through 2016 data for Problem 16.16 on page 645 (stored in SolarPower ), a. fit a third-order autoregressive model to the amount of solar p
> Using the average baseball salary from 2000 through 2017 data for Problem 16.18 on page 645 (stored in BBSalaries ), a. fit a third-order autoregressive model to the average baseball salary and test for the significance of the third-order autoregressive
> Using the data for Problem 16.17 on page 645 concerning the number of passenger cars produced in the United States from 1999 to 2016 (stored in CarProduction ), a. fit a third-order autoregressive model to the number of passenger cars produced in the Uni
> Using the data for Problem 16.12 on page 645 concerning the bonuses paid to workers on Wall Street from 2000 to 2016 (stored in Bonuses ), a. fit a third-order autoregressive model to the bonuses paid and test for the significance of the third-order auto
> Using the data for Problem 16.15 on page 645 that represent the number of new, single-family houses sold in the U.S. from 1992 through 2016 (stored in HouseSales ), a. fit a third-order autoregressive model to the new single-family homes sold and test fo
> Refer to Problem 16.24. Suppose, when testing for the appropriateness of the fitted model, the standard errors are Sa1 = 0.45 Sa2 = 0.35 Sa3 = 0.15 a. What conclusions can you reach? b. Discuss how to proceed if forecasting is still your main objective.
> How does multiple correspondence analysis differ from multidimensional scaling?
> In Problem 20.16, an author is deciding which of two competing publishing companies to select to publish her new novel. Prior to making a final decision, the author decides to have an experienced reviewer examine her novel. This reviewer has an outstandi
> How do classification trees differ from regression trees?
> What is the difference between supervised and unsupervised analytics methods?
> Have you wondered how Internet connection speed varies around the globe? The file ConnectionSpeed contains the mean connection speed, the mean peak connection speed, the percent of the time the connection speed is above 4 mbps, and the percent of the tim
> The file MobileSpeed contains the overall download and upload speeds in mbps for nine carriers in the United States. Source: Data extracted from “Best Mobile Network 2016,” bit.ly/1KGPrMm, accessed November 10, 2016. a. Perform a multidimensional scaling
> A Pew Research Center survey found that social networking is popular in many nations around the world. The file GlobalSocialMedia contains the level of social media networking (measured as the percent of individuals polled who use social networking sites
> The file Protein contains calorie and cholesterol information for popular protein foods (fresh red meats, poultry, and fish) compiled by the U.S. Department of Agriculture. a. Perform a multidimensional scaling analysis on the protein foods based on the
> The file Cereals contains the calories, carbohydrates, and sugar, in grams, in one serving of seven breakfast cereals. a. Perform a multidimensional scaling analysis on the cereals based on the calories, carbohydrates, and sugar in grams. b. What conclus
> Movie companies need to predict the gross receipts of individual movies once the movie has debuted. The following results, stored in PotterMovies , are the first weekend gross, the U.S. gross, and the worldwide gross (in $millions) of the Harry Potter mo
> The file Social Response contains the product category, sentiment rating, and customer type and frequency of posting (low, average, high) for 300 recently posted comments to a retailer’s community website. a. Conduct a multiple correspondence analysis of
> The file HybridSales contains the number of domestic and imported hybrid vehicles sold in the United States from 1999 to 2016. Source: Data extracted from Oak Ridge National Laboratory, “Vehicle Technologies Market Report,” bit.ly/2xrcrtO. You want to be
> In Problem 20.14, an investor is trying to determine the optimal investment decision among three investment opportunities. Prior to making his investment decision, the investor decides to consult with his financial adviser. In the past, when the economy
> A survey was conducted on the characteristics of households in the United States. The data (which have been altered from an actual study to preserve the anonymity of the respondents) are stored in Households . The variables are gender, age, Hispanic orig
> A mining company operates a large heap-leach gold mine in the western United States. The gold mined at this location consists of ore that is very low grade, having about 0.0032 ounce of gold in 1 ton of ore. The process of heap-leaching involves the mini

