Question: According to data released by the U.
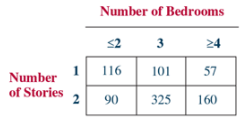
According to data released by the U.S. Department of Housing and Urban Development about new homes built in the United States, there is an almost 50–50 split between one-story and two-story homes. In addition, more than half of all new homes have three bedrooms. Suppose a study is done to determine whether the number of bedrooms in a new home is independent of the number of stories. Use ( = .10 and the following contingency table to conduct a chi-square test of independence to determine whether, in fact, the number of bedrooms is independent of the number of stories.
> Shown here is Minitab output for a Friedman test. Discuss the experimental design and the outcome of the experiment. Friedman Test: Observations Versus Treatment Blocked by Block
> A process produced good parts and defective parts. A sample of 60 parts was taken and inspected. Eight defective parts were found. The sequence of good and defective parts was analyzed by using Minitab. The output is given here. With a two-tailed test an
> Shown here is Minitab output from a Friedman test. What is the size of the experimental design in terms of treatment levels and blocks? Discuss the outcome of the experiment in terms of any statistical conclusions. Friedman Test: Observations Versus Trea
> Does the configuration of the workweek have any impact on productivity? This question is raised by a business analyst who wants to compare the traditional 5-day workweek with a 4-day workweek and a workweek with three 12-hour days and one 4-hour day. The
> An experiment is undertaken to study the effects of four different medical treatments on the recovery time for a medical disorder. Six physicians are involved in the study. One patient with the disorder is sampled for each physician under each treatment,
> Study the following Minitab Residuals Versus Fits graphic for a simple regression analysis. Comment on the residual evidence of lack of compliance with the regression assumptions.
> Use the Friedman test and ( = .05 to test the following data to determine whether there is a significant difference between treatment levels.
> Use the following data to test to determine whether there are any differences between treatment levels. Let ( = .05.
> Do workers on different shifts get different amounts of sleep per week? Some people believe that shift workers who regularly work the graveyard shift (12:00 a.m. to 8:00 a.m.) or swing shift (4:00 p.m. to 12:00 a.m.) are unable to get the same amount of
> A survey by the U.S. Travel Data Center showed that a higher percentage of Americans travel to the ocean/beach for vacation than to any other destination. Much further behind in the survey, and virtually tied for second place, were the mountains and smal
> Does the asking price of a new car vary according to whether the dealership is in a small town, a city, or a suburban area? To test this question, an analyst randomly selects dealerships selling Buicks in the state of Illinois. The analyst goes to these
> Is there a difference in the amount of customers’ initial deposits when they open savings accounts according to geographic region of the United States? To test this question, an analyst selects savings and loan offices of equal size fro
> Use the Kruskal-Wallis test to determine whether there is a significant difference in the following groups. Use ( = .05.
> Test the following sequence of observations by using the runs test and ( = .05 to determine whether the process produced random results. M M N N N N N M M M M M M N N M M M M M N M M N N N N N N N N N N N N N M M M M M M M M M M M
> Use the Kruskal-Wallis test to determine whether groups 1 through 5 come from different populations. Let ( = .01.
> Suppose 16 people in various industries are contacted in 2018 and asked to rate business conditions on several factors. The ratings of each person are tallied into a “business optimism” score. The same people are conta
> Graph the following residuals, and indicate which of the assumptions underlying regression appear to be in jeopardy on the basis of the graph. x ______________ y − ŷ 10 ……………………. +6 11 ……………………. +3 12 ……………………. −1 13 …..………………. −11 14 ……………………. −3 15 ………
> American attitudes toward big business change over time and probably are cyclical. Suppose the following data represent a survey of 20 American adults taken in 1993 and again in 2019 in which each adult was asked to rate American big business overall on
> According to an NCR white paper, it can probably be concluded that most cashiers at high-volume stores receive little or no training on how to properly scan items. What little cashier training that is done is typically focused on operating the point-of-s
> A corporation owns a chain of several hundred gasoline stations on the eastern seaboard. The marketing director wants to test a proposed marketing campaign by running ads on some local television stations and determining whether gasoline sales at a sampl
> Use the Wilcoxon matched-pairs signed rank test and ( = .05 to analyze the before-and-after measurements given. Assume the underlying distributions are symmetrical. Before __________ After 49 ……………………………….. 43 41 ……………………………….. 29 47 ……………………………….. 30 39
> Use the Wilcoxon matched-pairs signed rank test to determine whether there is a significant difference between the two groups of related data given. Use ( = .10. Assume the underlying distributions are symmetrical.
> According to trulia.com, the average listing price for a home in Albuquerque in a recent week was $221,441 compared to $218,555 for Tulsa that same week. Suppose a survey of 13 randomly selected single-family homes is taken in Albuquerque and a survey of
> Do male stock market investors earn significantly more than female stock market investors? One study by the New York Stock Exchange showed that male investors have an income of $46,400 and that female investors have an income of $39,400. Suppose an analy
> Suppose 12 urban households and 12 rural households are selected randomly and each family is asked to report the amount spent on food at home annually. The results follow. Use a Mann-Whitney U test to determine whether there is a significant difference b
> Test the following sequence of observations by using the runs test and ( = .05 to determine whether the process produced random results. X X X Y X X Y Y Y X Y X Y X X Y Y Y Y X
> Use the following contingency table to determine whether variable 1 is independent of variable 2. Let = ( = .01.
> Graph the following residuals, and indicate which of the assumptions underlying regression appear to be in jeopardy on the basis of the graph. x _____________ y − ŷ 213 ………………….. −11 216 ………………….. −5 227 ………………….. −2 229 ………………….. −1 237 ………………….. +6 24
> Use the following contingency table to test whether variable 1 is independent of variable 2. Let ( = .01.
> According to a report by the U.S. Environmental Protection Agency (EPA), containers and packaging generated about 30.3% of all municipal solid waste (MSW) in the country in a recent year. This was the largest category of such waste. The next highest grou
> The Springfield Emergency Medical Service keeps records of emergency telephone calls. A study of 150 five-minute time intervals resulted in the distribution of number of calls that follows. For example, during 18 of the five-minute intervals, no calls oc
> The following percentages come from a national survey of the ages of prerecorded-music shoppers. A local survey produced the observed values. Does the evidence in the observed data indicate that we should reject the national survey distribution for local
> In one survey, successful female entrepreneurs were asked to state their personal definition of success in terms of several categories from which they could select. Thirty-nine percent responded that happiness was their definition of success, 12% said th
> Are the following data Poisson distributed? Use ( = .05 and the chi-square goodness-of-fit test to answer this question. What is your estimated lambda? Number of Arrivals __________ fo 0 …………………………………………… 28 1 ………………………………………….… 17 2 …………………………………………… 11
> Do men and women prefer the same colors of cars? That is, is sex independent of color preference for cars? Suppose a study is undertaken to address this question. A random sample of men and women is asked which of five colors (silver, white, black, green
> A survey by Ipsos-Reid reported in American Demographics showed that if a person was given a $1,000 windfall, 36% would spend the money on home improvement, 24% on leisure travel/vacation, 15% on clothing, 15% on home entertainment or electronic products
> Is the number of children that a college student currently has independent of the type of college or university being attended? Suppose students were randomly selected from three types of colleges and universities and the data shown represent the results
> Are the types of professional jobs held in the computing industry independent of the number of years a person has worked in the industry? Suppose 246 workers are interviewed. Use the results obtained to determine whether type of professional job held in
> Wisconsin is an important milk-producing state. Some people might argue that because of transportation costs, the cost of milk increases with the distance of markets from Wisconsin. Suppose the milk prices in eight cities are as follows. Cost of Milk (pe
> Determine the value of r for the following data.
> According to Beverage Digest, the distribution of market share for the top seven carbonated soft drinks in the United States is: Coke 17.6%, Pepsi-Cola 8.8%, Diet Coke 8.5%, Mt. Dew 6.9%, Dr. Pepper 6.8%, Sprite 6.0%, and Diet Pepsi 4.3%. Others accounte
> Are random arrivals at a shoe store at the local mall Poisson distributed? Suppose a mall employee researches this question by gathering data for arrivals during one-minute intervals on a weekday between 6:30 p.m. and 8:00 p.m. The data obtained follow.
> Use the following data and ( = .01 to determine whether the observed frequencies represent a uniform distribution. Category ___________ fo 1 ……………………………….. 19 2 ……………………………….. 17 3 ……………………………….. 14 4 ……………………………….. 18 5 ……………………………….. 19 6 ……………………………….
> A researcher interviewed 2067 people and asked whether they were the primary decision makers in the household when buying a new car last year. Two hundred seven were men and had bought a new car last year. Sixty-five were women and had bought a new car l
> A national youth organization sells six different kinds of cookies during its annual cookie campaign. A local leader is curious about whether national sales of the six kinds of cookies are uniformly distributed. He randomly selects the amounts of each ki
> Is a manufacturer’s geographic location independent of type of customer? Use the following data for companies with primarily industrial customers and companies with primarily retail customers to test this question. Let ( = .10.
> Use the chi-square contingency analysis to test to determine whether variable 1 is independent of variable 2. Use 5% level of significance.
> Use a chi-square goodness-of-fit test to determine whether the following observed frequencies are distributed the same as the expected frequencies. Let ( = .01.
> A study was conducted to determine the impact of a major Mexican peso devaluation on U.S. border retailers. As a part of the study, data were gathered on the magnitude of business that U.S. border retailers were doing with Mexican citizens. Forty-one sho
> The equation of a regression line is ŷ = 50.506 – 1.646x and the data are as follows. Solve for the residuals and graph a residual plot. Do these data seem to violate any of the assumptions of regression?
> Is the transportation mode used to ship goods independent of type of industry? Suppose the following contingency table represents frequency counts of types of transportation used by the publishing and the computer hardware industries. Analyze the data by
> A group of 30-year-olds is interviewed to determine whether the type of music most listened to by people in their age category is independent of the geographic location of their residence. Use the chi-square test of independence, ( = .01, and the followi
> Use the following contingency table and the chi-square test of independence to determine whether social class is independent of number of children in a family. Let ( = .05.
> Use a chi-square goodness-of-fit test to determine whether the observed frequencies are distributed the same as the expected frequencies (α = .05)
> The following data show the number of issues from initial public offerings (IPOs) for a 13-year period released by the Securities Data Company. Use these data to develop forecasts for the years 3 through 13 using exponential smoothing techniques with alp
> The U.S. Census Bureau publishes data on factory orders for all manufacturing, durable goods, and nondurable goods industries. Shown here are factory orders in the United States over a 13-year period ($ billions). a) Use these data to develop forecasts f
> Following are time-series data for nine time periods. Use exponential smoothing with constants of .3 and .7 to forecast time periods 3 through 9. Let the value for time period 1 be the forecast for time period 2. Compute additional forecasts for time per
> Following are time-series data for eight different periods. Use exponential smoothing to forecast the values for periods 3 through 8. Use the value for the first period as the forecast for the second period. Compute forecasts using two different values o
> Use the following time-series data to answer the given questions. a) Develop forecasts for periods 5 through 10 using 4-month moving averages. b) Develop forecasts for periods 5 through 10 using 4-month weighted moving averages. Weight the most recent m
> Shown below is the Excel output for a regression analysis to predict the number of business bankruptcy filings over a 16-year period by the number of consumer bankruptcy filings. How strong is the model? Note the residuals. Compute a Durbin-Watson statis
> In Problem 12.10, you were asked to develop the equation of a regression model to predict the number of business bankruptcies by the number of firm births. Using this regression model and the data given in Problem 12.10 (and provided here again), solve f
> The purchasing-power value figures for the minimum wage in dollars for the years 1 through 18 are shown here. Use these data and exponential smoothing to develop forecasts for years 2 through 18. Try α = .1, .5, and .8, and compare the resu
> Shown here are data from the Investment Company Institute on Total Net Assets and Total Number of Shareholder Accounts of money market funds over a period of 28 years. Use these data to develop a regression model to forecast Total Net Assets by the Total
> The Board of Governors of the Federal Reserve System publishes data on mortgage debt outstanding by type of property and holder. The following data give the amounts of residential nonfarm debt (in $ billions) held by savings institutions in the United St
> Use both a linear and quadratic model to explore trends in the deseasonalized data from Problem 15.40. Which model seems to produce a better fit of the data? Refer to the Problem Data 15.40: Time Period ___Industrial Machinery and Equipment Shipments 1s
> Use the seasonal indexes computed to deseasonalize the data in Problem 15.39. Refer to the Problem Data 15.39: Time Period ___Industrial Machinery and Equipment Shipments 1st quarter (year 1) …………………………………. 54.019 2nd quarter …………………………………………... 56.495
> Figures for acres of tomatoes harvested in the United States from an 11-year period follow. The data are published by the U.S. Department of Agriculture. With these data, forecasts have been made by using techniques presented later in this chapter. Compu
> The U.S. Department of Commerce publishes data on industrial machinery and equipment. Shown here are the shipments (in $ billions) of industrial machinery and equipment from the first quarter of year 1 through the fourth quarter of year 6. Use these data
> In the Survey of Current Business, the U.S. Department of Commerce publishes data on farm commodity prices. Given are the cotton prices from November of year 1 through February of year 4. The prices are indexes with a base of 100 from the year 1910. Use
> Shown here are the consumer price indexes (CPIs) for housing for the years 1995 through 2018 from the Bureau of Labor Statistics Data website. Use the data to answer the following questions. a) Compute the 4-year moving average to forecast the CPIs from
> Given below are data on the number of business establishments (millions) and the self-employment rate (%) released by the Small Business Administration, Office of Advocacy, for a 21-year period of U.S. business activity. Develop a regression model to pre
> Solve for the predicted values of y and the residuals for the data in Problem 12.9. The data are provided here again.
> Shown here are retail price figures and quantity estimates for five different food commodities over 3 years. Use these data and a base year of 2017 to compute unweighted aggregate price indexes for this market basket of food. Using a base year of 2017, c
> Determine the trend for the data in Problem 15.32 using the deseasonalized data from Problem 15.33. Explore both a linear and a quadratic model in an attempt to develop the better trend model. Refer to the Problem Data 15.32-15.33: Time Period ________
> Use the seasonal indexes computed to deseasonalize the data in Problem 15.32. Refer to the Problem Data 15.32: Time Period ________________ Chemicals and Allied Products ($ billions) January (year 5) ……â
> The U.S. Department of Commerce publishes a series of census documents referred to as Current Industrial Reports. Included in these documents are the manufacturers’ shipments, inventories, and orders over a 5-year period. Displayed here
> The following data contain the quantity (million pounds) of U.S. domestic fish caught annually over a 25- year period as published by the National Oceanic and Atmospheric Administration. a) Use a 3-year moving average to forecast the quantity of fish for
> Using the following data and 2016 as the base year, compute the Laspeyres price index for 2019 and the Paasche price index for 2018.
> Using the following data, determine the values of MAD and MSE. Which of these measurements of error seems to yield the best information about the forecasts? Why?
> Compute unweighted aggregate price index numbers for each of the given years using 2015 as the base year.
> Compute index numbers for the following data using 2000 as the base year.
> Following are the average yields of long-term new corporate bonds over a several-month period published by the Office of Market Finance of the U.S. Department of the Treasury. a) Explore trends in these data by using regression trend analysis. How stron
> Solve for the predicted values of y and the residuals for the data in Problem 12.8. The data are provided here again.
> Calculate Paasche price indexes for 2017 and 2018 using the following data and 2005 as the base year.
> Calculate Laspeyres price indexes for 2016–2018 from the following data. Use 2005 as the base year.
> Suppose the following data are prices of market goods involved in household transportation for the years 2011 through 2018. Using 2013 as a base year, compute aggregate transportation price indexes for this data.
> Using the data that follow, compute the aggregate index numbers for the four types of meat. Let 1995 be the base year for this market basket of goods.
> The U.S. Patent and Trademark Office reports fiscal year figures for patents issued in the United States. Following are the numbers of patents issued for the years 1980 through 2015. Using these data and a base year of 1990, determine the simple index nu
> Suppose the following data represent the price of 20 reams of office paper over a 65-year time frame. Find the simple index numbers for the data. a) Let 1950 be the base year. b) Let 1980 be the base year.
> The U.S. Department of Agriculture publishes data on the production, utilization, and value of fruits in the United States. Shown here are the amounts of non-citrus fruit processed into juice (in kilotons) for a 25-year period. Use these data to develop
> Determine the error for each of the following forecasts. Compute MAD and MSE.
> Current Construction Reports from the U.S. Census Bureau contain data on new privately owned housing units. Data on new privately owned housing units (1000s) built in the West over a 31-year period follow. Use these time-series data to develop an auto-re
> Use the data in Problem 15.17 to compute a regression model after recoding the data by the first-differences approach. Compute a Durbin-Watson statistic to determine whether significant autocorrelation is present in this first-differences model. Compare
> Solve for the predicted values of y and the residuals for the data in Problem 12.7. The data are provided here again.
> The Federal Deposit Insurance Corporation (FDIC) releases data on bank failures. Following are data on the number of U.S. bank failures in a given year and the total amount of bank deposits (in $ millions) involved in such failures for a given year. Use
> Use the data from Problem 15.15 to create a regression forecasting model using the first-differences data transformation. How do the results from this model differ from those obtained in Problem 15.15? Refer to the Problem Data 15.15:
> The U.S. Department of Labor publishes consumer price indexes (CPIs) on many commodities. Following are the percentage changes in the CPIs for food and for shelter for the years 2001 through 2018. Use these data to develop a linear regression model to fo
> The U.S. Department of Commerce publishes census information on manufacturing. Included in these figures are monthly shipment data for the paperboard container and box industry shown below for 6 years. The shipment figures are given in millions of dollar
> The U.S. Department of Agriculture publishes statistics on the production of various types of food commodities by month. Shown here are the production figures on broccoli for January of a recent year through December of the next year. Use these data to c
> Shown below are dollar figures for commercial and industrial loans at all commercial banks in the United States as recorded for the month of April during a recent 9-year period and published by the Federal Reserve Bank of St. Louis. Plot the data, fit a

