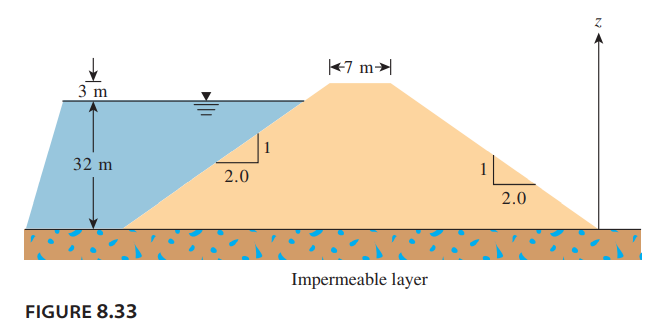
Question: An earth dam section is shown in
An earth dam section is shown in Figure 8.33. Determine the rate of seepage through the earth dam using Pavlovsky’s solution. Use k = 4 × 10⁻⁵ mm/s.
> As shown in Figure 6.11, a roulette wheel has 38 numbers, with 18 odd numbers (black) and 18 even numbers (red), as well as 0 and 00 (which are green). If you bet $5 that the outcome is an odd number, the probability of losing the $5 is 20/38 and the pro
> Which of the following are likely to have a correlation? a. Amounts donated to charities in a year and annual incomes. b. Hat sizes and annual incomes of randomly selected adults. c. Braking reaction times and weights of randomly selected adults. d. Heig
> You arrive at a bus stop randomly, and all arrival times are equally likely. The bus arrives regularly every 24 minutes without delay. What is the expected value for your waiting time?
> There is a 0.9968 probability that a randomly selected 50-year-old female will live through the year. A life insurance company charges $226 for insuring that the female will live through the year. If she does not survive the year, the policy pays out $50
> There is a 0.9986 probability that a randomly selected 30-year-old male will live through the year. A life insurance company charges $161 for insuring that the male will live through the year. If he does not survive the year, the policy pays out $100,000
> If you bet $1 in Kentucky’s Pick 4 lottery, you either lose $1 or gain $4999. (The winning prize is $5000, but your $1 bet is not returned, so the net gain is $4999.) The game is played by selecting a four-digit number between 0000 and 9999. What is the
> Suppose you are offered this opportunity: You can place a bet of $10 and someone else tosses a coin. You win an additional $15 if heads occurs, and you lose your $10 if tails occurs. What is the expected value of this game? Should you play?
> A person who has a habit of driving fast has never had a traffic citation. What does it mean to say that “the law of averages will catch up with him”? Is it true? Explain.
> In analyzing genders of newborns, assume that boys and girls are equally likely. Among 500 births, should we expect exactly 250 boys and 250 girls? As the number of births increases, what does the law of large numbers tell us about the proportion of girl
> I haven’t won in my last 25 pulls on the slot machine, so I’m due to win on the next couple of pulls.
> For the California Daily 3 lottery, in which you pick three numbers, it is better to select the numbers 5-3-9 than the numbers 1-2-3, because 5-3-9 is more random.
> For a $1 “straight” bet in the California Daily 3 lottery, the expected return is 64¢, so betting a dollar for fun is okay, but it is unwise to bet much money on this lottery.
> If a best-fit line is inserted in a scatterplot, it must pass through every point on the graph.
> For a typical lottery, the expected value of a ticket is less than the cost of a ticket.
> What is a probability distribution? Briefly describe a format that is used to display a probability distribution.
> Briefly describe the theoretical, relative frequency, and subjective methods for finding probabilities. Give an example of each.
> What does it mean when we write P(A)? What is the possible range of values for P(A), and why?
> Distinguish between an outcome and an event in probability. Give an example in which the same event can occur via two or more outcomes.
> The histogram in Figure 6.9 shows the distribution of “Mega” numbers (possible values range from 1 to 27) that were drawn in 1639 separate plays of the California lottery game Mega Millions. a. Assuming the lottery dra
> After constructing a table that is similar to Table 6.2 and shows all possible outcomes of tossing four coins at once, find the following. a. Find the probability that all four tosses are the same (all heads or all tails). b. Find the probability that th
> In a clinical trial in which 73 patients with carpal tunnel syndrome were treated with surgery, 67 had successful treatment (based on data from “Splinting vs. Surgery in the Treatment of Carpal Tunnel Syndrome” by Gerritsen et al., Journal of the America
> Halfway through the season, a basketball player has made 72% of her free throws. What is the probability that her next free throw will be successful?
> What is the probability of a 100-year flood happening this year?
> Every possible correlation coefficient must lie between the values of ____ and____.
> After recording the forecasts of your local meteorologist for 30 days, you conclude that she gave a correct forecast for 26 days. What is the probability that her next forecast will be correct?
> Suppose you randomly select a family with four children. Assume that births of boys and girls are equally likely. a. How many birth orders are possible? List them in a probability distribution table. b. What is the probability that the family has four ch
> Suppose you randomly select a family with three children. Assume that births of boys and girls are equally likely. a. How many birth orders are possible? List them in a probability distribution table. b. What is the probability of two boys and a girl? c.
> The New England College of Medicine uses an admissions test with many multiple-choice questions, each with five possible answers, only one of which is correct. If you guess randomly on every question, what score might you expect to get? (Express the answ
> A bag contains 13 red M&Ms, 25 orange M&Ms, 8 yellow M&Ms, 8 brown M&Ms, 27 blue M&Ms, and 19 green M&Ms. When randomly selecting one M&M, what is the probability of drawing a red M&M? A blue M&M? A yellow M&M? An M&M that is not orange?
> What is the probability of not buying a defective smart phone when quality control surveys indicate that 2% of all smart phones purchased are defective?
> What is the probability of randomly selecting a person and getting someone who does not have type O blood, given that 45% of people have type O blood?
> What is the probability of finding that the next President of the United States was not born on Saturday?
> What is the probability that a 75% free-throw shooter will miss her next free throw?
> What is the probability of randomly selecting a day of the week and not picking a day whose name includes the letter “t”?
> Find the probability of getting someone who failed the exam or was in Group A.
> A Las Vegas handicapper can correctly predict the winner in a professional basketball game 60% of the time. What is the probability that she is wrong in her next prediction?
> Refer to Figure 9.29. For the variables given, calculate and plot , u, and ’ with depth.
> Refer to Figure 9.29. For the variables given, calculate and plot , u, and ’ with depth.
> From the sieve analysis of a sand, the effective size was determined to be 0.18 mm. Using Hazen’s formula, Eq. (9.34), estimate the range of capillary rise in this sand for a void ratio of 0.65.
> Refer to Figure 9.26. Calculate , u, and ’ at A, B, C, and D for the following cases, and plot the variations with depth. (Note: e = void ratio,  = moisture content, Gs = specific
> Repeat Problem 8.8 using L. Casagrande’s method.
> An earth dam is shown in Figure 8.32. Determine the seepage rate, q, in m3 /day/m length. Given: a1 = 358, a2 = 408, L1 = 5 m, H = 7 m, H1 = 10 m, and k = 3 × 10⁻⁴ cm/s. Use Schaffernak’s solution.
> For the weir shown in Figure 8.31, calculate the seepage in the permeable layer in m3/day/m for x9 = 1 m and x9 = 2 m. Use Figure 8.13.
> Draw a flow net for the weir shown in Figure 8.30. Calculate the rate of seepage under the weir.
> Refer to Problem 8.4. Using the flow net drawn, calculate the hydraulic uplift force at the base of the hydraulic structure per meter length (measured along the axis of the structure).
> For the hydraulic structure shown in Figure 8.29, draw a flow net for flow through the permeable layer and calculate the seepage loss in m3 /day/m.
> The porosity of a soil is 0.35. Given Gs = 2.69, calculate: Saturated unit weight (kN/m3 ) Moisture content when moist unit weight 5 17.5 kN/m3
> Refer to Figure 8.28. Given: H1 = 4 m D1 = 6 m H2 = 1.5 m D = 3.6 m Calculate the seepage loss in m3/day per meter length of the sheet pile (at right angles to the cross section shown). Use Figure 8.12.
> Draw a flow net for the single row of sheet piles driven into a permeable layer as shown in Figure 8.28. Given: H1 = 3 m D = 1.5 m H2 = 0.5 m D1 = 3.75 m Calculate the seepage loss per meter length of the sheet pile (at right angles to the cross s
> Solve Problem 8.10 using L. Casagrande’s method.
> Refer to the cross section of the earth dam shown in Figure 8.19. Calculate the rate of seepage through the dam (q in m3/min/m) using Schaffernak’s solution.
> Refer to Figure 8.28. Given: H1 = 6 m D = 3 m H2 = 1.5 m D1 = 6 m Draw a flow net. Calculate the seepage loss per meter length of the sheet pile (at a right angle to the cross section shown).
> Refer to Figure 7.31. Find the flow rate in m3 /s/m (at right angles to the cross section shown) through the permeable soil layer. Given: H = 5 m, H1 = 2.8 m; h = 3.1 m, L = 60 m,  = 5°, and k = 0.05 cm/s.
> A permeable layer is underlain by an impervious layer, as shown in Figure 7.30. With k = 5.2 ×10⁻⁴ cm/s for the permeable layer, calculate the rate of seepage through it in m3 /hr/m if H = 3.8 m and α = 12°.
> A sand layer of the cross-sectional area shown in Figure 7.29 has been determined to exist for an 800 m length of the levee. The hydraulic conductivity of the sand layer is 2.8 m/day. Determine the quantity of water which flows into the ditch in m3 /min.
> For a falling-head permeability test, the following are given: Length of the soil specimen = 700 mm Area of the soil specimen = 20 cm2 Area of the standpipe = 1.05 cm2 Head difference at time t = 0 is 800 mm Head difference at time t = 8 min is 500 mm De
> A hydrometer test has the following results: Gs = 2.6, temperature of water = 24°C, and R = 43 at 60 minutes after the start of sedimentation (see Figure 2.30). What is the diameter D of the smallest-size particles that have settled beyond the zone of me
> For a falling-head permeability test, the following are given: length of specimen = 380 mm; area of specimen = 6.5 cm2; k = 0.175 cm/min. What should the area of the standpipe be for the head to drop from 650 cm to 300 cm in 8 min?
> For a falling-head permeability test, the following are given: Length of the soil specimen = 500 mm Area of the soil specimen = 26 cm2 Area of the standpipe = 1.3 cm2 Head difference at time t = 0 is 760 mm Head difference at time t = 10 min is 300 mm De
> In a constant-head permeability test in the laboratory, the following are given: L = 305 mm and A = 95 cm2. If the value of k = 0.015 cm/s and a flow rate of 7300 cm3/hr must be maintained through the soil, what is the head difference, h, across the spec
> Refer to Figure 7.5. For a constant-head permeability test in a sand, the following are given: L = 300 mm A = 175 cm2 h = 500 mm Water collected in 3 min = 620 cm3 Void ratio of sand = 0.58 Determine: Hydraulic conductivity, k (cm/s) Seepage veloc
> Consider the setup shown in Figure 7.34 in which three different soil layers, each 200 mm in length, are located inside a cylindrical tube of diameter 150 mm. A constant-head difference of 470 mm is maintained across the soil sample. The porosities and h
> A layered soil is shown in Figure 7.33. Estimate the ratio of equivalent hydraulic conductivity, kH(eq)/kV(eq).
> A layered soil is shown in Figure 7.32. Given: H1 = 1.5 m k1 = 10-5 cm/s H2 = 2.5 m k2 = 3.0 × 10⁻³ cm/s H3 = 3.0 m k3 = 3.5 × 10⁻⁵ cm/s Estimate the ratio of equivalent permeability, kH(eq)/kV(eq).
> The in situ void ratio of a soft clay deposit is 2.1, and the hydraulic conductivity of the clay at this void ratio is 0.91 ×10⁻⁶ cm/s. What is the hydraulic conductivity if the soil is compressed to have a void ratio of 1.1? Use Eq. (7.34).
> For a normally consolidated clay, the following are given: Estimate the hydraulic conductivity at a void ratio e = 0.9. Use Eq. (7.36).
> The sieve analysis for a sand is given in the following table. Estimate the hydraulic conductivity of the sand at a void ratio of 0.5. Use Eq. (7.30) and SF =6.5
> Assume that the retaining wall shown in Figure 14.35 is frictionless. For each problem, determine the Rankine passive force per unit length of the wall, the variation of passive earth pressure with depth, and the location of the resultant.
> For a sandy soil, the following are given: Maximum void ratio = 0.7 Minimum void ratio = 0.46 D10 = 0.2 mm
> The hydraulic conductivity of a sand at a void ratio of 0.5 is 0.022 cm/s. Estimate its hydraulic conductivity at a void ratio of 0.7. Use Eq. (7.31).
> The hydraulic conductivity of a sand at a void ratio of 0.5 is 0.022 cm/s. Estimate its hydraulic conductivity at a void ratio of 0.7. Use Eq. (7.31).
> Refer to the constant-head arrangement shown in Figure 7.5. For a test, the following are given: L = 450 mm A = area of the specimen = 23 cm2 Constant-head difference = h = 700 mm Water collected in 3 min = 350 cm3 Calculate the hydraulic conductivity (c
> For a clayey soil, given: LL = 38, PI = 16, and Gs = 2.68. If a modified Proctor test is conducted, estimate wopt and d(max)/w. Use the method of Gurtug and Sridharan (2004).
> A proposed embankment fill requires 8000 m3 of compacted soil. The void ratio of the compacted fill is specified as 0.7. Four borrow pits are available as described in the following table, which lists the respective void ratios of the soil and the cost p
> The in situ moisture content of a soil is 18%, and the moist unit weight is 105 lb/ft3. The specific gravity of soil solids is 2.75. This soil is to be excavated and transported to a construction site for use in a compacted fill. If the specifications ca
> A field unit weight determination test for the soil described in Problem 6.5 yielded the following data: moisture content = 10.5% and moist density = 1705 kg/m3. Determine the relative compaction.
> The results of a standard Proctor test are given in the following table. Determine the maximum dry density (kg/m3) of compaction and the optimum moisture content.
> For the soil described in Problem 6.3, if Gs = 2.72, determine the void ratio and degree of saturation at optimum moisture content
> The grain-size characteristics of a soil are given in the following table Draw the grain-size distribution curve. Determine the percentages of gravel, sand, silt, and clay according to the MIT system. Repeat Part b according to the USDA system. Repeat
> The results of a standard Proctor test are given here. Determine the maximum dry unit weight of compaction and the optimum moisture content.
> Calculate the variation of dry density (kg/m3) of a soil (Gs = 2.67) at w = 10% and 20% for degree of saturation (S) = 80%, 90%, and 100%.
> Repeat Problem 6.1= with the following values. D10 = 0.09 mm D20 = 0.2= mm D50 = 0.61 mm
> The backfill material for a vibroflotation project has the following grain sizes. D10 = 0.11 mm D20 = 0.19 mm D50 = 1.3 mm
> Following are the results of a field unit weight determination test on a soil using the sand cone method. Calibrated dry density of Ottawa sand = 1667 kg /m3 Calibrated mass of Ottawa sand to fill the cone = 0.117 kg Mass of jar 1 cone 1 sand (before use
> The relative compaction of a sand in the field is 90%. The maximum and minimum dry unit weights of the sand are 108 lb/ft3 and 93 lb/ft3, respectively. For the field conditions, determine: Dry unit weight Relative density of compaction Moist unit weig
> The maximum and minimum dry densities of a sand were determined in the laboratory to be 1682 kg/m3 and 1510 kg/m3, respectively. In the field, if the relative density of compaction of the same sand is 70%, what are its relative compaction (%) and dry den
> The maximum and minimum dry unit weights of a sand were determined in the laboratory to be 104 lb/ft3 and 93 lb/ft3, respectively. What would be the relative compaction in the field if the relative density is 78%?
> Repeat Problem 6.9 using Matteo’s (2009) method.
> Given Gs = 2.75, calculate the zero-air-void unit weight in lb/ft3 for a soil at w = 5%, 8%, 10%, 12%, and 15%.
> The grain-size characteristics are given in the following table. Draw the grain-size distribution curve. Determine the percentages of gravel, sand, silt, and clay: According to the USDA system According to the AASHTO system
> 9% of a soil is retained on No. 4 sieve, and 11% passes the No. 200 sieve. It is also known that 10%, 30%, and 60% of the soil is smaller than 0.1 mm, 0.8 mm, and 1.9 mm, respectively. When Atterberg limit tests are conducted, it is found that the liquid
> Classify the following soils using the Unified soil classification system. Give group symbols and group names.
> Classify the following soils using the Unified soil classification system. Give the group symbols and the group names
> The sieve analysis of ten soils and the liquid and plastic limits of the fraction passing through the No. 40 sieve are given here. Classify the soils using the AASHTO soil classification system and give the group indexes.
> Classify the following soils by the AASHTO soil classification system. Give the group index for each soil.
> Classify the following soils by the AASHTO soil classification system. Give the group index for each soil.
> Liquidity index, LI, defined by Eq. (4.15), can indicate probable engineering behavior depending on the natural or current state of moisture content. For example, the material behavior can vary from a brittle solid (LI  1) to viscous
> Refer to the same soil in Problem 4.7. A single test was conducted with the fall cone device, and the following results were obtained: d =17 mm and w = 28.5%. Using Eqs. (4.5), (4.6), and (4.7), estimate the liquid limit by the one-point method.
> The following results were obtained for a liquid limit test using a fall cone device. Estimate the liquid limit of the soil and the flow index.
> Using the results of Problem 4.3 and Eq. (4.14), estimate the shrinkage limit of the soil.

