Question: Below are the data used to construct
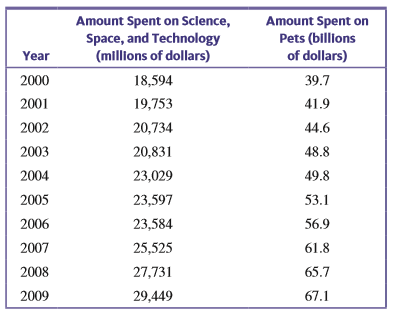
Below are the data used to construct the time series plots in the previous exercise. Calculate the value of the correlation coefficient for the amount spent on science, space, and technology and the amount spent on pets. Explain how this value is consistent with your answer to the previous exercise.
Transcribed Image Text:
Amount Spent on Sclence, Space, and Technology (millons of dollars) Amount Spent on Pets (billions of dollars) Year 2000 18,594 39.7 2001 19,753 41.9 2002 20,734 44.6 2003 20,831 48.8 2004 23,029 49.8 2005 23,597 53.1 2006 23,584 56.9 2007 25,525 61.8 2008 27,731 65.7 2009 29,449 67.1
> The paper “can Pizza Fit in to the renal Diet? a review of the Phosphorus, Potassium and Sodium content of Selected Frozen and Delivery options” (Journal of Renal Nutrition [2015]: e15–e18) gave infor
> The accompanying data are x = Cost (cents per serving) and y = Fiber content (grams per serving) for 18 high-fiber cereals rated by Consumer Reports (www.consumerreports.org /health). a. Construct a scatterplot of y 5 Fiber content versus Cost. Based o
> The authors of the paper “Flat-Footedness is not a Disadvantage for athletic Performance in Children aged 11 to 15 Years” (Pediatrics [2009]: e386–e392) studied the relationship between y = Arch heigh
> For each of the following pairs of variables, indicate whether you would expect a positive correlation, a negative correlation, or a correlation close to 0. Explain your choice. a. Price and weight of an apple b. A person’s height and the number of pet
> For each of the four scatterplots shown, answer the following questions: i. Does there appear to be a relationship between x and y? ii. If so, does the relationship appear to be linear? iii. If so, would you describe the linear relationship as positiv
> The following quote is from the paper “the weight of the bottle as a Possible extrinsic Cue with which to estimate the Price (and Quality) of the wine? observed Correlations” (Food Quality and Preference [2012]: 41–45): The weight of the wine bottles was
> The paper “Depression, body Mass index, and Chronic obstructive Pulmonary Disease—a holistic approach” (International Journal of COPD [2016]:239– 249) gave data on change in Body Mas
> The California state Park system statistical report for the 2014/2015 Fiscal Year (www.parks.ca.gov/pages/795/files/14-15%20statistical%20report%20-%20internet .pdf, retrieved April 22, 2017) gave the accompanying data on x 5 Amount of money collected in
> The paper “effects of age and gender on Physical Performance” (Age [2007]: 77–85) describes a study investigating the relationship between age and swimming performance. Data on age and 1-hour swim dis
> The article “examined life: what stanley h. Kaplan taught Us about the sat” (The New Yorker [December 17, 2001]: 86–92) included a summary of findings regarding the use of SAT I scores, SAT II scores, and high school grade point average (GPA) to predict
> The first Batman movie was made over 50 years ago in 1966. Over the years, Batman has been played on screen by a number of actors and even by a Lego figure in the Lego Batman movies. In the original comic books, Batman was described as being 188 cm tall
> The report titled “State of the news Media 2013” (Pew research center, May 7, 2013) included the weekday circulation numbers for the top 20 newspapers in the country. Here are the data for the 6 months ending September
> The article “Master’s Performance in the New York City Marathon” (British Journal of Sports Medicine [2004]: 408–412) gave the following data on the average finishing time (in minute
> The report “airline Quality rating 2016” (airlinequalityrating.com/reports/2016_aQr_Final.pdf, retrieved April 22, 2017) included the data for 13 U.S. airlines given in the table below. a. With x = Airline quality r
> Briefly explain why it is important to consider the value of se in addition to the value of r2 when evaluating the usefulness of the least squares regression line.
> Briefly explain why a large value of r2 is desirable in a regression setting.
> Some types of algae have the potential to cause damage to river ecosystems. The accompanying data on y = Algae colony density and x = Rock surface area for nine rivers are a subset of data that appeared in a scatterplot in a paper in the journal Aquatic
> Researchers have observed that bears hunting salmon in a creek often carry the salmon away from the creek before eating it. The relationship between x 5 Total number of salmon in a creek and y 5 Percentage of salmon killed by bears that were transported
> Acrylamide is a chemical that is sometimes found in cooked starchy foods and which is thought to increase the risk of certain kinds of cancer. The paper “a statistical regression Model for the estimation of acrylamide Concentrations in
> The paper referenced in the previous exercise also gave the 6-minute walk distances for 248 girls ages 3 to 18 years. The median distances for the five age groups were 492.4 578.3 655.8 657.6 660.9 a. With x = Representative age and y = Median
> The data in the accompanying table are from the paper “six-Minute walk test in Children and adolescents” (The Journal of Pediatrics [2007]: 395–399). Two hundred and eighty boys completed a test that
> Briefly explain why it is important to consider the value of r2 in addition to the value of se when evaluating the usefulness of the least squares regression line.
> For the data of Exercise 3.22, multiply each data value by 10, then calculate the standard deviation. How does this value compare to s for the original data? More generally, what happens to s if each observation is multiplied by the same positive constan
> The Solid Waste Management section of the Environmental Protection Agency Report on the Environment (www.epa .gov/roe/, retrieved April 17, 2017) included a graph similar to the accompanying graph. The report also included the following statement: The l
> Briefly explain why a small value of se is desirable in a regression setting.
> The accompanying data are a subset of data from the report “great jobs, great lives” (gallup-Purdue index 2015 report, www.gallup.com/reports/197144/gallup-purdue -index-report-2015.aspx , retrieved april 22, 2017). Th
> The data below on runoff sediment concentration for plots with varying amounts of grazing damage are representative values from a graph in the paper “effect of Cattle treading on erosion from hill Pasture: Modeling Concepts and analysis
> An article on the cost of housing in California (San Luis Obispo Tribune, March 30, 2001) included the following statement: “In Northern California, people from the San Francisco Bay area pushed into the Central Valley, benefiting from home prices that d
> In a study of the relationship between TV viewing and eating habits, a sample of 548 ethnically diverse students from Massachusetts was followed over a 19-month period (Pediatrics [2003]: 1321–1326). For each additional hour of television viewed per day,
> Use the data given in Exercise 4.33 to construct two scatterplots—one of number of cell phone calls versus age and the other of number of text messages sent versus age. Based on the scatterplots, do you think age is a better predictor o
> Use the data given in the previous exercise to find the equation of the least squares regression line for predicting y = Number of text messages sent using x = Age as a predictor
> The following table gives data on age, number of cell phone calls made in a typical day, and number of text messages sent in a typical day for a random sample of 10 people selected from those enrolled in adult education classes offered by a school distri
> The report “airline Quality rating 2016” (www .airlinequalityrating.com/reports/2016_aQr_Final.pdf, retrieved april 22, 2017) included the accompanying data on the on-time arrival percentage and the number of complaint
> The California state Park system statistical report for the 2014/2015 Fiscal Year (www.parks.ca.gov/pages/795 /files/14-15%20statistical%20report%20-%20internet .pdf, retrieved april 22, 2017) gave the accompanying data on x = Amount of money collected i
> For the data in Exercise 3.22, subtract 10 from each sample observation. For the new set of values, calculate the mean and all the deviations from the mean. How do these deviations compare to the deviations from the mean for the original sample? How will
> The authors of the paper “evaluating existing Movement hypotheses in linear systems Using larval stream salamanders” (Canadian Journal of Zoology [2009]: 292–298) investigated whether water temperatur
> The accompanying data are a subset of data from the report “great jobs, great lives” (gallup-Purdue index 2015 report, www.gallup.com/reports/197144/gallup-purdue -index-report-2015.aspx, retrieved april 22, 2017). The
> What does it mean when we say that the regression line is the least squares regression line?
> Two scatterplots follow. Explain why it makes sense to use the least squares regression line to summarize the relationship between x and y for one of these data sets but not the other. Scatterplot 1 Scatterplot 2 110 100 90 + 80 y 70 60 50 + 40 + 3
> The authors of the paper “statistical Methods for assessing agreement between two Methods of Clinical Measurement” (International Journal of Nursing Studies [2010]: 931–936) compared two different ins
> Acrylamide is a chemical that is sometimes found in cooked starchy foods and which is thought to increase the risk of certain kinds of cancer. The paper “a statistical regression Model for the estimation of acrylamide Concentrations in
> Medical researchers have noted that adolescent females are much more likely to deliver lowbirth-weight babies than are adult females. Because low-birth-weight babies have a higher mortality rate, a number of studies have examined the relationship between
> Data on x = Size of a house (in square feet) and y = Amount of natural gas used (therms) during a specified period were used to fit the least squares regression line. The slope was 0.017 and the intercept was -5.0. Houses in this data set ranged in size
> Data on y = Time to complete a task (in minutes) and x = Number of hours of sleep on the previous night were used to find the least squares regression line. The equation of the line was ˆ y = 12 - 0.36x. For this data set, would the sum of squa
> Two scatterplots are shown below. Explain why it makes sense to use the least squares regression line to summarize the relationship between x and y for one of these data sets but not the other. Scatterplot 1 Scatterplot 2 110 100 90 80 y 70 60 + 5
> Although bats are not known for their eyesight, they are able to locate prey (mainly insects) by emitting high-pitched sounds and listening for echoes. A paper appearing in Animal Behaviour (“the echolocation of Flying insects by bats” [1960]: 141–154) g
> It may seem odd, but biologists can tell how old a lobster is by measuring the concentration of pigment in the lobster’s eye. The authors of the paper “neurolipofuscin is a Measure of age in Panulirus argus, the Caribb
> A sample of automobiles traveling on a particular segment of a highway is selected. Each one travels at roughly a constant rate of speed, although speed does vary from auto to auto. Let x = Speed and y = Time needed to travel this segment. Would the samp
> An auction house released a list of 25 recently sold paintings. The artist’s name and the sale price of each painting appear on the list. Would the correlation coefficient be an appropriate way to summarize the relationship between artist and sale price?
> The amount of money spent each year on science, space, and technology in the United States (in millions of dollars) and the amount of money spent on pets in the United States (in billions of dollars) for the years 2000 to 2009 were used to construct the
> Each year the Harris Poll surveys Americans on a number of issues. It uses responses to several questions to calculate a “Happiness” index that measures overall happiness. The article “latest happines
> The paper “religiosity and teen birth rate in the United states” (Reproductive Health [2009]: 14–20) included data on teen birth rate and on a measure of conservative religious beliefs for each of 49
> Data from the U.s. Federal reserve board (www .federalreserve.gov/releases/housedebt/, retrieved april 21, 2017) on consumer debt (as a percentage of personal income) and mortgage debt (also as a percentage of personal income) for the 10 years from 2006
> Draw two scatterplots, one for which r = 1 and a second for which r = -1.
> The paper “Digit ratio as an indicator of numeracy relative to literacy in 7-Year-old british schoolchildren” (British Journal of Psychology [2008]: 75–85) investigated a possible relationship between x = Digit ratio (the ratio of the length of the secon
> Acrylamide, a possible cancer-causing substance, forms in high-carbohydrate foods cooked at high temperatures. Acrylamide levels can vary widely even within the same type of food. An article appearing in the journal Food Chemistry (March 2014, 204–211) i
> For each of the following pairs of variables, indicate whether you would expect a positive correlation, a negative correlation, or a correlation close to 0. Explain your choice. a. Weight of a car and gas mileage b. Size and selling price of a house c
> For each of the scatterplots shown, answer the following questions: i. Does there appear to be a relationship between x and y? ii. If so, does the relationship appear to be linear? iii. I f so, would you describe the linear relationship as positive or
> The paper “noncognitive Predictors of student athletes’ academic Performance” (Journal of College Reading and Learning [2000]: e167) summarizes a study of 200 Division I athletes. It was reported that the correlation coefficient for college grade point a
> The article “that’s rich: More You Drink, More You earn” (Calgary Herald, april 16, 2002) reported that there was a positive correlation between alcohol consumption and income. Is it reasonable to conclude that increasing alcohol consumption will increas
> Is the following statement correct? Explain why or why not. A correlation coefficient of 0 implies that there is no relationship between two variables.
> Each year, marketing firm j.D. Power and associates surveys new car owners 90 days after they purchase their cars. These data are used to rate auto brands (Toyota, Ford, etc.) on quality and customer satisfaction. Data for 2015 on a quality rating (numbe
> The article “$115K! the 13 best Paying U.s. Companies” (USA TODAY, august 11, 2015) gave the following data on median worker pay (in thousands of dollars) and the 1-year percent change in stock price for the 13 highest
> The paper “the relationship between Cell Phone Use, academic Performance, anxiety, and satisfaction with life in College students” (Computers in Human Behavior [2014]: 343–350) described a study of cell phone use among undergraduate college students at a
> For each of the following pairs of variables, indicate whether you would expect a positive correlation, a negative correlation, or a correlation close to 0. Explain your choice. a. Interest rate and number of loan applications b. Height and IQ c. Heig
> For each of the scatterplots shown, answer the following questions: i. Does there appear to be a relationship between x and y? ii. If so, does the relationship appear to be linear? iii. If so, would you describe the linear relationship as positive or
> The article “caffeinated energy Drinks—a growing Problem” (Drug and Alcohol Dependence [2009]: 1–10) gave the accompanying data (on the next page) on caffeine concentration (mg/ounce
> To learn about the reason parents believe their child is heavier than the recommended weight for children of the same age, each person in a sample of parents of overweight children was asked what they thought was the most important contributing factor. P
> For the following numerical variables, state whether each is discrete or continuous. a. The number of insufficient-funds checks received by a grocery store during a given month b. The amount by which a 1-pound package of ground beef decreases in weight
> Classify each of the following variables as either categorical or numerical. For those that are numerical, determine whether they are discrete or continuous. a. Number of students in a class of 35 who turn in a term paper before the due date b. G ender
> The article “rethinking calcium Supplements” (U.S. Airways Magazine, October 2010) describes a study investigating whether taking calcium supplements increases the risk of heart attack. Two hundred people were randomly selected from a list of all people
> The article “rethinking calcium Supplements” (U.S. Airways Magazine, October 2010) describes a study investigating whether taking calcium supplements increases the risk of heart attack. Two hundred people were randomly selected from a list of all people
> The article “rethinking calcium Supplements” (U.S. Airways Magazine, October 2010) describes a study investigating whether taking calcium supplements increases the risk of heart attack. Every heart attack patient and every patient admitted for an illness
> To examine the effect of exercise on body composition, healthy women aged 35 to 50 were classified as either active (nine or more hours of physical activity per week) or sedentary (“effects of habitual Physical activity on the resting Metabolic rates and
> The authors of the paper “Popular video games: Quantifying the Presentation of violence and its context” (Journal of Broadcasting & Electronic Media [2003]: 58–76) investigated the relationship between video game rating—suitable for everyone (E), suitabl
> The article “Display of health risk behaviors on MySpace by adolescents” (Archives of Pediatrics and Adolescent Medicine [2009]: 27–34) described a study in which researchers looked at a random sample of 500 publicly accessible MySpace web profiles poste
> Morningstar is an investment research firm that publishes some online educational materials. The materials for an online course called “looking at historical risk” (news.morningstar.com/classroom2/course .asp?docid =2927&page=2&cn=com, retrieved august 3
> Can moving their hands help children learn math? This is the question investigated by the authors of the paper “gesturing gives children new ideas about Math” (Psychological Science [2009]: 267–272). An experiment was conducted to compare two different m
> According to the article “rubbing hands together Under warm air Dryers can counteract bacteria reduction” (Infectious Disease News, September 22, 2010), washing your hands isn’t enough—good “hand hygiene” also includes drying hands thoroughly. The articl
> The article “Super bowls: Serving bowl Size and Food consumption” (Journal of the American Medical Association [2005]: 1727–1728) describes an experiment investigating how the size of serving bowls influences the amount a person eats. In this experiment,
> The article “Yes that Miley cyrus biography helps learning” (The Globe and Mail, august 5, 2010) describes an experiment investigating whether providing summer reading books to low-income children would affect school performance. Subjects in the experime
> In many digital environments, users are allowed to choose how they are represented visually online. Does the way in which people are represented online affect online behavior? This question was examined by the authors of the paper “the Proteus effect: th
> A petition with 500 signatures is submitted to a college’s student council. The council president would like to determine what proportion of those who signed the petition are actually registered students at the college. There is not enough time to check
> According to the article “effect of Preparation Methods on total Fat content, Moisture content, and Sensory characteristics of breaded chicken nuggets and beef Steak Fingers” (Family and Consumer Sciences Research Journal [1999]: 18–27), sensory tests we
> For each of the following statements, identify the number that appears in boldface type as the value of either a population characteristic or a statistic: a. A department store reports that 84% of all customers who use the store’s credit plan pay their
> The student senate at a college with 15,000 students is interested in the proportion of students who favor a change in the grading system to allow for plus and minus grades (for example, B+, B, B-, rather than just B). Two hundred students are interviewe
> The accompanying data are a subset of data read from a graph in the paper “ladies First? a Field Study of Discrimination in coffee Shops” (Applied Economics [april, 2008]). The data are the waiting times (in seconds) b
> For each of the following, determine whether the statistical study described is an observational study or an experiment. Give a brief explanation of your choice. a. Can choosing the right music make wine taste better? This question was investigated by a
> The paper “turning to learn: Screen orientation and reasoning from Small Devices” (Computers in Human Behavior [2011]: 793–797) describes a study that investigated whether cell phones with small scree
> Does living in the South cause high blood pressure? Data from a group of 6278 people questioned in the Third National Health and Nutritional Examination Survey between 1988 and 1994 indicate that a greater percentage of Southerners have high blood pressu
> An article titled “guard Your Kids against allergies: get them a Pet” (San Luis Obispo Tribune, august 28, 2002) described a study that led researchers to conclude that “babies raised with two or more animals are about half as likely to have allergies by
> “Strengthen Your Marriage with Prayer” is a headline that appeared in the magazine Woman’s World (November 1, 2010). The article went on to state that couples who attend religious services and pray together have happier, stronger marriages than those who
> “Strengthen Your Marriage with Prayer” is a headline that appeared in the magazine Woman’s World (November 1, 2010). The article went on to state that couples who attend religious services and pray together have happier, stronger marriages than those who
> “Strengthen Your Marriage with Prayer” is a headline that appeared in the magazine Woman’s World (November 1, 2010). The article went on to state that couples who attend religious services and pray together have happier, stronger marriages than those who
> The paper “effect of cell Phone Distraction on Pediatric Pedestrian injury risk” (Pediatrics [2009]: e179–e185) describes an experiment examining whether people talking on a cell phone are at greater risk of an accident when crossing the street than when
> Researchers at the University of Utah carried out a study to see if the size of the fork used to eat dinner has an effect on how much food is consumed (Food Network Magazine, January 2012). The researchers assigned people to one of two groups. One group
> A survey of affluent Americans (those with incomes of $75,000 or more) indicated that 57% would rather have more time than more money (USA TODAY, january 29, 2003). a. What condition on how the data were collected would make it reasonable to generalize t
> Cost per serving (in cents) for 15 high-fiber cereals rated very good or good by Consumer Reports are shown below. Calculate and interpret the mean and standard deviation for this data set. 46 49 62 41 19 77 71 30 53 53 67 43 48 28 54
> One hundred students were selected at random from those enrolled at a large college. Each of the selected students was asked to participate in a study, and all agreed to participate. For each student, a coin was tossed. If the coin landed heads up, the s
> Two hundred people volunteered to participate in a statistical study. For each volunteer, a coin was tossed. If the coin landed heads up, the volunteer was assigned to group 1. If the coin landed tails up, the volunteer was assigned to group 2. Those in

