Question: The report titled “State of the news
The report titled “State of the news Media 2013†(Pew research center, May 7, 2013) included the weekday circulation numbers for the top 20 newspapers in the country. Here are the data for the 6 months ending September 2012:
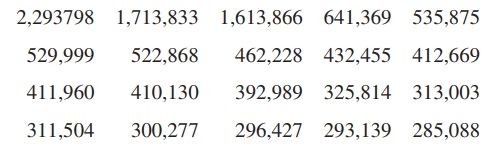
a. Calculate and interpret the value of the median of this data set.
b. Explain why the median is preferable to the mean for describing center for this data set.
c. Explain why it would be unreasonable to generalize from this sample of 20 newspapers to the population of all daily newspapers in the United States.
Transcribed Image Text:
2,293798 1,713,833 1,613,866 641,369 535,875 529,999 522,868 462,228 432,455 412,669 411,960 410,130 392,989 325,814 313,003 311,504 300,277 296,427 293,139 285,088
> The report “Trends in Education 2010: Community Colleges” (www.collegeboard.com/trends) included the accompanying information on student debt for students graduating with an AA degree from a public community college in
> The report referenced in the previous exercise also gave responses to the question “What do you think is the best long-term investment?” by gender. Relative frequencies for the six response categories for men and for w
> The Gallup report “More Americans Say Real Estate Is Best Long-Term Investment” (www.gallup.com, April 20, 2016, retrieved April 15, 2017) included data from a poll of 1015 adults. The responses to the question â
> To learn about TV viewing habits of high school students, each person in a sample of students was asked how many hours he or she spent watching TV during the previous week. Required: 1. How many variables are in the data set? 2. Are the variables in th
> To learn if there is a relationship between water consumption and headache frequency, people in a sample of young adults were asked how much water (in ounces) they drink in a typical day and how many days per month they experience a headache. Required:
> The insurance institute for highway Safety (www.iihs .org, June 11, 2009) published data on repair costs for cars involved in different types of accidents. In one study, seven different 2009 models of mini- and micro-cars were driven at 6 mph straight in
> To compare the number of hours spent studying in a typical week for male and female students, data were collected from each person in a random sample of 50 female students and each person in a random sample of 50 male students. Required: 1. How many var
> To learn about what super power middle school students would most like to have, each person in a sample of middle school students was asked to choose among invisibility, extreme strength, the ability to freeze time, and the ability to fly. Required: 1.
> Classify each of the following variables as either categorical or numerical. a. Number of text messages sent by a college student in a typical day b. Amount of time a high school senior spends playing computer or video games in a typical day c. Number
> For the numerical variables in the previous exercise, which are discrete and which are continuous?
> Classify each of the following variables as either categorical or numerical. a. Color of an M&M candy selected at random from a bag of M&M’s b. N umber of green M&M’s in a bag of M&M’s c. Weight (in grams) of a bag of M&M’s d. G ender of the next per
> For the numerical variables in the previous exercise, which are discrete and which are continuous?
> Classify each of the following variables as either categorical or numerical. a. W eight (in ounces) of a bag of potato chips b. Number of items purchased by a grocery store customer c. Brand of cola purchased by a convenience store customer d. A moun
> To learn about political affiliation (Democrat, Republican, Independent, and Other) of students at a particular college, each student in a random sample of 200 students was asked to indicate his or her political affiliation. Required: 1. How many variab
> To learn how the amount of money spent on a fast-food meal might differ for men and women, the amount spent on lunch at a particular fast-food restaurant was determined for each person in a sample of 50 women and each person in a sample of 50 men. Requi
> To learn how GPA at the end of the freshman year in college is related to high school GPA, both high school GPA and freshman year GPA were determined for each student in a sample of 100 students who had just completed their freshman year at a particular
> Data on tipping percent for 20 restaurant tables, consistent with summary statistics given in the paper “racial and ethnic Differences in tipping: the role of Perceived Descriptive and injunctive tipping norms” (Restau
> To see if there is a difference in car color preferences of men and women, each person in a sample of 100 males and each person in a sample of 100 females was shown pictures of a new model car in five different colors and asked to select which color they
> To learn about the heights of five-year-old children, the height of each child in a sample of 40 five-year-old children was measured. Required: 1. How many variables are in the data set? 2. Are the variables in the data set categorical or numerical? 3
> For the following numerical variables, state whether each is discrete or continuous. a. The length of a 1-year-old rattlesnake b. The altitude of a location in California selected randomly by throwing a dart at a map of the state c. The distance from
> Classify each of the following variables as either categorical or numerical. For those that are numerical, determine whether they are discrete or continuous. a. Brand of computer purchased by a customer b. State of birth for someone born in the United
> To learn about how much money students at a particular college spend on textbooks, each student in a random sample of 200 students was asked how much he or she spent on textbooks for the current semester.
> To see if there is a difference between faculty and students at a particular college with respect to how they commute to campus (drive, walk, bike, and so on), each person in a random sample of 50 faculty members and each person in a random sample of 100
> To learn about how number of years of education and income are related, each person in a random sample of 500 residents of a particular city was asked how many years of education he or she had completed and what his or her annual income was. Required: 1
> To compare commute distances for full-time and part-time students at a large college, commute distance (in miles) was determined for each student in a random sample of 50 full-time students and for each student in a random sample of 50 part-time students
> The accompanying data on x = Average energy density (calories per 100 grams) and y = Average cost (in dollars) for eight different food groups are from the paper “the Cost of U.S. Foods as related to their nutritional valueâ€
> The article “$115K! the 13 best Paying U.s. Companies” (USA TODAY, august 11, 2015) gave the following data on median worker pay (in thousands of dollars) and the 1-year percent change in stock price for the 13 highest
> the accompanying data on total amount of time per day (in minutes) spent using a cell phone are consistent with summary statistics in the paper “the relationship between cell Phone use and academic Performance in a Sample of u.S. colleg
> Can you tell how old a lobster is by its size? This question was investigated by the authors of a paper that appeared in the Biological Bulletin (august 2007). Researchers measured carapace (the exterior shell) length of 27 laboratory-raised lobsters of
> The following table gives the number of heart transplants performed in the United States each year from 2006 to 2015 (U.s. Department of health and human services, optn.transplant.hrsa.gov/data/view-data-reports/national -data/, retrieved april 22, 2017
> Does it pay to stay in school? The report Trends in Higher Education (the College board, 2010) looked at the median hourly wage gain per additional year of schooling. The report states that workers with a high school diploma had a median hourly wage that
> The following data on sale price, size, and land-to-building ratio for 10 large industrial properties appeared in the paper “Using Multiple regression analysis in real estate appraisal” (Appraisal Journal [2002]: 424&a
> Is living in a large high-rise apartment building a disadvantage in a medical emergency? This question was investigated in the paper “impact of building height and volume on Cardiac arrest response time” (Prehospital E
> Explain why it can be misleading to use the least squares regression line to obtain predictions for x values that are substantially larger or smaller than the x values in the data set.
> For a given data set, the sum of squared deviations from the line y = 40 + 6x is 529.5. For this same data set, which of the following could be the sum of squared deviations from the least squares regression line? Explain your choice. i. 308.6 ii. 529
> The relationship between hospital patient-to-nurse ratio and various characteristics of job satisfaction and patient care has been the focus of a number of research studies. Suppose x = Patient-to-nurse ratio is the predictor variable. For each of the fo
> The article “air Pollution and Medical Care Use by older americans” (Health Affairs [2002]: 207– 214) gave data on a measure of pollution (in micrograms of particulate matter per cubic meter of air) a
> Based on data from six countries, the paper “a Crossnational relationship between sugar Consumption and Major Depression?” (Depression and Anxiety [2002]: 118–120) concluded that there was a correlati
> The paper “can Pizza Fit in to the renal Diet? a review of the Phosphorus, Potassium and Sodium content of Selected Frozen and Delivery options” (Journal of Renal Nutrition [2015]: e15–e18) gave infor
> The accompanying data are x = Cost (cents per serving) and y = Fiber content (grams per serving) for 18 high-fiber cereals rated by Consumer Reports (www.consumerreports.org /health). a. Construct a scatterplot of y 5 Fiber content versus Cost. Based o
> The authors of the paper “Flat-Footedness is not a Disadvantage for athletic Performance in Children aged 11 to 15 Years” (Pediatrics [2009]: e386–e392) studied the relationship between y = Arch heigh
> For each of the following pairs of variables, indicate whether you would expect a positive correlation, a negative correlation, or a correlation close to 0. Explain your choice. a. Price and weight of an apple b. A person’s height and the number of pet
> For each of the four scatterplots shown, answer the following questions: i. Does there appear to be a relationship between x and y? ii. If so, does the relationship appear to be linear? iii. If so, would you describe the linear relationship as positiv
> The following quote is from the paper “the weight of the bottle as a Possible extrinsic Cue with which to estimate the Price (and Quality) of the wine? observed Correlations” (Food Quality and Preference [2012]: 41–45): The weight of the wine bottles was
> The paper “Depression, body Mass index, and Chronic obstructive Pulmonary Disease—a holistic approach” (International Journal of COPD [2016]:239– 249) gave data on change in Body Mas
> The California state Park system statistical report for the 2014/2015 Fiscal Year (www.parks.ca.gov/pages/795/files/14-15%20statistical%20report%20-%20internet .pdf, retrieved April 22, 2017) gave the accompanying data on x 5 Amount of money collected in
> The paper “effects of age and gender on Physical Performance” (Age [2007]: 77–85) describes a study investigating the relationship between age and swimming performance. Data on age and 1-hour swim dis
> The article “examined life: what stanley h. Kaplan taught Us about the sat” (The New Yorker [December 17, 2001]: 86–92) included a summary of findings regarding the use of SAT I scores, SAT II scores, and high school grade point average (GPA) to predict
> The first Batman movie was made over 50 years ago in 1966. Over the years, Batman has been played on screen by a number of actors and even by a Lego figure in the Lego Batman movies. In the original comic books, Batman was described as being 188 cm tall
> The article “Master’s Performance in the New York City Marathon” (British Journal of Sports Medicine [2004]: 408–412) gave the following data on the average finishing time (in minute
> The report “airline Quality rating 2016” (airlinequalityrating.com/reports/2016_aQr_Final.pdf, retrieved April 22, 2017) included the data for 13 U.S. airlines given in the table below. a. With x = Airline quality r
> Briefly explain why it is important to consider the value of se in addition to the value of r2 when evaluating the usefulness of the least squares regression line.
> Briefly explain why a large value of r2 is desirable in a regression setting.
> Some types of algae have the potential to cause damage to river ecosystems. The accompanying data on y = Algae colony density and x = Rock surface area for nine rivers are a subset of data that appeared in a scatterplot in a paper in the journal Aquatic
> Researchers have observed that bears hunting salmon in a creek often carry the salmon away from the creek before eating it. The relationship between x 5 Total number of salmon in a creek and y 5 Percentage of salmon killed by bears that were transported
> Acrylamide is a chemical that is sometimes found in cooked starchy foods and which is thought to increase the risk of certain kinds of cancer. The paper “a statistical regression Model for the estimation of acrylamide Concentrations in
> The paper referenced in the previous exercise also gave the 6-minute walk distances for 248 girls ages 3 to 18 years. The median distances for the five age groups were 492.4 578.3 655.8 657.6 660.9 a. With x = Representative age and y = Median
> The data in the accompanying table are from the paper “six-Minute walk test in Children and adolescents” (The Journal of Pediatrics [2007]: 395–399). Two hundred and eighty boys completed a test that
> Briefly explain why it is important to consider the value of r2 in addition to the value of se when evaluating the usefulness of the least squares regression line.
> For the data of Exercise 3.22, multiply each data value by 10, then calculate the standard deviation. How does this value compare to s for the original data? More generally, what happens to s if each observation is multiplied by the same positive constan
> The Solid Waste Management section of the Environmental Protection Agency Report on the Environment (www.epa .gov/roe/, retrieved April 17, 2017) included a graph similar to the accompanying graph. The report also included the following statement: The l
> Briefly explain why a small value of se is desirable in a regression setting.
> The accompanying data are a subset of data from the report “great jobs, great lives” (gallup-Purdue index 2015 report, www.gallup.com/reports/197144/gallup-purdue -index-report-2015.aspx , retrieved april 22, 2017). Th
> The data below on runoff sediment concentration for plots with varying amounts of grazing damage are representative values from a graph in the paper “effect of Cattle treading on erosion from hill Pasture: Modeling Concepts and analysis
> An article on the cost of housing in California (San Luis Obispo Tribune, March 30, 2001) included the following statement: “In Northern California, people from the San Francisco Bay area pushed into the Central Valley, benefiting from home prices that d
> In a study of the relationship between TV viewing and eating habits, a sample of 548 ethnically diverse students from Massachusetts was followed over a 19-month period (Pediatrics [2003]: 1321–1326). For each additional hour of television viewed per day,
> Use the data given in Exercise 4.33 to construct two scatterplots—one of number of cell phone calls versus age and the other of number of text messages sent versus age. Based on the scatterplots, do you think age is a better predictor o
> Use the data given in the previous exercise to find the equation of the least squares regression line for predicting y = Number of text messages sent using x = Age as a predictor
> The following table gives data on age, number of cell phone calls made in a typical day, and number of text messages sent in a typical day for a random sample of 10 people selected from those enrolled in adult education classes offered by a school distri
> The report “airline Quality rating 2016” (www .airlinequalityrating.com/reports/2016_aQr_Final.pdf, retrieved april 22, 2017) included the accompanying data on the on-time arrival percentage and the number of complaint
> The California state Park system statistical report for the 2014/2015 Fiscal Year (www.parks.ca.gov/pages/795 /files/14-15%20statistical%20report%20-%20internet .pdf, retrieved april 22, 2017) gave the accompanying data on x = Amount of money collected i
> For the data in Exercise 3.22, subtract 10 from each sample observation. For the new set of values, calculate the mean and all the deviations from the mean. How do these deviations compare to the deviations from the mean for the original sample? How will
> The authors of the paper “evaluating existing Movement hypotheses in linear systems Using larval stream salamanders” (Canadian Journal of Zoology [2009]: 292–298) investigated whether water temperatur
> The accompanying data are a subset of data from the report “great jobs, great lives” (gallup-Purdue index 2015 report, www.gallup.com/reports/197144/gallup-purdue -index-report-2015.aspx, retrieved april 22, 2017). The
> What does it mean when we say that the regression line is the least squares regression line?
> Two scatterplots follow. Explain why it makes sense to use the least squares regression line to summarize the relationship between x and y for one of these data sets but not the other. Scatterplot 1 Scatterplot 2 110 100 90 + 80 y 70 60 50 + 40 + 3
> The authors of the paper “statistical Methods for assessing agreement between two Methods of Clinical Measurement” (International Journal of Nursing Studies [2010]: 931–936) compared two different ins
> Acrylamide is a chemical that is sometimes found in cooked starchy foods and which is thought to increase the risk of certain kinds of cancer. The paper “a statistical regression Model for the estimation of acrylamide Concentrations in
> Medical researchers have noted that adolescent females are much more likely to deliver lowbirth-weight babies than are adult females. Because low-birth-weight babies have a higher mortality rate, a number of studies have examined the relationship between
> Data on x = Size of a house (in square feet) and y = Amount of natural gas used (therms) during a specified period were used to fit the least squares regression line. The slope was 0.017 and the intercept was -5.0. Houses in this data set ranged in size
> Data on y = Time to complete a task (in minutes) and x = Number of hours of sleep on the previous night were used to find the least squares regression line. The equation of the line was ˆ y = 12 - 0.36x. For this data set, would the sum of squa
> Two scatterplots are shown below. Explain why it makes sense to use the least squares regression line to summarize the relationship between x and y for one of these data sets but not the other. Scatterplot 1 Scatterplot 2 110 100 90 80 y 70 60 + 5
> Although bats are not known for their eyesight, they are able to locate prey (mainly insects) by emitting high-pitched sounds and listening for echoes. A paper appearing in Animal Behaviour (“the echolocation of Flying insects by bats” [1960]: 141–154) g
> It may seem odd, but biologists can tell how old a lobster is by measuring the concentration of pigment in the lobster’s eye. The authors of the paper “neurolipofuscin is a Measure of age in Panulirus argus, the Caribb
> A sample of automobiles traveling on a particular segment of a highway is selected. Each one travels at roughly a constant rate of speed, although speed does vary from auto to auto. Let x = Speed and y = Time needed to travel this segment. Would the samp
> An auction house released a list of 25 recently sold paintings. The artist’s name and the sale price of each painting appear on the list. Would the correlation coefficient be an appropriate way to summarize the relationship between artist and sale price?
> Below are the data used to construct the time series plots in the previous exercise. Calculate the value of the correlation coefficient for the amount spent on science, space, and technology and the amount spent on pets. Explain how this value is consist
> The amount of money spent each year on science, space, and technology in the United States (in millions of dollars) and the amount of money spent on pets in the United States (in billions of dollars) for the years 2000 to 2009 were used to construct the
> Each year the Harris Poll surveys Americans on a number of issues. It uses responses to several questions to calculate a “Happiness” index that measures overall happiness. The article “latest happines
> The paper “religiosity and teen birth rate in the United states” (Reproductive Health [2009]: 14–20) included data on teen birth rate and on a measure of conservative religious beliefs for each of 49
> Data from the U.s. Federal reserve board (www .federalreserve.gov/releases/housedebt/, retrieved april 21, 2017) on consumer debt (as a percentage of personal income) and mortgage debt (also as a percentage of personal income) for the 10 years from 2006
> Draw two scatterplots, one for which r = 1 and a second for which r = -1.
> The paper “Digit ratio as an indicator of numeracy relative to literacy in 7-Year-old british schoolchildren” (British Journal of Psychology [2008]: 75–85) investigated a possible relationship between x = Digit ratio (the ratio of the length of the secon
> Acrylamide, a possible cancer-causing substance, forms in high-carbohydrate foods cooked at high temperatures. Acrylamide levels can vary widely even within the same type of food. An article appearing in the journal Food Chemistry (March 2014, 204–211) i
> For each of the following pairs of variables, indicate whether you would expect a positive correlation, a negative correlation, or a correlation close to 0. Explain your choice. a. Weight of a car and gas mileage b. Size and selling price of a house c
> For each of the scatterplots shown, answer the following questions: i. Does there appear to be a relationship between x and y? ii. If so, does the relationship appear to be linear? iii. I f so, would you describe the linear relationship as positive or
> The paper “noncognitive Predictors of student athletes’ academic Performance” (Journal of College Reading and Learning [2000]: e167) summarizes a study of 200 Division I athletes. It was reported that the correlation coefficient for college grade point a
> The article “that’s rich: More You Drink, More You earn” (Calgary Herald, april 16, 2002) reported that there was a positive correlation between alcohol consumption and income. Is it reasonable to conclude that increasing alcohol consumption will increas
> Is the following statement correct? Explain why or why not. A correlation coefficient of 0 implies that there is no relationship between two variables.
> Each year, marketing firm j.D. Power and associates surveys new car owners 90 days after they purchase their cars. These data are used to rate auto brands (Toyota, Ford, etc.) on quality and customer satisfaction. Data for 2015 on a quality rating (numbe

