Question: Examine the three control charts shown. Discuss
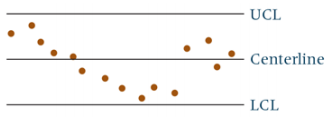
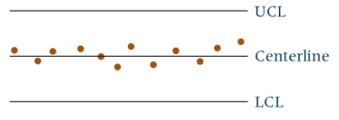
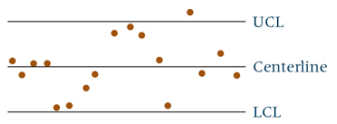
Examine the three control charts shown. Discuss any and all control problems that may be apparent from these control charts.
a)
b)
c)
> A home buyer is completing an application for a home mortgage. The buyer is given the option of “locking in” a mortgage loan interest rate or waiting 60 days until closing and locking in a rate on the day of closing. The buyer is not given the option of
> Use the following decision table to complete parts a through c. a) Draw a decision tree to represent this payoff table. b) Compute the expected monetary values for each decision and label the decision tree to indicate what the final decision would be. c
> How much is the expected monetary payoff with perfect information in Problem 19.5? From this answer and the decision reached in Problem 19.6, what is the value of perfect information? Refer to the Problem 19.5:
> Suppose the probabilities of the states of nature occurring for Problem 19.5 are s1 = .15, s2 = .25, s3 = .30, s4 = .10, and s5 = .20. Use these probabilities and expected monetary values to reach a conclusion about the decision alternatives in Problem 1
> Compute r2 for Problem 12.24 (Problem 12.6). Discuss the value of r2 obtained.
> Use the following decision table to construct a decision tree.
> The introduction of a new product into the marketplace is quite risky. The percentage of new product ideas that successfully make it into the marketplace is as low as 1%. Research and development costs must be recouped, along with marketing and productio
> Election results can affect the payoff from certain types of investments. Suppose a brokerage firm is faced with the prospect of investing $20 million a few weeks before the national election for president of the United States. They feel that if a Republ
> A city is considering airport expansion. In particular, the mayor and city council are trying to decide whether to sell bonds to construct a new terminal. The problem is that at present demand for gates is not strong enough to warrant construction of a n
> A small retailer began as a mom-and-pop operation selling crafts and consignment items. During the past two years, the store’s volume grew significantly. The owners are trying to decide whether to purchase an automated checkout system.
> A U.S. manufacturing company decided to consider producing a particular model of one of its products just for sale in Germany. Because of the German requirements, the product must be made specifically for German consumption and cannot be sold in the Unit
> An entertainment company owns two amusement parks in the South. They are faced with the decision of whether to open the parks in the winter. If they choose to open the parks in the winter, they can leave the parks open during regular hours (as in the sum
> Some companies use production learning curves to set pricing strategies. They price their product lower than the initial cost of making the product; after some period of time, the learning curve takes effect and the product can be produced for less than
> Use the decision table given here to complete parts a through d a) Use the maximax criterion to determine which decision alternative to select. b) Use the maximin criterion to determine which decision alternative to select. c) Use the Hurwicz criterion
> Managers of a manufacturing firm decided to add Christmas tree ornaments to their list of production items. However, they have not decided how many to produce because they are uncertain about the level of demand. Shown here is a decision table that has b
> Determine the equation of the regression line to predict annual sales of a company from the yearly stock market volume of shares sold in a recent year. Compute the standard error of the estimate for this model. Does volume of shares sold appear to be a g
> Shown here is a decision table. A forecast can be purchased by the decision maker. The forecaster is not correct 100% of the time. Also given is a table containing the probabilities of the forecast being correct under different states of nature. Use the
> Use the following decision table to complete parts a through c. a) Draw a decision tree to represent this decision table. b) Compute the expected monetary values for each decision and label the decision tree to indicate what the final decision would be.
> Use the following decision table to complete parts a through d. a) Use the maximax criterion to determine which decision alternative to select. b) Use the maximin criterion to determine which decision alternative to select. c) Use the Hurwicz criterion
> Some oil speculators are interested in drilling an oil well. The rights to the land have been secured and they must decide whether to drill. The states of nature are that oil is present or that no oil is present. Their two decision alternatives are drill
> A small group of investors is considering planting a tree farm. Their choices are (1) don’t plant trees, (2) plant a small number of trees, or (3) plant a large number of trees. The investors are concerned about the demand for trees. If
> A car rental agency faces the decision of buying a fleet of cars, all of which will be the same size. It can purchase a fleet of small cars, medium cars, or large cars. The smallest cars are the most fuel efficient and the largest cars use the most fuel.
> Shown here is a decision table from a business situation. The decision maker has an opportunity to purchase sample information in the form of a forecast. With the sample information, the prior probabilities can be revised. Also shown are the probabilitie
> A person has a chance to invest $50,000 in a business venture. If the venture works, the investor will reap $200,000 including the investment. If the venture fails, the investor will lose his money. It appears that there is about a .50 probability of the
> A CEO faces a tough human resources decision. Because the company is currently operating in a budgetary crisis, the CEO will either lay off 1000 people, lay off 5000 people, or lay off no one. One of the problems for the CEO is that she cannot foretell w
> Use the decision table given here to complete parts a through d. a) Use the maximax criterion to determine which decision alternative to select. b) Use the maximin criterion to determine which decision alternative to select. c) Use the Hurwicz criterion
> Determine the SSE and the se for Problem 12.20. Comment on the size of se for this regression model, which is used to predict the cost of milk.
> In an effort to determine whether any correlation exists between the price of stocks of airlines, an analyst sampled six days of activity of the stock market spread out over four months. Using the following prices of Delta stock and Southwest stock, comp
> A soft drink bottling company just ran a long line of 12-ounce soft drink cans filled with cola. A sample of 32 cans is selected by inspectors looking for nonconforming items. Among the things the inspectors look for are paint defects on the can, imprope
> A firm in the upper Midwest manufactures light bulbs. Before the bulbs are released for shipment, a sample of bulbs is selected for inspection. Inspectors look for non-conformances such as scratches, weak or broken filaments, incorrectly bored turns, ins
> A large manufacturer makes valves. Currently it is producing a particular valve for use in industrial engines. As a part of a quality-control effort, the company engineers randomly sample seven groups of 40 valves and inspect them to determine whether th
> A machine operator at a pencil-manufacturing facility gathered 10 different random samples of 100 pencils. The operator’s inspection was to determine whether the pencils were in compliance or out of compliance with specifications. The r
> Study the Minitab c chart for non-conformances for a part produced in a manufacturing process. Comment on the results.
> Study the Minitab ( chart for a manufactured item. The chart represents the results of testing 30 items at a time for compliance. Sixty different samples were taken for this chart. Discuss the results and the implications for the production process.
> Study the Minitab R chart for the product and data used in Problem 18.24. Comment on the state of the production process for this item.
> Study the Minitab chart on the fill of a product that is supposed to contain 12 ounces. Does the process appear to be out of control? Why or why not?
> Use the data from Problem 12.19 and determine the se. Refer to the Problem Data 12.19:
> A glass manufacturer produces hand mirrors. Each mirror is supposed to meet company standards for such things as glass thickness, ability to reflect, size of handle, quality of glass, color of handle, and so on. To control for these features, the company
> A bathtub manufacturer closely inspects several tubs on every shift for non-conformances such as leaks, lack of symmetry, unstable base, drain malfunctions, and so on. The following list gives the number of non-conformances per tub for 40 tubs. Use these
> A plastics company makes thousands of plastic bottles for another company that manufactures saline solution for users of soft contact lenses. The plastics company randomly inspects a sample of its bottles as part of its quality control program. Inspector
> A company produces outdoor home thermometers. For a variety of reasons, a thermometer can be tested and found to be out of compliance with company specifications. The company takes samples of thermometers on a regular basis and tests each one to determin
> An airline company uses a central telephone bank and a semi-automated telephone process to take reservations. It has been receiving an unusually high number of customer complaints about its reservation system. The company conducted a survey of customers,
> A metal-manufacturing company produces sheet metal. Statistical quality control technicians randomly select sheets to be inspected for blemishes and size problems. The number of non-conformances per sheet is tallied. Shown here are the results of testing
> A bottled-water company has been randomly inspecting bottles of water to determine whether they are acceptable for delivery and sale. The inspectors are looking at water quality, bottle condition, and seal tightness. A series of 10 random samples of 50 b
> In Problem 12.10, you were asked to develop the equation of a regression model to predict the number of business bankruptcies by the number of firm births. For this regression model, solve for the standard error of the estimate and comment on it.
> A brainstorm session on possible causes of a problem resulted in five possible causes: A, B, C, D, and E. Cause A has three possible subcauses, cause B has four, cause C has two, cause D has five, and cause E has three. Construct a fishbone diagram for t
> An examination of rejects shows at least 10 problems. A frequency tally of the problems follows. Construct a Pareto chart for these data. Problem ____________ Frequency 1 ……………………………………………. 673 2 …………………………………………….. 29 3 …………………………………………… 108 4 ………………………
> Create a flowchart from the following sequence of activities: Begin. Flow to activity A. Flow to decision B. If Yes, flow to activity C. If No, flow to activity D. From C flow to activity E and to activity F. From F, flow to decision G. If Yes, flow to d
> Study each of the following Minitab control charts and determine whether any of them indicate problems in the processes. Comment on each chart. a) b) c)
> Results of a survey by the National Center for Health Statistics indicated that people between 65 and 74 years of age contact a physician an average of 9.8 times per year. People 75 and older contact doctors an average of 12.9 times per year. Suppose you
> The data shown represent two random samples gathered from two populations. Is there sufficient evidence in the data to determine whether the values of population 1 are significantly larger than the values of population 2? Use the Mann-Whitney U test and
> Use the Mann-Whitney U test and the following data to determine whether there is a significant difference between the values of group 1 and group 2. Let ( = .05. Group 1 __________ Group 2 15 …………………………….. 23 17 …………………………….. 14 26 ……..…………………….. 24 11
> Study the following Minitab output. What type of statistical test was done? What were the hypotheses, and what was the outcome? Discuss. Kruskal-Wallis Test on Observations
> Study the following Minitab output. What statistical test was being computed by Minitab? What are the results of this analysis? Mann-Whitney Test and CI
> Determine the SSE and se for Problem 12.9. Examine the variables being analyzed by regression in this problem and comment on the value of se.
> Examine the following Minitab output. Discuss the statistical test, its intent, and its outcome. Runs Test Runs above and below K = 1.4200 The observed number of runs = 28 The expected number of runs = 25.3600 21 Observations above K, 29 below P-value =
> Study the following Minitab output. What statistical test was run? What type of design was it? What was the result of the test? Friedman Test: Observations Versus Treatment Blocked by Block
> The scores given are husband-wife scores on a marketing measure. Use the Wilcoxon matched-pairs signed rank test to determine whether the wives’ scores are significantly higher on the marketing measure than the husbands’. Assume that ( = .10. Husbands __
> A survey conducted by the Ethics Resource Center discovered that 35% of all workers say that coworkers have committed some kind of office theft. Suppose a survey is conducted in your large company to ask the same question of 13 randomly selected employee
> Workers in three different but comparable companies were asked to rate the use of quality-control techniques in their firms on a 50-point scale. A score of 50 represents nearly perfect implementation of quality-control techniques and 0 represents no impl
> Is there a strong correlation between the number of miles driven by a salesperson and sales volume achieved? Data were gathered from nine salespeople who worked territories of similar size and potential. Determine the correlation coefficient for these da
> A particular metal part can be produced at different temperatures. All other variables being equal, a company would like to determine whether the strength of the metal part is significantly different for different temperatures. Given are the strengths of
> Many fast-food restaurants have soft drink dispensers with preset amounts, so that when the operator merely pushes a button for the desired drink the cup is automatically filled. This method apparently saves time and seems to increase worker productivity
> Should male managers wear a tie during the workday to command respect and demonstrate professionalism? Suppose a measurement scale has been developed that generates a management professionalism score. A random sample of managers in a high-tech industry i
> Does a statistics course improve a student’s mathematics skills, as measured by a national test? Suppose a random sample of 13 students takes the same national mathematics examination just prior to enrolling in a statistics course and j
> Determine the SSE and the se for Problem 12.8. Think about the variables being analyzed by regression in this problem and comment on the value of se.
> A Gallup/Air Transport Association survey showed that in a recent year, 52% of all air trips were for pleasure/personal and 48% were for business. Suppose the organization randomly samples 30 air travelers and asks them to state the purpose of their trip
> Some people drink coffee to relieve stress on the job. Is there a correlation between the number of cups of coffee consumed on the job and perceived job stress? Suppose the data shown represent the number of cups of coffee consumed per week and a stress
> Does deodorant sell better in a box or without additional packaging? An experiment in a large store is designed in which, for one month, all deodorants are sold packaged in a box and, during a second month, all deodorants are removed from the box and sol
> Does impulse buying really increase sales? A market researcher is curious to find out whether the location of packages of chewing gum in a grocery store really has anything to do with volume of gum sales. As a test, gum is moved to a different location i
> A Virginia Slims Opinion Poll by Roper Starch found that more than 70% of the women interviewed believe they have had more opportunity to succeed than their parents. Suppose a business analyst in your state conducts a similar poll and asks the same quest
> Suppose you want to take a random sample of GMAT test scores to determine whether there is any significant difference between the GMAT scores for the test given in March and the scores for the test given in June. You gather the following data from a samp
> Automobile dealers usually advertise in the yellow pages of the telephone book. Sometimes they have to pay to be listed in the white pages, and some dealerships opt to save money by omitting that listing, assuming most people will use the yellow pages to
> In some firefighting organizations, you must serve as a firefighter for some period of time before you can become part of the emergency medical service (EMS) arm of the organization. Does that mean EMS workers are older, on average, than traditional fire
> Three machines produce the same part. Ten different machine operators work these machines. A quality team wants to determine whether the machines are producing parts that are significantly different from each other in weight. The team devises an experime
> Manchester Partners International claims that 60% of the banking executives who lose their job stay in banking, whereas 40% leave banking. Suppose 40 people who have lost their job as a banking executive are contacted and are asked whether they are still
> Determine the SSE and the se for Problem 12.7. Use the residuals computed in Problem 12.15 (for Problem 12.7) and determine how many of them are within ±1se and ±2se. How do these numbers compare with what the empirical rule says should occur if the erro
> Commercial fish raising is a growing industry in the United States. What makes fish raised commercially grow faster and larger? Suppose that a fish industry study is conducted over the three summer months in an effort to determine whether the amount of w
> Compute a Spearman’s rank correlation to determine the degree of association between the two variables. Variable 1 ________ Variable 2 101 ……………………………… 87 129 ……………………………… 89 133 ……………………………… 84 147 ……………………………… 79 156 ……………………………… 70 179 ……………………………… 64
> Use the Friedman test to determine whether the treatment groups come from different populations. Let alpha be .05.
> Use the Kruskal-Wallis test and ( = .01 to determine whether the four groups come from different populations.
> Use the Wilcoxon matched-pairs signed rank test to determine whether there is a significant difference between the related populations represented by the matched pairs given here. Assume ( = .05. Group 1 ______________ Group 2 5.6 ………………………………………. 6.4 1.
> A Watson Wyatt Worldwide survey showed that 58% of all Hispanic Americans are satisfied with their salary. Suppose a business analyst randomly samples 27 Hispanic American workers and asks whether they are satisfied with their salary with the result that
> Use the Mann-Whitney U test and ( = .01 to determine whether there is a significant difference between the populations represented by the two samples given here. Sample 1 ________ Sample 2 573 …………………………… 547 532 …………………………… 566 544 …………………………… 551 565
> Use the runs test to determine whether the sample is random. Let alpha be .05.
> Is there a correlation between the number of companies listed on the New York Stock Exchange in a given year and the number of equity issues on the American Stock Exchange? Shown here are the values for these two variables over an 11-year period. Compute
> Shown here are the net tonnage figures for total pig iron and raw steel output in the United States as reported by the American Iron and Steel Institute over a 12-year period. Use these data to calculate a Spearman’s rank correlation to
> Determine the sum of squares of error (SSE) and the standard error of the estimate (se) for Problem 12.6. Determine how many of the residuals computed in Problem 12.14 (for Problem 12.6) are within one standard error of the estimate. If the error terms a
> Shown here are the percentages of consumer loans with payments that are 30 days or more overdue for both bank credit cards and home equity loans over a 14-year period, according to the American Bankers Association. Compute a Spearman’s
> Over a period of a few months, is there a strong correlation between the value of the U.S. dollar and the prime interest rate? The following data represent a sample of these quantities over a period of time. Compute a Spearman’s rank co
> Compute a Spearman’s rank correlation for the following data.
> The following data are the ranks for values of the two variables, x and y. Compute a Spearman’s rank correlation to determine the degree of relation between the two variables.
> Compute a Spearman’s rank correlation for the following variables to determine the degree of association between the two variables. x ______________ y 23 …………………….. 201 41 …………………….. 259 37 …………………….. 234 29 …………………….. 240 25 …………………….. 231 17 ……………………..
> Shown here is Minitab output for a Friedman test. Discuss the experimental design and the outcome of the experiment. Friedman Test: Observations Versus Treatment Blocked by Block
> A process produced good parts and defective parts. A sample of 60 parts was taken and inspected. Eight defective parts were found. The sequence of good and defective parts was analyzed by using Minitab. The output is given here. With a two-tailed test an
> Shown here is Minitab output from a Friedman test. What is the size of the experimental design in terms of treatment levels and blocks? Discuss the outcome of the experiment in terms of any statistical conclusions. Friedman Test: Observations Versus Trea
> Does the configuration of the workweek have any impact on productivity? This question is raised by a business analyst who wants to compare the traditional 5-day workweek with a 4-day workweek and a workweek with three 12-hour days and one 4-hour day. The
> An experiment is undertaken to study the effects of four different medical treatments on the recovery time for a medical disorder. Six physicians are involved in the study. One patient with the disorder is sampled for each physician under each treatment,
> Study the following Minitab Residuals Versus Fits graphic for a simple regression analysis. Comment on the residual evidence of lack of compliance with the regression assumptions.
> Use the Friedman test and ( = .05 to test the following data to determine whether there is a significant difference between treatment levels.

