Question: Professor Anthony Atkinson, (University of
Professor Anthony Atkinson, (University of Waterloo) and adapted by
Professor John Shank (The Amos Tuck School of Business Administration Dartmouth College)
This case is reprinted from Cases in Cost Management, Shank, J. K., 1996, South Western Publishing Company. The case was adapted by Professor John Shank, with permission from the author from an earlier case written by Professor Anthony Atkinson under a grant from the Society of Management Accountants of Canada. The case was originally set in the mid-1980s.
In September of 2017 Michael Smith, Division Manager of Brunswick Plastics, faced an important pricing decision on a major new bid opportunity. Michael knew that pricing too high meant losing a bid that would employ currently unused capacity. On the other hand, pricing too low meant losses on the job. In the first two months after Michael arrived in November of 2015, the presses were running only about 40 per cent of available machine hours. The division had recently lost two large contracts and was struggling to find a solid market position. Michael had instituted a policy of ‘contribution margin pricing’ to restore profitability. He reasoned that the fixed costs were already in place and there was heavy excess capacity. Any orders that generated positive contribution would enhance bottom line profits. In two years, machine running time was up to almost 50 per cent of available machine hours and the number of different products manufactured was up from 30 to 50.
THE COMPANY
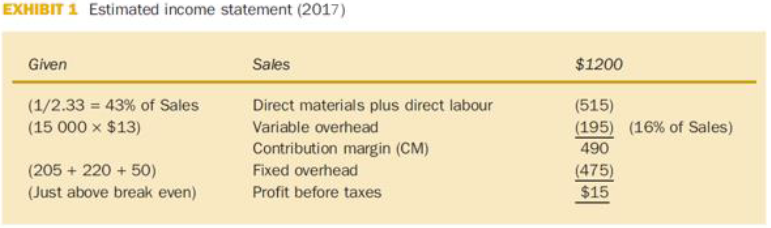
In addition to the 50 different products BP was selling, it was also typically experimenting in the factory with a few others at any given time. New product introductions seemed to Michael to be a key step in filling up the factory. Smith’s best estimate of sales for 2017 was $1 200 000 and he thought BP would again be just above the breakeven level on profits. An estimated income statement for 2017 is shown in Exhibit 1. The division had 20 full-time employees. Since the factory was not unionised, the factory employment fluctuated monthly, based on demand. Factory employment had ranged between 13 and 31 people in the past 2 ½ years. Through strict attention to quality control, and by aggressively promoting its products, BP products were specified by major customers and had become the industry standard for quality.
BP sold its products in both domestic and US markets and faced a highly competitive environment. There were many injection moulding companies in eastern Canada and the northeastern part of the USA. As a result, pricing was a key to success, both from the point of view of securing contracts, and from the point of view of profitability.
Manufacturing at EP was done in two different modes. Some of the high-volume products were manufactured to stock in long runs to minimize set-up costs and to maintain required inventory levels. However, for most products, production was in response to a specific order.
THE COSTING ENVIRONMENT
There were five major injection moulding presses in use at BP. The machines were of varying ages and all experienced frequent down-time because of set-ups, raw material problems, regular repairs, and special repairs related to complex products or new product problems. The factory typically operated 2 shifts a day, 5 days a week, but volume fluctuations also led sometimes to one shift or three shift operations.
There were four common stages involved in manufacturing a product: (1) set up of the production
machine, (2) the production operation, (3) the assembly operation, and (4) the testing operation. The setup, assembly, and the testing operations were labour-intensive. The labour content of the production operation varied widely from product to product.
In injection moulding, molten plastic is forced into a mould where it is ‘cured’. The curing process requires cooling the mould, usually with water. Once the product has cured, the mould is opened and the product is removed.
Some products were produced in stationary moulds that required little manual intervention. Water has passed through these moulds during the curing cycle. At the completion of the curing cycle, the moulds were opened and the products ejected automatically. For these products, the direct labour content was minimal and the operation was machine-paced.
Other products were produced in removable moulds that required manual intervention. After the plastic was injected, these moulds were removed from the moulding machine and placed into a vat of water for the curing cycle. At the completion of the curing cycle, the moulds were opened manually and the product removed. For these products, the direct labour content could be significant since the operation was labour-paced.
The products also varied widely in terms of assembly and testing time required. On the one hand, the company manufactured paediatric syringes used in the care of premature infants. These syringes required extensive attention to quality control and a considerable amount of manual assembly in a ‘clean room’.
On the other hand, the company also manufactured wheel chocks that required only a cursory inspection and no assembly. The other products produced by BP varied between these two extremes.
In addition to the product costing complications caused by the wide mix of manufacturing, assembly and testing requirements, there were difficulties caused by the machines. Typical of the industry, the machines used at BP differed widely in terms of their reliability and their performance when producing different products. A machine problem meant that the machine would have to be stopped and reset.
Because the machine stoppages were highly unpredictable, incorporating a normal or average machine failure cost into the product cost was difficult.
On the other hand, the materials, assembly and testing costs of most products were well understood since each of these costs could be measured with reasonable accuracy. Materials costs could be estimated by the weight of the final product since the materials in most defective products could be reused. The assembly and testing operations involved the use of machines that were both highly reliable and labour- paced. These difficulties and the costing issues were all on Michael’s mind as he considered the milk crate contract.
THE MILK CRATE CONTRACT
Dairies in eastern Canada used plastic crates to ship milk cartons from the dairies to the stores. The annual sales volume of milk crates in the local region was about 30 000 units. Dairies merged their orders for crates through the Dairy Council in order to take maximum advantage of possible quantity discounts.
Michael had been asked to submit a bid on an initial order of 150 000 units. It was clear in Michael’s mind that a successful initial bid would give BP a competitive advantage in future orders.
Michael felt that the successful bid price for these crates would be ‘$3.00 plus or minus ten cents. Michael had been approached by the customer several times and felt that BP’s reputation for quality would ensure that a $3.00 bid would be successful. As a result, estimating the bid price was not the major issue. The question to be resolved was whether or not, given its cost structure, $3.00 could cover BP’s cost for producing this product.
Discussions with Walt Roberts and Larry Bobbit, BP’s technical and production supervisors, suggested that the machine cycle time to produce this product would be 50 seconds per unit. The product would be produced in a stationary mould and would be automatically ejected at the rate of one every 50 seconds. As a result, Michael calculated that it would require 20831 hours of machine running time to fill the order. On the basis of his discussion with Walt Roberts, Michael expected that the rate of defective crates produced by this process would be negligible.
Following discussions with Larry Bobbit, Michael felt that during the machine cycle the time machine operator would have sufficient time to trim the excess plastic (flash) off the previous crate that had been made and stamp that crate with the particular dairy’s name. Based on BP’s experience, which was comparable to the industry average, Michael calculated that the moulding machine would run for only 60 per cent of the time that it was scheduled for operation. The rest of the time that it was scheduled for operation the machine would be down for repair, set-up or maintenance.
Consequently, Michael estimated that it would require 34722 hours of scheduled machine time to achieve the required 2083 hours of machine operating time. Since the operator would be required for most of the repair time, all the set-up time, and all the maintenance time, an operator would have to be scheduled for each hour of scheduled machine time. Michael decided that the production of the milk crates would be undertaken on BP’s 750-ton injection moulder. This would require that some of the production scheduled for that be rescheduled to other machines. Because BP currently had excess capacity available on other machines, Michael felt that the new order would not require sacrificing any production of any other products. The cost of a production mould used to manufacture the milk crates would normally be $90 000. However, the Diary Council already owned a suitable mould which they had agreed to lend to the successful bidder on the contract.
Each milk crate weighed 1.6 kilograms. Polyethelene would be used to produce the milk crate. The cost of polyethylene was $1.07 per kilogram. Michael felt that plastic trimmed off crates, or plastic in defective crates, could be reprocessed at a minimal cost. Consequently, the cost of raw material per crate was estimated as $1.71.3 Since the machine operators were paid $6.00 per hour (including benefits), the labour cost per crate was computed at $0.14.4
The materials cost to stamp the crates was estimated as $0.01 per side, yielding a total cost of $0.04 per crate. In addition, a stamping machine costing $5000 would have to be acquired. The life of this simple stamping machine was estimated as 10 years, at least. The crates did not require packaging for shipping and the Dairy Council paid for shipment. Michael estimated that the labour costs to load the crates on a truck at the factory door would be $0.02 per crate. As a result of these calculations, Michael believed that the direct variable cost of producing the milk crates would be $1.91 (1.71 + .14 + .04 + 02).
This still left the matter of the overhead associated with producing each milk crate. This issue had been a source of continuing concern to Michael on almost every contract he negotiated. Michael knew that a common ‘rule of thumb’ in his plant was to apply variable overhead to products at a rate of $13 for each machine hour (running time). An industry rule of thumb was to estimate total variable cost as being 1.3 times the direct material and direct labour costs5.
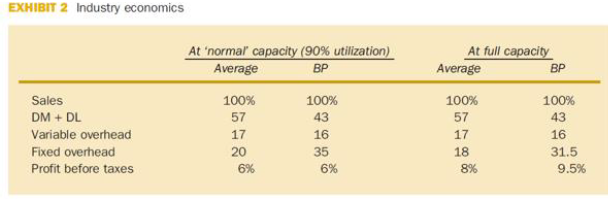
Some analysts also advocated looking at fixed, as well as variable, manufacturing overhead. Based on a recent study of BP’s costs, the corporate controller estimated that, on average, selling price must equal at least 2.33 times the sum of direct material and direct labour costs in order to earn average industry margins of 6 per cent (pre-tax) when operating at the industry average 90 per cent capacity utilization ratio (scheduled hours). Some comparative data on industry economics is summarized in Exhibit 2.
Michael wondered about the accuracy of any of these approaches in general and, in particular, he wondered if anyone was suitable in this situation. Michael looked at the ratio market price to the sum of direct material and direct labour cost for some of his more popular products and found that this ratio varied from two to seven. As a result, he wondered what, if anything, was the implication of the 2.33 factor.
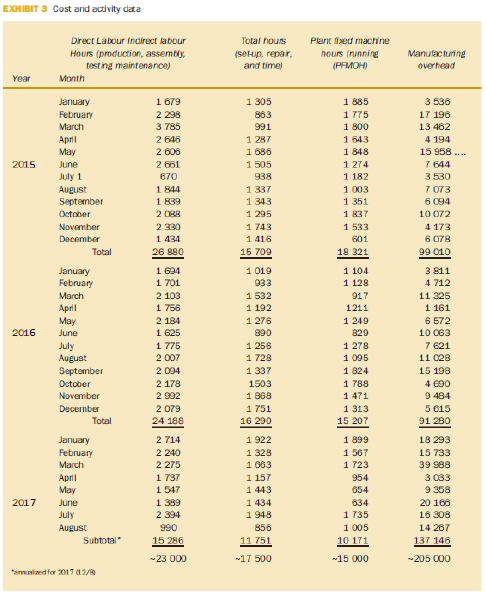
As a guide to understanding the relationship between direct costs (material and labour) and fixed manufacturing overhead Michael developed the data that appear in Exhibit 3. The plant accountant advised Michael that plant fixed manufacturing overhead did not include direct materials, direct labour, variable overhead or plant supervision (about $50 000 per year).
In addition to manufacturing costs, BP was incurring about $220 000 per year in Selling, General and Administrative (S, G & A) expenses. Michael was not sure how to use Exhibit 3 to help him assign overhead cost to the milk crate order. The results did seem to indicate that overhead was virtually unrelated to the level of output in the factory. The results thus did seem to support ‘contribution margin pricing’ policy. Michael was still unsure, however, as to how he should approach this large incremental order. He observed to the case writer: ‘If I only knew my cost structure better, I would feel more confident about what I’m doing. Right now I feel that I am shooting in the dark.’ When operating near capacity, BP shows up as the High CM/High fixed cost/high profit player. But note that the profit impact (Profit % of Sales) of BP’s apparent strategy only shows up near full capacity. High volume is a key to high profit for BP.
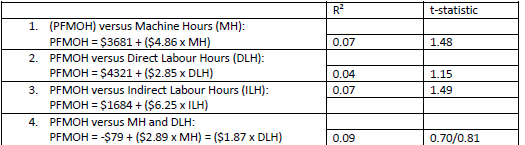
To explore the casual relationships reflected here, Michael developed the following four linear regressions:
QUESTIONS:
1. Based on your interpretation of Exhibit 3, what is your estimate of the change in ‘PFMOH’ cost if the factory was to run one extra batch of 150 000 milk crates?
2. What is your estimate of the incremental cost per unit for one batch of 150 000 milk crates?
3. What does Exhibit 2 suggest would be a ‘normal’ price for milk crates for an ‘average’ job shop? What does this suggest about the $3.00 price which seems to prevail at the time of the case?
4. What is the ‘strategically relevant’ cost per unit for milk crates (for purposes of deciding whether or not the $3.00 ‘market price’ is profitable, on an ongoing basis)?
5. What is your advice to Mr Smith regarding the milk crate opportunity? Be specific and show the calculations supporting your advice.
6. What overall strategic advice do you have for Mr Smith? Why isn’t the business doing better, given the new ‘specialities strategy’ and good business conditions? Support your answer with relevant cost analysis.
Transcribed Image Text:
EXHIBIT 1 Estimated income statement (2017) Given Sales $1200 (1/2.33 = 43% of Sales (15 000 x $13) Direct materials plus direct labour (515) (195) (16% of Sales) 490 Variable overhead Contribution margin (CM) Fixed overhead (205 + 220 + 50) (475) $15 (Just above break even) Profit before taxes EXHIBIT 2 Industry economics At 'normal capacity (90% utilization) Average At full capacity BP Average BP Sales 100% 100% 100% 100% DM + DL 57 43 57 43 Variable overhead 17 16 17 16 Fixed overhead 20 35 18 31.5 Profit before taxes 6% 6% 8% 9.5% EXHIBIT 3 Cost and activity data Drect Labour Indirect labour Total hours Plant xod machine Hours (production, assembly, testing maintenance) (seHup, repair, and time) hours (running (PFMOH) Manutacturing overhead Year Month 1 679 2 298 3 785 2 646 2 606 2 661 1 885 1 775 1 800 1 643 1 848 1 274 1 182 1 003 1 351 1 837 1 533 January 1 305 3 536 February 863 17 196 March 991 13 462 April 1 287 1 686 1 505 938 4 194 May 15 958 ... 2015 June 7 644 July 1 670 3 530 1 844 1 839 2 088 1 337 1 343 1 295 1 743 1 416 15 709 7 073 August September 6 094 October 10 072 November 2 330 4 173 6 078 99 010 December 1.434 601 Total 26 80 18 321 1 694 1 701 1 019 933 1 532 1 192 1 276 1 104 1 128 3 811 January February 4 712 11 325 1 161 6 572 10 063 March 2 103 917 1 756 April Мay 1211 2 184 1 249 1 625 1 775 2016 June 890 829 July August Septomber 1 256 1 728 1 337 1 278 1 095 7 621 11 C28 2 007 1 824 1 788 1 471 1 313 15 207 2 094 15 198 2 178 October November 1503 1 868 1 751 4 €90 9 484 5 €15 91 280 2 992 December 2 079 Total 24 188 16 290 1 899 1 567 1 723 January 2 714 1 922 1 328 1 683 1 157 1 443 1 434 1 948 18 293 February March 2 240 15 733 2 275 39 988 1 737 1 547 1 389 3 033 9 358 Аprl 954 May 654 2017 June 634 20 168 1 735 1 005 10 171 July 2 394 16 308 August 990 856 14 267 Subtotal" 15 286 11 751 137 146 -23 000 -17 500 -15 000 -205 C00 *amuslized for 2017 (12/9 t-statistic 1. (PFMOH) versus Machine Hours (MH): PFMOH = $3681 + ($4.86 x MH) PFMOH versus Direct Labour Hours (DLH): PFMOH = $4321 + ($2.85 x DLH) 0.07 1.48 2. 0.04 1.15 3. PFMOH versus Indirect Labour Hours (ILH): PFMOH = $1684 + ($6.25 x ILH) 0.07 1.49 4. PFMOH versus MH and DLH: PFMOH = -$79 + ($2.89 x MH) = ($1.87 x DLH) 0.09 0.70/0.81
> The study Loss of Nitrogen Through Sweat by Preadolescent Boys Consuming Three Levels of Dietary Protein was conducted by the Department of Human Nutrition and Foods at Virginia Tech to determine perspiration nitrogen loss at various dietary protein leve
> The purpose of the study The Incorporation of a Chelating Agent into a Flame Retardant Finish of a Cotton Flannelette and the Evaluation of Selected Fabric Properties conducted at Virginia Tech was to evaluate the use of a chelating agent as part of the
> Consider the data of Review Exercise 13.45 on page 555. Make significance tests on the following contrasts: (a) B versus A, C, and D; (b) C versus A and D; (c) A versus D. Exercise 13.45: Four laboratories are being used to perform chemical analysis. Sa
> Use Bartlett’s test at the 0.05 level of significance to test for homogeneity of variances in Exercise 13.6 on page 519. Exercise 13.6: A study measured the sorption (either absorption or adsorption) rates of three different types of o
> A random variable X follows a negative binomial distribution with parameters k = 5 and p [i.e.,b ∗ (x; 5, p)]. Furthermore, we know that p follows a uniform distribution on the interval (0, 1). Find the Bayes estimate of p under the squared-error loss fu
> Use Cochran’s test at the 0.01 level of significance to test for homogeneity of variances in Exercise 13.4 on page 519. Exercise 13.4: Immobilization of free-ranging white-tailed deer by drugs allows researchers the opportunity to clos
> Six different machines are being considered for use in manufacturing rubber seals. The machines are being compared with respect to tensile strength of the product. A random sample of four seals from each machine is used to determine whether the mean tens
> (a) Fit a multiple regression equation of the form μY |x = β0 + β1x + β2x2 to the data of Example 11.8 on page 420. (b) Estimate the yield of the chemical reaction for a temperature of 225 ◦ C.
> The following is a set of coded experimental data on the compressive strength of a particular alloy at various values of the concentration of some additive: (a) Estimate the quadratic regression equation μY |x = β0 + Î&s
> An experiment was conducted in order to determine if cerebral blood flow in human beings can be predicted from arterial oxygen tension (millimeters of mercury). Fifteen patients participated in the study, and the following data were collected: Estimat
> An experiment was conducted on a new model of a particular make of automobile to determine the stopping distance at various speeds. The following data were recorded. (a) Fit a multiple regression curve of the form μD|v = β0 +
> Rayon whiteness is an important factor for scientists dealing in fabric quality. Whiteness is affected by pulp quality and other processing variables. Some of the variables include acid bath temperature, â—¦ C (x1); cascade acid concent
> A client from the Department of Mechanical Engineering approached the Consulting Center at Virginia Tech for help in analyzing an experiment dealing with gas turbine engines. The voltage output of engines was measured at various combinations of blade spe
> For the quadratic model of Exercise 12.51(b), give estimates of the variances and covariances of the estimates of β1 and β11. Exercise 12.51(b): The following is a set of data for y, the amount of money (in thousands of dollars)
> For the model of Exercise 12.50(a), test the hypothesis H0: β4 = 0, H1: β4 ≠0. Use a P-value in your conclusion. Exercise 12.50(a): For the punter data in Case Study 12.2, an additional response, â€
> Suppose that a sample consisting of 5, 6, 6, 7, 5, 6, 4, 9, 3, and 6 comes from a Poisson population with mean λ. Assume that the parameter λ follows a gamma distribution with parameters (3, 2). Under the squared-error loss function, find the Bayes estim
> The following is a set of data for y, the amount of money (in thousands of dollars) contributed to the alumni association at Virginia Tech by the Class of 1960, and x, the number of years following graduation: (a) Fit a regression model of the type &Ici
> For the punter data in Case Study 12.2, an additional response, “punting distance,” was also recorded. The average distance values for each of the 13 punters are given. (a) Using the distance data rather than the hang
> The electric power consumed each month by a chemical plant is thought to be related to the average ambient temperature x1, the number of days in the month x2, the average product purity x3, and the tons of product produced x4. The past yearâ€&
> Use the techniques of backward elimination with α = 0.05 to choose a prediction equation for the data of Table 12.8.
> For the data of Exercise 12.15 on page 452, use the techniques of (a) forward selection with a 0.05 level of significance to choose a linear regression model; (b) backward elimination with a 0.05 level of significance to choose a linear regression mode
> Consider the “hang time” punting data given in Case Study 12.2, using only the variables x2 and x3. (a) Verify the regression equation shown on page 489. (b) Predict punter hang time for a punter with LLS = 180 pounds and Power = 260 foot-pounds. (c) C
> A study was done to determine whether the gender of the credit card holder was an important factor in generating profit for a certain credit card company. The variables considered were income, the number of family members, and the gender of the card hold
> A study was done to assess the cost effectiveness of driving a four-door sedan instead of a van or an SUV (sports utility vehicle). The continuous variables are odometer reading and octane of the gasoline used. The response variable is miles per gallon.
> For the data set given in Exericise 12.16 on page 453, can the response be explained adequately by any two regressor variables? Discuss. Exericise 12.16: An engineer at a semiconductor company wants to model the relationship between the gain or hFE of a
> Consider the data of Exercise 12.13 on page 452. Can the response, wear, be explained adequately by a single variable (either viscosity or load) in an SLR rather than with the full two-variable regression? Justify your answer thoroughly through tests of
> Suppose that the time to failure T of a certain hinge is an exponential random variable with probability density f(t) = θe−θt, t>0. From prior experience we are led to believe that θ is a value
> In Example 12.8, a case is made for eliminating x1, powder temperature, from the model since the P-value based on the F-test is 0.2156 while P-values for x2 and x3 are near zero. (a) Reduce the model by eliminating x1, thereby producing a full and a rest
> Consider Example 12.3 on page 447. Compare the two competing models. First order: yi = β0 + β1x1i + β2x2i + €i, Second order: yi = β0 + β1x1i + β2x2i+ β11x21i + β22x22i + β12x1ix2i + i. Use R2adj in your comparison. Test H0 : β11 = β22 =β12 = 0. In addit
> Consider Example 12.4. Figure 12.1 on page 459 displays a SAS printout of an analysis of the model containing variables x1, x2, and x3. Focus on the confidence interval of the mean response μY at the (x1, x2, x3) locations representing the 13 data points
> An experiment was conducted to determine if the weight of an animal can be predicted after a given period of time on the basis of the initial weight of the animal and the amount of feed that was eaten. The following data, measured in kilograms, were reco
> Consider the data of Exercise 11.55 on page 437. Fit a regression model using weight and drive ratio as explanatory variables. Compare this model with the SLR (simple linear regression) model using weight alone. Use R2, R2adj, and any t-statistics (or F-
> Consider the data for Exercise 12.36. Compute the following: R(β1 | β0), R(β1 | β0, β2, β3), R(β2 | β0, β1), R(β2 | β0, &I
> Consider the electric power data of Exercise 12.5 on page 450. Test H0: β1 = β2 = 0, making use of R(β1, β2 | β3, β4). Give a P-value, and draw conclusions. Exercise 12.5: The elec
> A small experiment was conducted to fit a multiple regression equation relating the yield y to temperature x1, reaction time x2, and concentration of one of the reactants x3. Two levels of each variable were chosen, and measurements corresponding to the
> Repeat Exercise 12.17 on page 461 using an F-statistic. Exercise 12.17: For the data of Exercise 12.2 on page 450, estimate σ2. Exercise 12.2: In Applied Spectroscopy, the infrared reflectance spectra properties of a viscous liquid used in
> For the model of Exercise 12.5 on page 450, test the hypothesis H0: β1 = β2 = 0, H1: β1 and β2 are not both zero. Exercise 12.5: The electric power consumed each month by a chemical plant is thought to be
> Suppose that in Example 18.7 the electrical firm does not have enough prior information regarding the population mean length of life to be able to assume a normal distribution for μ. The firm believes, however, that μ is surel
> Estimate the proportion of defectives being produced by the machine in Example 18.1 if the random sample of size 2 yields 2 defectives.
> This is an extract from Ducker, H., Head, A., McDonnell, B., O’Brien, R. and Richardson, S. (1998), A Creative Approach to Management Accounting: Case Studies in Management Accounting and Control, Sheffield Hallam University Press, ISBN
> This case study is taken from Ducker, J., Head, A., McDonnell, B., O'Brien, R. and Richardson, S. (1998), A Creative Approach to Management Accounting: Case Studies in Management Accounting and Control, Sheffield Hallam University Press, ISBN 086339 791
> Southern Paper Inc. is a global packaging company headquartered in the United States. The company was founded in the 1880s and has three principal business sectors – forest products, packaging and papers. The forest products division supplies lumber to t
> This case study is taken from Ducker, J., Head, A., McDonnell, B., O'Brien, R. and Richardson, S. (1998), A Creative Approach to Management Accounting: Case Studies in Management Accounting and Control, Sheffield Hallam University Press, ISBN 086339 791
> This case was originally set in the 1960s in rural Vermont. The Majestic Lodge is an old but well-maintained property that has changed ownership several times over the years. It has no restaurant or bar. It is positioned as a mid-price, good quality "des
> The Managing Director of the Kiddy Toy Company (KTC) needs to decide whether a special export order should be accepted or rejected, with reasons provided, for the manufacture of Panda bears. The background Official statistics indicate that China manufact
> Anjo Ltd was established in 1986 by two brothers, Andrew and Jonathan Bright. They saw a market for providing accessories in the home to accommodate the new era of home entertainment, such as television cabinets, record stands, hi-fi cabinets, tape casse
> Permission to reprint this case has been granted by Captus Press Inc. and the Accounting Education Resource Centre of the University of Lethbridge. Foster’s Construction Ltd: Organizational Background Fosters Construction Ltd (FCL) is a privately owned c
> Airport Complex was founded in Northern Europe in the early 1960s, and at the time it primarily served as a domestic airport. During the 1980s, flights to foreign destinations became an ever more vital activity for the airport. Today, the airport functio
> Hardhat Ltd’s Budget Committee, which has members drawn from all the major functions in the business, is meeting to consider the projected income statement for 2018/2019, which is composed of the ten months’ actuals to
> The Application of Linear Programming to Management Accounting Midland Airport Ltd LEARNING OBJECTIVES: After reading this case study and completing the questions you will be able to: • Formulate the initial linear programming model (ob
> Fleet operates a chain of high street retail outlets selling clothing and household items. In 1995 this company was heading for a financial loss and was deemed to have lost strategic direction. The business formula that had proved successful in the 1980s
> This case study is taken from Ducker, J., Head, A., McDonnell, B., O'Brien, R. and Richardson, S. (1998), A Creative Approach to Management Accounting: Case Studies in Management Accounting and Control, Sheffield Hallam University Press, ISBN 086339 791
> In November 2012, a consultant was employed to review and document the planning and control systems of Integrated Technology Services (UK) Ltd (ITS-UK), to ensure that these were effectively meeting the needs of the business and to provide a basis for st
> This case was originally set in a specialty manufacturer of industrial measuring instruments in Scotland in 1979. The topic is profit variance analysis. THE FIRM Kinkead has been a leading UK firm since World War II in specialty instruments for measuring
> Company A is in the chemical industry and a manufacturer of industrial paints. At one of its manufacturing sites (site 1) a new system of costing and management information is being considered to replace a traditional system, which was not meeting fully
> The Board of Dumbellow Ltd are meeting on the 23rd January to discuss the draft budget for 2018/19, some two months before the start of that year. The company produces three industrial valves which are incorporated into equipment used in the Oil and Gas
> Learning objectives: After reading this case study and completing the questions you will be able to: • Demonstrate familiarity with two methods of process costing: weighted average and FIFO. • Discuss the treatment of normal loss, abnormal loss and abnor
> The case was prepared as the basis for discussion rather than to illustrate either effective or ineffective handling of an administrative situation. Danfoss Drives A/S is a Danish producer of frequency converters located in Graasten in the southern part
> Company B is a manufacturer of large, complex electrical motors. It has been making them 'to order', in order quantities of, typically, one-four in a jobbing/batch production system for many years. A typical selling price may range from £3000-£20 000 per
> Learning objectives: After reading this case study and completing the questions you will be able to: • Explain the alternative methods of allocating joint costs to products. • Discuss the arguments for and against each
> Mestral is a highly successful company manufacturing a range of quality bathroom fittings. For the past 15 years production has been carried out at three locations: Northern town in the North East of England; at Western town on the Severn estuary; and at
> Kaminsky Ltd manufactures belts and braces. The firm is organized into five departments. These are belt-making, braces-making and three service departments (maintenance, warehousing and administration). Direct costs are accumulated for each department. F
> (a). Flopro plc makes and sells two products A and B, each of which passes through the same automated production operations. The following estimated information is available for period 1: (ii). Production/sales of products A and B are 120 000 units and
> Galuppi plc is considering whether to scrap some highly specialized old plant or to refurbish it for the production of drive mechanisms, sales of which will last for only three years. Scrapping the plant will yield £25 000 immediately, where
> Franzl is a contract engineer working for a division of a large construction company. He is responsible for the negotiation of contract prices and the subsequent collection of instalment monies from customers. It is company policy to achieve a mark-up of
> Paragon Products plc has a factory that manufactures a wide range of plastic household utensils. One of these is a plastic brush that is made from a special raw material used only for this purpose. The brush is moulded on a purpose-built machine that was
> Losrock Housing Association is considering the implementation of a refurbishment programme on one of its housing estates which would reduce maintenance and heating costs and enable a rent increase to be made. Relevant data are as follows: (i). Number of
> Using the discounted cash flow yield (internal rate of return) for evaluating investment opportunities has the basic weakness that it does not give attention to the amount of the capital investment, in that a return of 20 per cent on an investment of &Ac
> The Portsmere Hospital operates its own laundry. Last year the laundry processed 120 000 kilograms of washing and this year the total is forecast to grow to 132 000 kilograms. This growth in laundry processed is forecast to continue at the same percentag
> You are employed as the assistant accountant in your company and you are currently working on an appraisal of a project to purchase a new machine. The machine will cost £55 000 and will have a useful life of three years. You have already est
> Your company is considering investing in its own transport fleet. The present position is that carriage is contracted to an outside organization. The life of the transport fleet would be five years, after which time the vehicles would have to be disposed
> Garrett Automative Ltd (GAL) is a UK subsidiary of a American parent company that manufactures turbochargers for the automative industry. GAL decided to begin its profit improvement programme by examining its factory throughput. Throughput was defined as
> The following information relates to three possible capital expenditure projects. Because of capital rationing only one project can be accepted: The company estimates its cost of capital is 18 per cent. Calculate: (a). The payback period for each proje
> Short flower Ltd currently publish, print and distribute a range of catalogues and instruction manuals. The management has now decided to discontinue printing and distribution and concentrate solely on publishing. Long plant Ltd will print and distribute
> Cassidy Computers plc sells one of its products, a plug-in card for personal computer systems, in both the UK and Ruritania. The relationship between price and demand is different in the two markets, and can be represented as follows: Home market: Price
> Butterfield Ltd manufactures a single brand of dog food called ‘Lots O Grissle’ (LOG). Sales have stabilized for several years at a level of £20 million per annum at current prices. This level is not expected to change in the foreseeable future (except a
> Safety or buffer stocks are held for many reasons. For example, road authorities might want to hold sufficient stock of grit salt in case of bad weather, or firms might build stock of key materials if a price rise is impending. In recent times climate c
> The Boeing 737 jet is the world’s most popular and reliable commercial airliner. The company has manufactured over 8000 jets in the 737 family. In 2005, the 737-900ER was launched, which can carry more passengers over a further range than any previous mo
> Modern day aircraft are complex pieces of engineering, increasingly using more technology, composite materials and more efficient engines. Aircraft engines are in particular improving not only in fuel efficiency, but also in range, thus contributing to l
> South African energy and chemicals company Sasol, like many companies dealing with large-scale projects, needs to prepare cost estimates. Sasol specialize in high value liquid fuels, chemicals and low-carbon electricity. In 2014, the company decided to i
> In the March 2012 edition of CIMA’s Financial Management journal, Christian Doherty asks what will management accountants ten years on be grappling with? This question has been posed before (see, for example, Scapings et al., 2003) and technology is a fa
> According to a US Congressional enquiry, this accident apparently partly resulted from local decisions within the oil multinational BP and its contractors to save relatively immaterial costs by cutting corners in oil exploration safety measures (National
> As one of the pioneers in the low-cost airline market, easyJet’s business model includes some core values: ● Safety – Our number one value, sitting at the core of everything we do. ● Pioneering – We challenge to find new ways to make travel easy and affo
> Insteel Industries decided to implement ABM at the Andrews, South Carolina, plant. The ABM team analysed operations and identified 12 business processes involving a total of 146 activities. The ABM study revealed that the 20 most expensive activities acc
> Taylor, Woods and Cheng Ge Fang (2014) reported on how one UK company moved its target costing system away from profit targets and focused it on product-level economic value added (EVA(TM)) targets. The company, which used the pseudonym Electronics for c
> Management accounting combines accounting, finance and management with the leading-edge techniques needed to drive successful businesses. Chartered management accountants: ● Advise managers about the financial implications of projects. ● Explain the fina
> Following events of September 2001, airport security screening in the US and globally increased dramatically. As we all know, this led to increasing queues at airports which while inconvenient, are paramount to the safety and security of passengers. Sin
> As a result of the recent financial troubles at Tesco its shares declined to an 11-year low in 2014. Terry Smith, chief executive of investment house Fundsmith, stated in an article published in The Financial Times that investors had long ignored warning
> An article by Chen et al. (2015) published in Strategic Finance described how Zhongyuan Special Steel Co. (ZYSCO), a typical Chinese state-owned company, introduced a new strategic management system that would integrate its value creation strategy into e
> Southwest Airlines set ‘operating efficiency’ as its strategic theme. The four perspectives embodied in the balanced scorecard were linked together by a series of relatively simple questions and answers: Financial: Wha
> The Globe and Mail (Canada) quotes an article written by Professor Pietro Micheli in Industry Week in which he listed seven myths about performance management that promote the wrong behaviours. The following is a summary of these myths: Myth 1: Numbers
> Across Europe, just how much – or little – US multinational firms are paying in taxes is coming under intense scrutiny according to an article published in the Washington Post. Most of the investigations revolve around the issue of ‘transfer pricing’, wh
> According to an article in the Financial Times the UK tax authority (HMRC – HM Revenue & Customs) raised £1.1bn from challenging the pricing of multinational companies’ internal deals in 2013–14 – more than twice as much as in the previous year. The incr
> Medical devices are normally associated with use by hospitals and medical practices. Some devices are used by normal consumers and, according to an article on the Medical Device and Diagnostic Industry website (www.mddionline.com), are proliferating. The
> Teva Pharmaceutical Industries Ltd reorganized its pharmaceutical operations into decentralized cost and profit centres. Teva proposed a transfer pricing system based on marginal costs. But the proposed transfer pricing system generated a storm of contro
> The financial mission of a company should be to invest and create cash flows in excess of the cost of capital. If an investment is announced that is expected to earn in excess of the cost of capital, then the value of the firm will immediately rise by th
> From Real World View 19.1, you know that Siemens operates in many countries and has quite a diverse product offering. With such complex and broad operations, there are many factors that can affect the performance of a business sector or division. In its
> German global company Siemens AG had a turnover of almost €76 billion in 2015, recording a profit after taxes of €7.4 billion, according to its annual report. The company operates globally, with 351 000 employees globally. Siemens is a diverse organizati
> A distinguishing feature of today’s digital technology is that it is characterized by zero (or near-zero) marginal costs. Once you’ve made the investment needed to create a digital good, it costs next to nothing to roll out and distribute millions of cop
> In a BBC documentary called Power to the People, Michael Portillo visited a ‘You Decide’ session organized by the local council in Tower Hamlets, London. At this session, local people decide what is to be done with £250 000 of council money. They are giv

