Question: Starbucks is a resounding restaurant success story.
Starbucks is a resounding restaurant success story. Beginning with its first coffee house in 1971, Starbucks has grown to more than 28,218 stores. Opening up its first international outlet in the mid-1990s, Starbucks now operates in more than 67 countries outside of North America. Besides selling beverages, pastries, confections, and coffee- related accessories and equipment at its retail outlets, Starbucks also purchases and roasts high-quality coffee beans in several locations. The company's objective is to become the most recognized and respected brand in the world. Starbucks maintains a strong environmental orientation and is committed to taking a leadership position environmentally. In addition, the company has won awards for corporate social responsibility through its community-building programs, its strong commitment to its origins (coffee producers, family, community), and the Starbucks Foundation, which is dedicated to creating hope, discovery, and opportunity in the communities where Starbucks resides.
In November 2001, Starbucks launched its prepaid (debit) Starbucks Card. The card, which holds between $5 and $500, can be used at virtually any Starbucks location. The card was so popular when it was first released that many stores ran out. By mid-2002, Starbucks had activated more than 5 million of these cards. The Starbucks Card has surpassed the $25 billion mark for total activations and reloads since its introduction. As customers “reload†the cards, it appears they are placing more money on them than the initial value of the card.
Starbucks has gone on to promote their Starbucks Card as a flexible marketing tool that can be used by individuals as a gift of thanks and appreciation for friendship or service and can be used by companies to reward loyal customers and as an incentive to employees.
Required:
1. Starbucks enjoyed considerable success with its debit cards, which they sell for $5 to $500. Suppose Starbucks management wants to study the reasons why some people purchase debit cards with higher prepaid amounts than do other people. Suppose a study of 25 randomly selected prepaid card purchasers is taken. Respondents are asked the amount of the prepaid card, the customer's age, and the number of days per month the customer makes a purchase at Starbucks, the number of cups of coffee the customer drinks per day, and the customer's income. The data follow. Using these data, develop a multiple regression model to study how well the amount of the prepaid card can be predicted by the other variables and which variables seem to be more promising in doing the prediction. What sales implications might be evident from this analysis?
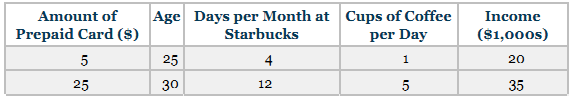
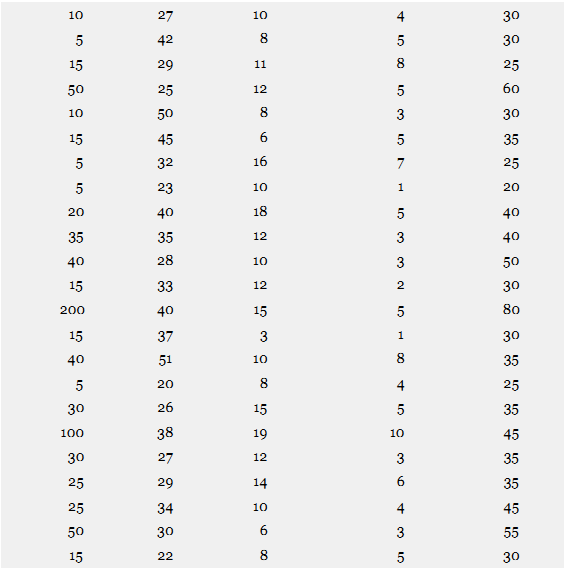
2. Suppose marketing wants to be able to describe frequent visitors to a Starbucks store. Using the same data set already provided, develop a multiple regression model to predict Days per month at Starbucks by Age, Income, and Number of cups of coffee per day. How strong is the model? Which particular independent variables seem to have more promise in predicting how many days per month a customer visits Starbucks? What marketing implications might be evident from this analysis?
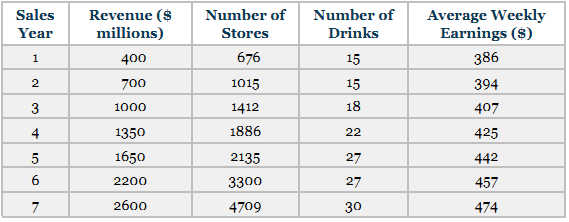
3. Over the past decade or so, Starbucks has grown quite rapidly. As they add stores and increase the number of drinks, their sales revenues increase. In reflecting about this growth, think about some other variables that might be related to the increase in Starbucks sales revenues. Some data for the past seven years on the number of Starbucks stores (worldwide), approximate sales revenue (in $ millions), number of different drinks sold, and average weekly earnings of U.S. production workers are given here. Most figures are approximate. Develop a multiple regression model to predict sales revenue by number of drinks sold, number of stores, and average weekly earnings. How strong is the model? What are the key predictors, if any? How might this analysis help Starbucks management in attempting to determine what drives sales revenues?
> The American Research Group, Inc., conducted a telephone survey of a random sample of 1100 U.S. adults in a recent year and determined that the average amount of planned spending on gifts for the holiday season was $854 and that 40% of the purchases woul
> A manager of a car dealership believes there is a relationship between the number of salespeople on duty and the number of cars sold. Suppose the following sample is used to develop a simple regression model to predict the number of cars sold by the numb
> Determine the equation of the trend line through the following cost data. Use the equation of the line to forecast cost for year 7. Year _______ Cost ($ millions) 1 ……………………… 56 2 ……………………… 54 3 ……………………… 49 4 ……………………… 46 5 ……………………… 45
> Determine the equation of the least squares regression line to predict y from the following data. a) Construct a 95% confidence interval to estimate the mean y value for x = 60. b) Construct a 95% prediction interval to estimate an individual y value fo
> If you were to develop a regression line to predict y by x, what value would the coefficient of determination have?
> Use the following data for parts a through g. a) Determine the equation of the simple regression line to predict y from x. b) Using the x values, solve for the predicted values of y and the residuals. c) Solve for SSE. d) Calculate the standard error of
> Use the following data for parts a through f. a) Determine the equation of the least squares regression line to predict y by x. b) Using the x values, solve for the predicted values of y and the residuals. c) Solve for se. d) Solve for r2. e) Test the s
> Determine the Pearson product-moment correlation coefficient for the following data.
> E-commerce sales in the United States have been growing for many years. Shown below are quarterly adjusted e-commerce sales figures ($ billions) released by the Census Bureau for the United States over a three-year period. Use these data to determine the
> The National Safety Council released the following data on the incidence rates for fatal or lost-worktime injuries per 100 employees for several industries in three recent years. Compute r for each pair of years and determine which years are most highly
> Shown below are rental and leasing revenue figures for office machinery and equipment in the United States over a seven-year period according to the U.S. Census Bureau. Use these data to construct a trend line and forecast the rental and leasing revenue
> Determine the equation of the trend line for the data shown below provided by the U.S. Census Bureau on U.S. exports of fertilizers to Indonesia over a five-year period. Using the trend line equation, forecast the value for the year 2020. Year _________
> Construct a 99% confidence interval for the average bond rate in Problem 12.9 for a prime interest rate of 10%. Discuss the meaning of this confidence interval.
> Construct a 98% confidence interval for the average value of y for Problem 12.8 using x = 20. Construct a 98% prediction interval for a single value of y for Problem 12.8 using x = 20. Which is wider? Why?
> Construct a 90% prediction interval for a single value of y for Problem 12.7 using x = 100. Construct a 90% prediction interval for a single value of y for Problem 12.7 using x = 130. Compare the results. Which prediction interval is greater? Why?
> Construct a 95% confidence interval for the average value of y for Problem 12.6. Use x = 25.
> Study the following analysis of variance table which was generated from a simple regression analysis. Discuss the F test of the overall model. Determine the value of t and test the slope of the regression line.
> Test the slope of the regression line developed in Problem 12.10. Use a 5% level of significance.
> Test the slope of the regression line developed in Problem 12.10. Use a 5% level of significance.
> Test the slope of the regression line determined in Problem 12.8. Use α = .10.
> The following data are the claims (in $ millions) for BlueCross BlueShield benefits for nine states, along with the surplus (in $ millions) that the company had in assets in those states. Use the data to compute a correlation coefficient, r, to determin
> Test the slope of the regression line determined in Problem 12.7. Use α = .01.
> Test the slope of the regression line determined in Problem 12.6. Use α = .05.
> The Conference Board produces a Consumer Confidence Index (CCI) that reflects people’s feelings about general business conditions, employment opportunities, and their own income prospects. Some researchers may feel that consumer confidence is a function
> In Problem 12.10, you were asked to develop the equation of a regression model to predict the number of business bankruptcies by the number of firm births. For this regression model, solve for the coefficient of determination and comment on it.
> Compute r2 for Problem 12.27 (Problem 12.9). Discuss the value of r2 obtained.
> In decision analysis, decision-making scenarios are divided into three categories: decision-making under ______________, decision-making under _______________, and decision-making under ______________. 2. Many decision analysis problems can be viewed as
> A graphical method for evaluating whether a process is or is not in a state of statistical control is called a ________________. 15. A diagram that is shaped like a fish and displays potential causes of one problem is called a __________ or ___________ d
> The collection of strategies, techniques, and actions taken by an organization to assure themselves that they are producing a quality product is ____________________. 2. Measuring product attributes at various intervals throughout the manufacturing proce
> Suppose a researcher desires to analyze the data below using a Kruskal-Wallis test to determine if there is a significant difference in the populations from which the four samples were taken. The degrees of freedom associated with the Kruskal-Wallis tes
> For the problem presented in question 8, the observed value of z is _______________. Based on this value and the critical value determined in question 8, the decision should be to _______________ the null hypothesis. 12. The nonparametric alternative to
> Statistical techniques based on assumptions about the population from which the sample data are selected are called _______________ statistics. 2. Statistical techniques based on fewer assumptions about the population and the parameters are called ______
> In using the chi-square goodness-of-fit test, a statistician needs to make certain that none of the expected values are less than _______________. 12. The chi-square ____________________ is used to analyze frequencies of two variables with multiple categ
> Compute r2 for Problem 12.26 (Problem 12.8). Discuss the value of r2 obtained.
> Statistical techniques based on assumptions about the population from which the sample data are selected are called _______________ statistics. 2. Statistical techniques based on fewer assumptions about the population and the parameters are called ______
> Consider the data below: Month _________ Volume Jan. …………………….. 1230 Feb. …
> Shown below are the forecast values and actual values for six months of data: The mean absolute deviation of forecasts for these data is __________. The mean square error is __________________. 2. Data gathered on a given characteristic over a period
> Another name for an indicator variable is a ________________ variable. These variables are _____________________ as opposed to quantitative variables. 2. Indicator variables are coded using __________ and _________. 3. Suppose an indicator variable has
> 1. In multiple regression, an _______ statistic is used to test for the overall effectiveness of the model. 2. The significance of individual regression coefficients in a multiple regression model is tested using a ______ ratio. 3. The value, se, represe
> The value of Se is computed from the data of question 24 is _______________. 26. Suppose a regression model results in a value of se = 27.9. 95% of the residuals should fall within _______________. 27. Coefficient of determination is denoted by ________
> In regression analysis, bo represents the sample _______________. 14. A researcher wants to develop a regression model to predict the price of gold by the prime interest rate. The dependent variable is _______________. 15. In an effort to develop a reg
> _______________ is a measure of the degree of relatedness of two variables. 2. The Pearson product-moment correlation coefficient is denoted by _______________. 3. The value of r varies from _________________________. 4. Perfect positive correlation res
> The Fletcher-Terry Company of Farmington, Connecticut, is a worldwide leader in the development of glass-cutting tools and accessories for professional glaziers, glass manufacturers, glass artisans, and professional framers. The company can trace its roo
> Standard Motor Products, Inc. (SMP), headquartered in Long Island City, New York, manufactures and distributes replacement parts in the automotive aftermarket industry. The company sells products to warehouse distributors and auto parts retailers in Nort
> Compute r2 for Problem 12.25 (Problem 12.7). Discuss the value of r2 obtained.
> In 1895, Ignaz Schwinn and his partner, Adolph Arnold, incorporated the Arnold, Schwinn & Company in Chicago to produce bicycles. In the early years with bicycle products such as the “Roadster,” a single-speed bike
> Foot Locker, Inc., is the world’s number-one retailer of athletic footwear. Headquartered in New York City, the company has over 32,175 employees and 3310 retail stores in 27 countries across North America, Europe, Asia, Australia, and
> The DeBourgh Manufacturing Company was founded in 1909 as a metal-fabricating company in Minnesota by the four Berg brothers. In the 1980s, the company ran into hard times, as did the rest of the metal fabricating industry. Among the problems that DeBour
> Virginia Semiconductor, Inc., is a leading manufacturer of prime silicon substrates and since 1997 has been the world’s number-one on-line source for silicon wafers and substrates. The company, situated in Fredericksburg, Virginia, was
> Caterpillar, Inc., headquartered in Peoria, Illinois, is an American corporation with a worldwide dealer network that sells machinery, engines, financial products, and insurance. Caterpillar is the world’s leading manufacturer of constr
> A home buyer is completing an application for a home mortgage. The buyer is given the option of “locking in” a mortgage loan interest rate or waiting 60 days until closing and locking in a rate on the day of closing. The buyer is not given the option of
> Use the following decision table to complete parts a through c. a) Draw a decision tree to represent this payoff table. b) Compute the expected monetary values for each decision and label the decision tree to indicate what the final decision would be. c
> How much is the expected monetary payoff with perfect information in Problem 19.5? From this answer and the decision reached in Problem 19.6, what is the value of perfect information? Refer to the Problem 19.5:
> Suppose the probabilities of the states of nature occurring for Problem 19.5 are s1 = .15, s2 = .25, s3 = .30, s4 = .10, and s5 = .20. Use these probabilities and expected monetary values to reach a conclusion about the decision alternatives in Problem 1
> Compute r2 for Problem 12.24 (Problem 12.6). Discuss the value of r2 obtained.
> Use the following decision table to construct a decision tree.
> The introduction of a new product into the marketplace is quite risky. The percentage of new product ideas that successfully make it into the marketplace is as low as 1%. Research and development costs must be recouped, along with marketing and productio
> Election results can affect the payoff from certain types of investments. Suppose a brokerage firm is faced with the prospect of investing $20 million a few weeks before the national election for president of the United States. They feel that if a Republ
> A city is considering airport expansion. In particular, the mayor and city council are trying to decide whether to sell bonds to construct a new terminal. The problem is that at present demand for gates is not strong enough to warrant construction of a n
> A small retailer began as a mom-and-pop operation selling crafts and consignment items. During the past two years, the store’s volume grew significantly. The owners are trying to decide whether to purchase an automated checkout system.
> A U.S. manufacturing company decided to consider producing a particular model of one of its products just for sale in Germany. Because of the German requirements, the product must be made specifically for German consumption and cannot be sold in the Unit
> An entertainment company owns two amusement parks in the South. They are faced with the decision of whether to open the parks in the winter. If they choose to open the parks in the winter, they can leave the parks open during regular hours (as in the sum
> Some companies use production learning curves to set pricing strategies. They price their product lower than the initial cost of making the product; after some period of time, the learning curve takes effect and the product can be produced for less than
> Use the decision table given here to complete parts a through d a) Use the maximax criterion to determine which decision alternative to select. b) Use the maximin criterion to determine which decision alternative to select. c) Use the Hurwicz criterion
> Managers of a manufacturing firm decided to add Christmas tree ornaments to their list of production items. However, they have not decided how many to produce because they are uncertain about the level of demand. Shown here is a decision table that has b
> Determine the equation of the regression line to predict annual sales of a company from the yearly stock market volume of shares sold in a recent year. Compute the standard error of the estimate for this model. Does volume of shares sold appear to be a g
> Shown here is a decision table. A forecast can be purchased by the decision maker. The forecaster is not correct 100% of the time. Also given is a table containing the probabilities of the forecast being correct under different states of nature. Use the
> Use the following decision table to complete parts a through c. a) Draw a decision tree to represent this decision table. b) Compute the expected monetary values for each decision and label the decision tree to indicate what the final decision would be.
> Use the following decision table to complete parts a through d. a) Use the maximax criterion to determine which decision alternative to select. b) Use the maximin criterion to determine which decision alternative to select. c) Use the Hurwicz criterion
> Some oil speculators are interested in drilling an oil well. The rights to the land have been secured and they must decide whether to drill. The states of nature are that oil is present or that no oil is present. Their two decision alternatives are drill
> A small group of investors is considering planting a tree farm. Their choices are (1) don’t plant trees, (2) plant a small number of trees, or (3) plant a large number of trees. The investors are concerned about the demand for trees. If
> A car rental agency faces the decision of buying a fleet of cars, all of which will be the same size. It can purchase a fleet of small cars, medium cars, or large cars. The smallest cars are the most fuel efficient and the largest cars use the most fuel.
> Shown here is a decision table from a business situation. The decision maker has an opportunity to purchase sample information in the form of a forecast. With the sample information, the prior probabilities can be revised. Also shown are the probabilitie
> A person has a chance to invest $50,000 in a business venture. If the venture works, the investor will reap $200,000 including the investment. If the venture fails, the investor will lose his money. It appears that there is about a .50 probability of the
> A CEO faces a tough human resources decision. Because the company is currently operating in a budgetary crisis, the CEO will either lay off 1000 people, lay off 5000 people, or lay off no one. One of the problems for the CEO is that she cannot foretell w
> Use the decision table given here to complete parts a through d. a) Use the maximax criterion to determine which decision alternative to select. b) Use the maximin criterion to determine which decision alternative to select. c) Use the Hurwicz criterion
> Determine the SSE and the se for Problem 12.20. Comment on the size of se for this regression model, which is used to predict the cost of milk.
> In an effort to determine whether any correlation exists between the price of stocks of airlines, an analyst sampled six days of activity of the stock market spread out over four months. Using the following prices of Delta stock and Southwest stock, comp
> A soft drink bottling company just ran a long line of 12-ounce soft drink cans filled with cola. A sample of 32 cans is selected by inspectors looking for nonconforming items. Among the things the inspectors look for are paint defects on the can, imprope
> A firm in the upper Midwest manufactures light bulbs. Before the bulbs are released for shipment, a sample of bulbs is selected for inspection. Inspectors look for non-conformances such as scratches, weak or broken filaments, incorrectly bored turns, ins
> A large manufacturer makes valves. Currently it is producing a particular valve for use in industrial engines. As a part of a quality-control effort, the company engineers randomly sample seven groups of 40 valves and inspect them to determine whether th
> A machine operator at a pencil-manufacturing facility gathered 10 different random samples of 100 pencils. The operator’s inspection was to determine whether the pencils were in compliance or out of compliance with specifications. The r
> Study the Minitab c chart for non-conformances for a part produced in a manufacturing process. Comment on the results.
> Study the Minitab ( chart for a manufactured item. The chart represents the results of testing 30 items at a time for compliance. Sixty different samples were taken for this chart. Discuss the results and the implications for the production process.
> Study the Minitab R chart for the product and data used in Problem 18.24. Comment on the state of the production process for this item.
> Study the Minitab chart on the fill of a product that is supposed to contain 12 ounces. Does the process appear to be out of control? Why or why not?
> Use the data from Problem 12.19 and determine the se. Refer to the Problem Data 12.19:
> A glass manufacturer produces hand mirrors. Each mirror is supposed to meet company standards for such things as glass thickness, ability to reflect, size of handle, quality of glass, color of handle, and so on. To control for these features, the company
> A bathtub manufacturer closely inspects several tubs on every shift for non-conformances such as leaks, lack of symmetry, unstable base, drain malfunctions, and so on. The following list gives the number of non-conformances per tub for 40 tubs. Use these
> A plastics company makes thousands of plastic bottles for another company that manufactures saline solution for users of soft contact lenses. The plastics company randomly inspects a sample of its bottles as part of its quality control program. Inspector
> A company produces outdoor home thermometers. For a variety of reasons, a thermometer can be tested and found to be out of compliance with company specifications. The company takes samples of thermometers on a regular basis and tests each one to determin
> An airline company uses a central telephone bank and a semi-automated telephone process to take reservations. It has been receiving an unusually high number of customer complaints about its reservation system. The company conducted a survey of customers,
> A metal-manufacturing company produces sheet metal. Statistical quality control technicians randomly select sheets to be inspected for blemishes and size problems. The number of non-conformances per sheet is tallied. Shown here are the results of testing
> A bottled-water company has been randomly inspecting bottles of water to determine whether they are acceptable for delivery and sale. The inspectors are looking at water quality, bottle condition, and seal tightness. A series of 10 random samples of 50 b
> In Problem 12.10, you were asked to develop the equation of a regression model to predict the number of business bankruptcies by the number of firm births. For this regression model, solve for the standard error of the estimate and comment on it.
> A brainstorm session on possible causes of a problem resulted in five possible causes: A, B, C, D, and E. Cause A has three possible subcauses, cause B has four, cause C has two, cause D has five, and cause E has three. Construct a fishbone diagram for t
> An examination of rejects shows at least 10 problems. A frequency tally of the problems follows. Construct a Pareto chart for these data. Problem ____________ Frequency 1 ……………………………………………. 673 2 …………………………………………….. 29 3 …………………………………………… 108 4 ………………………
> Create a flowchart from the following sequence of activities: Begin. Flow to activity A. Flow to decision B. If Yes, flow to activity C. If No, flow to activity D. From C flow to activity E and to activity F. From F, flow to decision G. If Yes, flow to d
> Study each of the following Minitab control charts and determine whether any of them indicate problems in the processes. Comment on each chart. a) b) c)
> Examine the three control charts shown. Discuss any and all control problems that may be apparent from these control charts. a) b) c)

