Question: The data below show alcohol expenditure and
The data below show alcohol expenditure and income (both in £s per week) for a sample of 17
families.
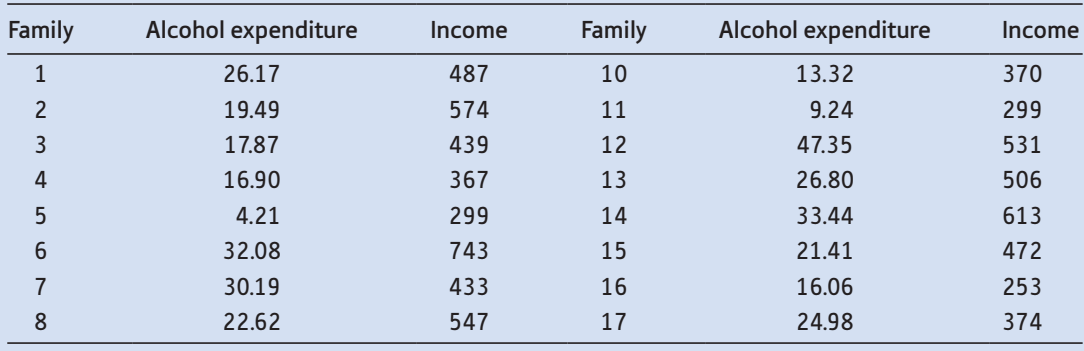
a. Draw an XY plot of the data and comment.
b. From the chart, would you expect the line of best fit to slope up or down? In theory, which way should it slope?
c. What would you expect the correlation coefficient to be, approximately?
d. Calculate the correlation coefficient between alcohol spending and income.
e. Is the coefficient significantly different from zero? What is the implication of the result?
(The following totals will reduce the burden of calculation: ΣY = 137.990; ΣX = 7610; ΣY2 = 9 918.455; ΣX2 = 3 680 748; ΣXY = 181 911.250; Y is consumption, X is income. If you wish, you could calculate a logarithmic correlation. The relevant totals are: Σy = 50.192; Σx = 103.079; Σy2 = 153.567; Σx2 = 626.414; Σxy = 306.339, where y = ln Y and x = ln X.)
(Analysis of this problem continues in Problem 7.6.)
Transcribed Image Text:
Family Alcohol expenditure Income Family Alcohol expenditure Income 1 26.17 487 10 13.32 370 2 19.49 574 11 9.24 299 3 17.87 439 12 47.35 531 4 16.90 367 13 26.80 506 5 4.21 299 14 33.44 613 6. 32.08 743 15 21.41 472 7 30.19 433 16 16.06 253 8 22.62 547 17 24.98 374
> Ralph wants to join a travel soccer team, a discretionary expense. His parents tell him he must get a job to earn the money to cover the costs. Ralph now views this discretionary expense as an essential expense since he must pay his parents b
> An orchestra of 25 members bought tickets, at all different prices, to a concert, and the mean price paid was $82. A new musician joined the orchestra and spent $90 on his ticket to the same concert. What is the new mean price paid when the new musician
> The following is a list of Relay for Life donations given by several community businesses in the Maple Glen High School vicinity. $10, $50, $100, $100, $100, $120, $120, $125, $150, $150, $250. Round your answers to the nearest hundredth. a. What is the
> Jocelyn compiled data on the number of hours students work per week the summer after senior year. The minimum number of hours in the distribution was 23. The range was 17. a. What is the maximum number of hours in the distribution? b. If the maximum scor
> A distribution of newly manufactured amusement park bumper cars has mean 400 pounds and standard deviation 2 pounds. A distribution of customers on line for the bumper-car ride has mean 60 pounds and standard deviation 2 pounds. Which distribution is mor
> Taking a cruise is a costly discretionary expense. In a recent year, the top five cruise lines in the world had this many passengers: 4,133,000 2,369,000 1,295,000 928,000 679,000 Round your answers to the nearest integer. a. The computations will be eas
> The Vetrone family members are all Cincinnati Reds baseball fans. They went to five games last season. The cost of each game, including parking, tickets, and food, is listed below. $266, $201, $197, $188, $162 Round your answers to the nearest cent. a. W
> An electric bill is an essential expense for young people who get their first apartment. The following is a list of Jordan’s monthly electric bills for the past 10 months. $115, $150, $144, $126, $90, $90, $95, $110, $120, $88 Round your answers to the n
> For many travelers, the cost of getting to an airport needs to be factored into the travel expense. The table at the right lists the cost of six different ways to get from the center of a major city to the nearest airport. A researcher polled travelers t
> Shannon is traveling from New York City to Washington, D.C. She wants to go by train so she can see the views. Since she will be driving home with a family member, she only priced the cost of a one-way ticket on Amtrak for any time of day on February 15.
> Suppose that two of the Deluxe Luxury rooms in the spreadsheet above were being renovated and unavailable for sale on a particular trip. Therefore, cell C6 would change from 20 to 18. a. Would all, some, or none of the values in column D change based on
> Four car rental prices were quoted for a 3-day rental. The frequencies are listed. Let x represent the frequency of the $240 price quote. Use the information shown in the chart to write algebraic expressions for the entries labeled a through&
> Maria and Don Papace are flying to Florida to explore the possibility of moving there. They will be traveling with their two teenage sons. The table below lists information they have researched on the round-trip airfares that are available for purchase o
> The variance of a distribution is 50. What is the standard deviation, rounded to the nearest thousandth?
> Use the table in problem 1 to answer these questions. a. Add a relative frequency column. Calculate the relative frequencies. Round each to the nearest thousandth. b. Which ticket prices have a relative frequency greater than 0.2 and less than 0.3? c. In
> a. How many seasonal dummy variables would be needed for the regression approach to the data in Problem 11.3? b. Do you think the approach would bring as reliable results as it did for consumers’ expenditure? Data from Problem 11.3: T
> A computer will be needed to solve this and the next problem. a. Repeat the regression equation from Problem 11.5 but add three seasonal dummy variables (for quarters 2, 3 and 4) to the regressors. (The dummy for quarter 2 takes the value 1 in Q2, 0 in t
> a. Using the data from Problem 11.3 (2004–14 only), fit a linear regression line to obtain the trend values. By how much, on average, does car production increase per year? b. Calculate the seasonal factors (multiplicative model). How d
> a. Using the data of Problem 11.1, fit a regression line through the data, using t and t2 as explanatory variables (t is a time trend 1–36). Use only the observations from 2000 to 2014. Calculate the trend values using the regression. b
> Repeat Problem 11.3 using the additive model and compare results. Data from Problem 11.3: The following data relate to car production in the United Kingdom (not seasonally adjusted). a. Graph the data for 2004–14 by overlapping the
> The following data relate to car production in the United Kingdom (not seasonally adjusted). a. Graph the data for 2004–14 by overlapping the three years (as was done in Figure 11.2) and comment upon any seasonal pattern. Figure 11.2
> Repeat the exercise using the additive model. (In Problem 11.1(c), subtract the moving average figures from the original series. In (e), subtract the seasonal factors from the original data to get the adjusted series.) Is there a big difference between t
> The following table contains data for consumers’ non-durables expenditure in the United Kingdom, in constant 2003 prices. a. Graph the series and comment upon any apparent seasonal pattern. Why might it occur? b. Use the method of centr
> Industry is always concerned about the rising price of energy. It demands to be compensated for any rise over 5% in energy prices between 2007 and 2008. How much would this compensation cost? Which price index should be used to calculate the compensation
> Construct a chain index from the following data series: What problems arise in devising such an index and how do you deal with them? 1998 2006 2000 2001 2006 2010 2008 Series 1 100 110 115 122 125 Series 2 100 107 111 119 121
> The following data give duration of unemployment by age. The ‘economically active’ column gives the total of employed (not shown) plus unemployed in each age category. a. In what sense may these figures be regarded a
> The following table shows the weights in the retail price index and the values of the index itself, for 1990 and 1994. a. Calculate the Laspeyres price index for 1994, based on 1990 = 100. b. Draw a bar chart of the expenditure weights in 1990 and 1994
> The following table shows the income distribution by quintile for the United Kingdom in 2006–7, for various definitions of income: a. Use equation (10.27) to calculate the Gini coefficient for each of the four categories of income. b.
> a. Draw a Lorenz curve and calculate the Gini coefficient for the wealth data in Table 1.3 (Chapter 1). b. Why is the Gini coefficient typically larger for wealth distributions than for income distributions? Data from Table 1.3: Table 1.3 The distr
> Calculate the internal rate of return for the project in Problem 10.13. Use either trial and error methods or a computer to solve. Data from Problem 10.13: A firm is investing in a project and wishes to receive a rate of return of at least 15% on it. T
> The following data show expenditure on the National Health Service (in cash terms), the GDP deflator, the NHS pay and prices index, population and population of working age: (In all the following answers, set your index to 1987 = 100.) a. Turn the expe
> Find the gross domestic product for both the United Kingdom and the United States for the period 1995 to 2003. Obtain both series in constant prices.
> How would you estimate a model explaining the following variables? a. airline efficiency, b. infant mortality, c. bank profits. You should consider such issues as whether to use time-series or cross-section data; the explanatory variables to use and any
> As Problem 8.7, for Data from Problem 8.7: Would it be better to use time-series or cross-section data in the following models? a. measurement of economies of scale in the production of books, b. the determinants of cinema attendances, c. the determin
> Would it be better to use time-series or cross-section data in the following models? a. the relationship between the exchange rate and the money supply b. the determinants of divorce c. the determinants of hospital costs. Explain your reasoning.
> As Problem 8.5, for Data from Problem 8.5: How would you most appropriately measure the following variables? a. the output of a car firm, in a production function equation, b. potential trade union influence in wage bargaining, c. the performance of a
> Using the data from Problem 1.6: Data from Problem 1.6: The data below show the number of enterprises in the United Kingdom in 2010, arranged according to employment: Number of employees Number of firms 1 ……………………………………………………………. 1 740 685 5 …………………
> How would you most appropriately measure the following variables? a. social class in a model of alcohol consumption b. crime c. central bank independence from political interference.
> The following data show the number of adults in each of 17 households and whether or not the family contains at least one person who smokes, to supplement the data in Problem 7.2 on alcohol spending. Data from Problem 7.2: The data below show alcohol
> In a cross-section study of the determinants of economic growth (National Bureau of Economic Research, Macroeconomic Annual, 1991), Stanley Fischer obtained the following regression equation: where GY: ……â
> R. Dornbusch and S. Fischer (in R.E. Caves and L.B. Krause, Britain’s Economic Performance, Brookings, 1980) report the following equation for predicting the UK balance of payments: where B: ...........…the curre
> As Problem 8.9, for Data from Problem 8.9: How would you estimate a model explaining the following variables? a. investment, b. the pattern of UK exports (i.e. which countries they go to), c. attendance at football matches.
> a. Using the data in Problem 7.1 (page 301), estimate a multiple regression model of the birth rate explained by GNP, the growth rate and the income ratio. Comment upon: (i) the sizes and signs of the coefficients, (ii) the significance of the coefficien
> From your results for the birth rate model, predict the birth rate for a country with either (a). GNP equal to $3000, (b). a growth rate of 3% p.a., or (c). an income ratio of 7. How does your prediction compare with one using Todaro’s results? Comme
> a. For the data given in Problem 7.2, estimate the sample regression line and calculate the R2 statistic. Comment upon the results. Problem 7.2: The data below show alcohol expenditure and income (both in £s per week) for a sample of 17 fa
> a. For the data in Problem 7.1, find the estimated regression line and calculate the R2 statistic. Comment upon the result. How does it compare with Todaro’s findings? b. Calculate the standard error of the estimate and the standard err
> As Problem 7.3, for Data from Problem 7.3: What would you expect to be the correlation coefficient between the following variables? Should the variables be measured contemporaneously or might there be a lag in the effect of one upon the other? (a) real
> Using the data from Problem 1.5: Data from Problem 1.5: The distribution of marketable wealth in 1979 in the United Kingdom is shown in the table below (adapted from Inland Revenue Statistics, 1981, contains public sector information licensed under the
> What would you expect to be the correlation coefficient between the following variables? Should the variables be measured contemporaneously or might there be a lag in the effect of one upon the other? a. Nominal consumption and nominal income. b. GDP and
> Update Todaro’s study using more recent data.
> The other data which Todaro might have used to analyse the birth rate were: For one of the three possible explanatory variables (in class, different groups could examine each of the variables): a. Draw an XY chart of the data above and comment upon the
> a. Do the accountants’ job properly for them (see the Oops! box in the text (page 244)). b. It might be justifiable to omit the ‘no responses’ entirely from the calculation. What happens if you do thi
> Four different holiday firms which all carried equal numbers of holidaymakers reported the following numbers who expressed satisfaction with their holiday: Is there any significant difference between the firms? If told that the four firms carried 600 h
> A survey of 64 families with five children found the following gender distribution: Test whether the distribution can be adequately modelled by the Binomial distribution. Number of boys 1 3 4 Number of families 8 28 19 4 4
> Groups of children from four different classes in a school were randomly selected and sat a test, with the following test scores: a. Test whether there is any difference between the classes, using the 95% confidence level for the test. b. How would you
> A sample of 40 observations has a standard deviation of 20. Estimate the 95% confidence interval for the standard deviation of the population.
> A firm receives components from a supplier, which it uses in its own production. The components are delivered in batches of 2000. The supplier claims that there are only 1% defective components on average from its production. However, production occasion
> Given a standard pack of cards, calculate the following probabilities: a. drawing an ace; b. drawing a court card (i.e. jack, queen or king); c. drawing a red card; d. drawing three aces without replacement; e. drawing three aces with replacement.
> A coin which is either fair or has two heads is to be tossed twice. You decide on the following decision rule: if two heads occur you will conclude it is a two-headed coin, otherwise you will presume it is fair. Write down the null and alternative hypoth
> Can your class tell the difference between tap water and bottled water? Set up an experiment as follows: fill r glasses with tap water and n - r glasses with bottled water. The subject has to guess which is which. If he or she gets more than p correct, y
> Discuss in general terms how you might ‘test’ the following: a. astrology b. extra-sensory perception c. the proposition that company takeovers increase profits.
> Another group of workers were tested at the same times as those in Problem 5.23, although their department also introduced rest breaks into the working day. Does the introduction of rest days alone appear to improve performance? Problem 5.23: The out
> The output of a group of 11 workers before and after an improvement in the lighting in their factory is as follows: Test whether there is a significant improvement in performance a. assuming these are independent samples, b. assuming they are dependent
> a. A pharmaceutical company testing a new type of pain reliever administered the drug to 30 volunteers experiencing pain. Sixteen of them said that it eased their pain. Does this evidence support the claim that the drug is effective in combating pain? b.
> a. A random sample of 180 men who took the driving test found that 103 passed. A similar sample of 225 women found that 105 passed. Test whether pass rates are the same for men and women. b. If you test whether the group of people who passed the driving
> Given the two hypotheses and σ2 = 1000 (for both hypotheses): a. Draw the distribution of x under both hypotheses. b. If the decision rule is chosen to be: reject H0 if x > 410 from a sample of size 40, find the probability of a Type II
> Answer true or false, with reasons if necessary. a. There is no way of reducing the probability of a Type I error without simultaneously increasing the probability of a Type II error. b. The probability of a Type I error is associated with an area under
> a. A sample of 954 adults in early 1987 found that 23% of them held shares. Given a UK adult population of 41 million and assuming a proper random sample was taken, find the 95% confidence interval estimate for the number of shareholders in the United Ki
> The distribution of marketable wealth in 1979 in the United Kingdom is shown in the table below (adapted from Inland Revenue Statistics, 1981, contains public sector information licensed under the Open Government Licence (OGL) v3.0, http://www.nationalar
> a. A sample of 200 women from the labour force found an average wage of £26 000 p.a. with standard deviation £3500. A sample of 100 men found an average wage of £28 000 with standard deviation £2500. Es
> A firm receives components from a supplier in large batches, for use in its production process. Production is uneconomic if a batch containing 10% or more defective components is used. The firm checks the quality of each incoming batch by taking a sample
> If the probability of a boy in a single birth is 1 2 and is independent of the sex of previous babies, then the number of boys in a family of 10 children follows a Binomial distribution with mean 5 and variance 2.5. In each of the following instances,
> A report in The Guardian newspaper (20 June 2010, http://www.guardian.co.uk/education/ 2010/jun/20/internet-plagiarism-rising-in-schools) reports ‘Half of university students also prepared to submit essays bought off the internet, according to research.’
> Using a weekend’s football results from the Premier (or other) League, see if the number of goals per game can be adequately modelled by a Poisson process. First calculate the average number of goals per game for the whole league, and then derive the dis
> An extremely numerate newsagent (with a spreadsheet program, as you will need) is trying to work out how many copies of a newspaper he should order. The cost to him per copy is 40 pence, which he then sells at £1.20. Sales are distributed No
> An experienced invoice clerk makes an error once in every 100 invoices, on average. (a) What is the probability of finding a batch of 100 invoices without error? (b) What is the probability of finding such a batch with more than two errors? Calculate the
> A machine producing electronic circuits has an average failure rate of 15% (they are difficult to make). The cost of making a batch of 500 circuits is £8400 and the good ones sell for £20 each. What is the probability of the firm making a loss on any one
> Two dice are thrown and the absolute difference of the two scores is recorded. Graph the resulting probability distribution and calculate its mean and variance. What is the probability that the absolute difference is 4 or more?
> Ten adults are selected at random from the population and their IQ measured. (Assume a population mean of 100 and standard deviation of 16 as in Problem 3.16.) (a) What is the probability distribution of the sample average IQ? (b) What is the probability
> Using the data from Problem 1.2: Data from Problem 1.2: The data below show the average hourly earnings (in £s) of those in full-time employment, by category of education (NVQ levels. NVQ 4 corresponds to a university degree). a. What is
> Two dice are thrown and the sum of the two scores is recorded. Draw a graph of the resulting probability distribution of the sum and calculate its mean and variance. What is the probability that the sum is 9 or greater?
> A news item revealed that a London ‘gender’ clinic (which reportedly enables you to choose the sex of your child) had just set up in business. Of its first six births, two were of the ‘wrong’ sex. Assess this from a probability point of view.
> Judy is 33, unmarried and assertive. She is a graduate in political science, and involved in union activities and anti-discrimination movements. Which of the following statements do you think is more probable? a. Judy is a bank clerk. b. Judy is a bank c
> How might you estimate the probability of Peru defaulting on its debt repayments next year? What type of probability estimate is this?
> a. Translate the following odds to ‘probabilities’: 13/8, 2/1 on, 100/30. b. In the 2.45 race at Plumpton the odds for the five runners were: Philips Woody…………………………………1/1 Gallant Effort………………………………….5/2 Satin Noir………………………………………11/2 Victory Anthem……………
> This problem is tricky, but amusing. Three gunmen, A, B and C, are shooting at each other. The probabilities that each will hit what they aim at are 1, 0.75 and 0.5, respectively. They take it in turns to shoot (in alphabetical order) and continue until
> A man is mugged and claims that the mugger had red hair. In police investigations of such cases, the victim was able correctly to identify the assailant’s hair colour 80% of the time. Assuming that 10% of the population have red hair, what is the probabi
> a. Your initial belief is that a defendant in a court case is guilty with probability 0.5. A witness comes forward claiming he saw the defendant commit the crime. You know the witness is not totally reliable and tells the truth with probability p. Use Ba
> The UK national lottery originally worked as follows. You choose six (different) numbers in the range 1 to 49. If all six come up in the draw (in any order), you win the first prize, generally valued at around £2m (which could be shared if s
> An important numerical calculation on a spacecraft is carried out independently by three computers. If all arrive at the same answer, it is deemed correct. If one disagrees, it is overruled. If there is no agreement, then a fourth computer does the calcu
> Odds’ in horserace betting are defined as follows: 3/1 (three-to-one against) means a horse is expected to win once for every three times it loses; 3/2 means two wins out of five races; 4/5 (five to four on) means five wins for every four defeats, etc. a
> Which of the following events are independent? a. A student getting the first two questions correct in a multiple-choice exam. b. A driver having an accident in successive years. c. IBM and Dell earning positive profits next year. d. Arsenal Football Clu
> Roll six sixes to win a Mercedes!’ is the announcement at a fair. You have to roll six dice. If you get six sixes you win the car, valued at £40 000. The entry ticket costs £1. What is your expected gain or loss on this game? If there are 400 people who
> The BMAT test (see http://www.ucl.ac.uk/lapt/bmat/) is an on-line test for prospective medical students. It uses ‘certainty-based marking’. After choosing your answer from the alternatives available, you then have to give your level of confidence that yo
> Criticise the following statistical reasoning. Amongst arts graduates, 10% fail to find employment. Amongst science graduates only 8% remain out of work. Therefore, science graduates are better than arts graduates. Hint: imagine there are two types of jo
> There are 25 people at a party. What is the probability that there are at least two with a birthday in common? They do not need to have been born in the same year, just the same day and month of the year. Also, ignore leap year dates. (Hint: the compleme
> A firm can build a small, medium or large factory, with anticipated profits from each dependent upon the state of demand, as in the table below. a. Which project should be chosen on the expected value criterion? b. Which project should be chosen on the
> A firm has a choice of three projects, with profits as indicated below, dependent upon the state of demand. a. Which project should be chosen on the expected value criterion? b. Which project should be chosen on the maximin and maximax criteria? c. Whi
> A bond is issued which promises to pay £400 p.a. in perpetuity. How much is the bond worth now, if the interest rate is 5%? (Hint: the sum of an infinite series of the form is 1/r, as long as r > 0.) 1 1 + 1 +r (1 + r)? (1 + r)}
> Find the anti-log of the following values: -0.09 691, 2.3, 3.3, 6.3.

