Question: The decline in our profits has become
The decline in our profits has become intolerable. The severe price cutting in pumps has dropped our pre-tax margin to less than 2%, far below our historical 15% margins. Fortunately, our competitors are overlooking the opportunities for profit in flow controllers. Our recent 10% price increase in that line has been implemented without losing any business.
Robert Parker, President of Sippican Corporation
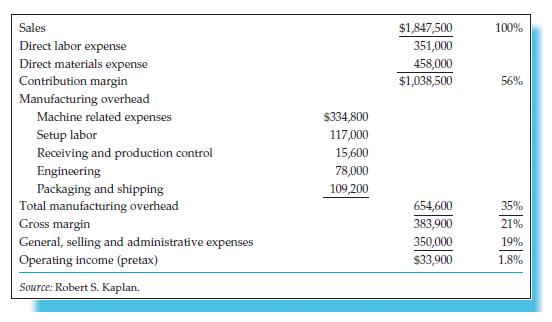
Robert Parker was discussing operating results in the latest month with Peggy Knight, his controller, and John Scott, his manufacturing manager. The meeting among the three was taking place in an atmosphere tinged with apprehension because competitors had been reducing prices on pumps, Sippican’s major product line. Since pumps were a commodity product, Parker had seen no alternative but to match the reduced prices to maintain volume. But the price cuts had led to declining company profits, especially in the pump line (summary operating results for the previous month, March 2006, are shown in Exhibits 5-8 and 5-9).

Sippican supplied products to manufacturers of water purification equipment. The company had started with a unique design for valves that it could produce to tolerances that were better than any in the industry. Parker quickly established a loyal customer base because of the high quality of its manufactured valves. He and Scott realized that Sippican’s existing labor skills and machining equipment could also be used to produce pumps and flow controllers, products that were also purchased by its customers. They soon established a major presence in the high-volume pump product line and the more customized flow controller line.
Sippican’s production process started with the purchase of semifinished components from several suppliers. It machined these parts to the required tolerances and assembled them in the company’s modern manufacturing facility. The same equipment and labor were used for all three product lines, and production runs were scheduled to match customer shipping requirements. Suppliers and customers had agreed to just-in-time deliveries, and products were packed and shipped as completed.
Valves were produced by assembling four different machined components. Scott had designed machines that held components in fixtures so that they could be machined automatically. The valves were standard products and could be produced and shipped in large lots. Although Scott felt several competitors could now match Parker’s quality in valves, none had tried to gain market share by cutting price, and gross margins had been maintained at a standard 35%.
The manufacturing process for pumps was practically identical to that for valves. Five components were machined and then assembled into the final product. The pumps were shipped to industrial product distributors after assembly. Recently, it seemed as if each month brought new reports of reduced prices for pumps. Sippican had matched the lower prices so that it would not give up its place as a major pump supplier. Gross margins on pump sales in the latest month had fallen to about 5%, well below the company’s planned gross margin of 35%.
Flow controllers were devices that controlled the rate and direction of flow of chemicals. They required more components and more labor, than pumps or valves, for each finished unit. Also, there was much more variety in the types of flow controllers used in industry, so many more production runs and shipments were performed for this product line than for valves. Sippican had recently raised flow controller prices by more than 10% with no apparent effect on demand.
Sippican had always used a simple cost accounting system. Each unit of product was charged for direct material and labor cost. Material cost was based on the prices paid for components under annual purchasing agreements. Labor rates, including fringe benefits, were $32.50 per hour,11 and were charged

To products based on the standard run times for each product (see Exhibit 5-10). The company had only one producing department, in which components were both machined and assembled into finished products. The overhead costs in this department were allocated to products as a percentage of production-run direct labor cost. Currently, the rate was 185%. Since direct labor cost had to be recorded anyway to prepare factory payroll, this was an inexpensive way to allocate overhead costs to products.
Knight noted that some companies did not allocate any overhead costs to products, treating them as period, not product, expenses. For these companies, product profitability was measured at the contribution margin level—price less all variable costs. Sippican’s variable costs were only its direct material and direct labor costs. On that basis, all products, including pumps, would be generating substantial contribution to overhead and profits. She thought that perhaps some of
Sippican’s competitors were following this procedure and pricing to cover variable costs.
Knight had recently led a small task force to study Sippican’s overhead costs since they had now become much larger than the direct labor expenses. The study had revealed the following information:
1. A setup had to be performed each time a batch of components had to be machined in a production run. Each component in a product required a separate production machine to run the raw material or purchased part to the specifications for the product. Workers often operated several of the machines simultaneously once they had set up the machine. Because of the large number of setups, Sippican had dedicated about 25% of its production workforce to focus exclusively on setups. Some production workers did not operate any machines; they performed only manual assembly work. Their assembly time per product was included in the direct labor hour estimates for each product.
Sippican operated two 71â„2-hour shifts each weekday. Each shift employed 45 production and assembly workers, plus 15 setup workers. Workers received two 15-minute breaks each day. They received an average of 30 minutes per day for training and education activities, and all workers—production, assembly, and setup—spent 30 minutes each shift on doing preventive maintenance and minor repairs to the machines.
2. The company had 62 machines for component processing. These machines were generally available for the six hours per shift that production workers were actively engaged in production or setup activities on the machines. Sippican leased the machines. Each machine’s operating expenses were about $5,400 per month, including lease payments, supplies, utilities, and maintenance and repairs.
3. The receiving and production control departments employed four people over the two shifts. These personnel ordered, processed, inspected, and moved each batch of components for a production run. It took a total of 75 minutes for all of the activities required to get one batch of components ordered, received, and moved to a machine for processing. This time was independent of whether the components were for a long or a short production run, or whether the components were expensive or inexpensive.
4. The work in the packaging and shipping area had increased during the past couple of years as Sippican increased the number of customers it served. Each shipment took 50 minutes to prepare the packages and labels, independent of the number or types of items in the shipment, plus 8 minutes per item to bubble wrap and pack in the carton, whether the item was a valve, pump, or flow controller. The packaging and shipping area employed 14 people in each of the two shifts (28 in total).
Employees in the receiving, production control, packaging, and shipping departments worked a 71â„2-hour shift that included two 15-minute breaks per day, and 30 minutes, on average, for training and education.
5. Sippican employed eight engineers for designing and developing new product varieties. Engineers’ total compensation was $9,750 per month. Much of their time was spent modifying flow control products to conform to customer requests. Engineers worked 71â„2-hour shifts. After breaks, training, education, and professional activities, engineers supplied about 6 hours of productive work per shift.
Knight’s team had collected the data shown in Exhibit 5-11 based on operations in March 2006.
The team felt that this month was typical of ongoing operations.
Required
(a) Calculate the practical capacity and the capacity cost rates for each of Towerton’s personnel resources: brokers, account managers, financial planners, principals, and customer service representatives.
(b) Calculate the practical capacity and the capacity cost rates for each of Sippican’s resources: production and setup employees, machines, receiving and production control employees, shipping and packaging employees, and engineers.
(c) Using these capacity cost rates and the production data in Exhibits 5-10 and 5-11, calculate revised costs and profits for Sippican’s three product lines. What difference does your cost assignment have on reported product costs and profitability? What causes any shifts in cost and profitability?
(d) Could this approach be extended to service companies and to companies much larger and more complex than Sippican? What would be the barriers and difficulties with implementing time-driven ABC in practice?
(e) On the basis of the revised cost and profitability estimates, what actions should Sippican’s management team take to improve the company’s profitability?
Transcribed Image Text:
> Regarding the quality costing categories, how do prevention costs differ from appraisal costs? How do internal failure costs differ from external failure costs?
> How would you classify the layout of a large grocery store? Why do you think it is laid out this way? Can you think of any way to improve the layout of a conventional grocery store? Explain your reasoning. (Hint: Think about JIT, cycle time, and so on.)
> SMY Corporation produces 60,000 videophones per year. The company estimates its direct material costs for the videophone to be $300 per unit and its conversion (direct labor plus support) costs to be $400 per unit. Annual inventory carrying costs, not in
> Boris Company introduced JIT manufacturing last year and has prepared the following data to assess the benefits from the change: Inventory financing costs are 12% per year. Support costs are based on a time-driven activity-based costing analysis. Estima
> Kwik Clean handles both commercial laundry and individual customer dry cleaning. Kwik Clean’s current dry cleaning process involves emitting a pollutant into the air. In addition, the commercial laundry and dry cleaning processes produce sediments and ot
> Johnson & Johnson (www.jnj.com), a major health care and pharmaceutical firm, voluntarily recalled a number of its products in 2010 because of quality problems. These products included hip-repair implants, contact lenses, and over-the-counter medications
> For each of the four steps of the plan–do–check–act cycle, describe examples of possible uses of management accounting information.
> Some firms in the fashion industry have adopted lean or just-in-time approaches to maintain or increase their competitive advantage. Read the following articles or other resources to address the questions below: “Brand-New Bag: Louis Vuitton Tries Modern
> Woodpoint Furniture Manufacturing produces various lines of pine furniture. The plant is organized so that all similar functions are performed in one area, as shown in Exhibit 7-17. Most pieces of furniture are made in batches of 10 units. Raw materials
> Precision Systems, Inc. (PSI).1 Precision Systems, Inc. (PSI) has been in business for more than 40 years and has generally reported a positive net income. The company manufactures and sells high-technology instruments (systems). Each product line at PSI
> Rossman Instruments, Inc., is considering leasing new state-of-the-art machinery at an annual cost of $900,000. The new machinery has a fouryear expected life. It will replace existing machinery leased one year earlier at an annual lease cost of $490,000
> Daniel Morris purchased a 42-inch plasma television, manufactured by TVCO, from a local electronics store that permits customers to return defective products within 30 days of purchase. Approximately 45 days after Daniel’s purchase, the TV began to malfu
> Why might customer retention rate be a poor measure of customer loyalty?
> What does a pricing waterfall chart depict?
> “Companies should avoid high cost-to-serve customers because they are unprofitable.” Do you agree with this statement? Explain.
> Why are nonfinancial measures alone insufficient for managing relationships with customers?
> Consider the descriptions of management accounting provided in the chapter. Discuss why the associated responsibilities are viewed as “accounting” and how people handling those responsibilities interface with other functional areas in fulfilling the stat
> What is the net promoter score and why is it recommended for use by companies?
> List and describe the five stages of a hierarchy for categorizing customer satisfaction and loyalty. Which companies that you know or deal with as a consumer create the highest form of loyalty for you?
> Provide three reasons why customer loyalty provides benefits to companies.
> “The only nonfinancial measure for customer relationships that our company should focus on is customer satisfaction.” Do you agree with this statement? Explain.
> What insights can life-cycle profitability analysis provide about customer profitability and the desirability of various customer groups?
> How might the structure of salespersons’ incentives or compensation plans contribute to unprofitable customer relationships?
> What are four broad groups of actions that managers might use to transform unprofitable customers into profitable ones?
> Provide an example of how customers may use a specific company’s resources or services very differently.
> Why must service companies, even more so than manufacturing companies, focus on customer costs and profitability?
> What is the typical shape of a graph of cumulative profits versus percentage of customers ranked from most profitable to least profitable?
> What are the two essential financial elements needed to arrive at a target cost?
> Kronecker Company, a growing mail-order clothing and accessory company, is concerned about its growing MSDA expenses. It therefore examined its customer ordering patterns for the past year and identified four different types of customers, as illustrated
> In which industries would you expect the net promoter score to have the greatest predictive power for repeat purchases and growth? The least predictive power for repeat purchases and growth?
> KEM Company has begun studying customer lifetime value for its customers and has prepared the information below for selected customers. For simplicity, management has assumed that for a given customer, the retention rate is the same every year until the
> Randolph Company’s product mix has become more diverse over the past few years. Consequently the company undertook an activity-based costing initiative to develop accurate costs for production, as well as marketing, selling, distributio
> Write an essay to explain how the 80–20 graph for sales revenues would be prepared and describe typical findings with respect to proportions of products and customers generating percentages of sales. Also, describe how a whale curve is prepared and typic
> Hampstead Company’s order entry department has 20 order entry operators. The cost associated with these 20 operators (salaries, fringe benefits, and supervision, as well as occupancy and equipment costs) is $873,600 per year. After taking into ac
> Saunders Company has recently become aware of the large total discounts on its orders and would like to know the impact on profit. The company computed its operating profit as follows: Required (a) Suppose Saunders could reduce its sales discounts to p
> Refer to the pricing waterfall chart in Exhibit 6-4. Required (a) What circumstances result in firms often failing to be aware of all of the discounts and allowances granted on a customer order? (b) Once a firm becomes aware of pricing waterfalls leadin
> For each of the categories below, provide a specific example of how a company might transform its breakeven or loss customers into profitable ones: a. Process improvements b. Activity-based (menu-based) pricing c. Managed customer relationships d. Discip
> Wright Company, a new systems consulting company, is concerned about the profitability of its customers during the past year. The company has prepared the following data: Required (a) Prepare a whale curve, as described in this chapter. (b) What percen
> Consider the operation of a fast-food company with hundreds of retail outlets scattered about the country. Consider the descriptions of management accounting provided in the chapter to identify management accounting information needs for the following: a
> Tetra Company’s cost system assigns MSDA expenses to customers using a rate of 33% of sales revenue. The new controller has discovered that Tetra’s customers differ greatly in their ordering patterns and interaction w
> Stan’s, a department store chain, has conducted a survey to collect data on customer satisfaction and perception of its merchandise and service. Data for responses to the question “How likely is it that you would recom
> Compute the customer lifetime value for Customer 421 based on the data below for the first six years of the customer relationship. Costs (ct) were incurred to promote customer retention to a rate of 0.8 in years 1 through 6.
> In response to how the sales incentives might be contributing to falling profits despite growing sales, Chan Company’s controller has produced the following information on last year’s sales to two customers that purcha
> Read the Wall Street Journal article “Survival Strategies: After Cost Cutting, Companies Turn toward Price Increases” by Timothy Aeppel (September 18, 2002, p. A1). The article reports “an all-out search for new ways to charge more money without raising
> Why might an organization not experience financial improvement even after using activity-based costing to identify and take action on promising opportunities for process improvements and cost reductions?
> Why do companies producing a varied and complex mix of products have higher costs than companies producing only a narrow range of products?
> “When a company produces both high volume products and low-volume products, traditional product costing systems are likely to over cost high-volume products.” Do you agree with this statement? Explain.
> Under what two conditions are volume based traditional product costing systems most likely to distort product costs? How do activity-based costing systems provide more accurate costs when these two conditions hold?
> Why are traditional volume-based cost allocation systems likely to systematically distort product costs?
> What advantages does time-driven ABC have over original activity-based costing?
> Why might individuals resist implementation of activity-based costing?
> What are some special considerations in the design of cost accounting systems for service organizations?
> Why are service organizations often ideally suited for activity-based costing?
> Why is practical capacity recommended in calculating capacity cost rates?
> How the information from an activity can based costing system guide improvements in operations and decisions about products and customers?
> What two sets of parameters must be estimated in time-driven ABC?
> How is a time-driven ABC system updated as resource costs increase or changes in operations occur?
> Riverdale Bone and Joint Surgery specializes in treating injuries related to bones and joints, as well as surgeries such as knee replacements and hip replacements. In addition to performing surgeries, Riverdale offers post-operation treatment. Riverdale
> Garber Company uses a traditional activity-based costing system to assign $600,000 of committed resource costs for customer service on the basis of the following information gathered from interviews with customer service personnel: Required (a) Compute
> For each of the following products, suggest three measures of quality: a. Television set b. University course c. Meal in an exclusive restaurant d. Carryout meal from a restaurant e. Container of milk f. Visit to the doctor g. Trip on an airplane h. Pair
> XZ Discount Brokerage is trying to determine the cost of supplying computing resources in order to determine how much to charge for trades. The company’s cost analyst is perplexed because XZ has acquired 80 servers to meet peak capacity needs, which occu
> Suppose an organization has not implemented either activity-based costing or a Balanced Scorecard but believes both would be valuable for the organization. However, management is currently willing to undertake only one major change initiative. Advise man
> Explain how an activity-based costing model can be linked to a Balanced Scorecard approach.
> Refer to the time-driven ABC analysis of forecasting resource capacity for the Madison Dairy ice cream plant example on pages 181–184 of this chapter. Suppose that all the information is the same except for the following: Required (a)
> CAN Company sells multiple products and uses a time-driven ABC system. The company’s products must be wrapped individually before shipping. The packaging and shipping department employs 24 people. Each person works 20 days per month on average. Employees
> Zeta Department Store has developed the following information in order to develop a time driven ABC model for its Accounts Receivable Department: The time to process payments of customer invoices depends on whether the customer pays the bill manually or
> (Adapted from CMA, June 1992) Alaire Corporation manufactures several different types of printed-circuit boards; however, two of the boards account for the majority of the company’s sales. The first of these boards, a TV circuit board,
> The Manhattan Company manufactures two models of compact disc players: a deluxe model and a regular model. The company has manufactured the regular model for years; the deluxe model was introduced recently to tap a new segment of the market. Since the in
> At its manufacturing plant in Duluth, Minnesota, Endo Electronics Company manufactures two products, X21 and Y37. For many years, the company has used a simple plant wide manufacturing support cost rate based on direct labor hours. A new plant accountant
> Smithers, Inc., manufactures and sells a wide variety of consumer products. The products are viewed as sufficiently profitable, but recently some product-line managers have complained about the charges for the call center that handles phone calls from cu
> Organizations in the public and nonprofit sector, such as government agencies and charitable social service entities, have financial systems that budget expenses and monitor and control actual spending. Explain why these organizations should consider dev
> (Adapted from CMA, December 1990) Moss Manufacturing has just completed a major change in its quality control (QC) process. Previously, products had been reviewed by QC inspectors at the end of each major process, and the company’s 10 Q
> Refer to the time-driven ABC analysis of the Madison Dairy ice cream plant example in the chapter. Required (a) Suppose indirect labor costs have increased by 10% from the original setting but all other information remains the same. Determine the total
> Potter Corporation has gained considerable market share in recent years for its specialty, low volume, complex line of products, but the gain has been offset by a loss in market share for its high-volume, simple line of products. This has resulted in a n
> Ken’s Cornerspot, a popular university eatery in a competitive market, has seating and staff capacity to serve about 600 lunch customers every day. For the past two months, demand has fallen from its previous near-capacity level. Concerned about his decl
> Halifax Brass Company manufactures pumps and valves and uses a time-driven activity-based cost (TDABC) system. Last year, Halifax recorded the following data for assigning manufacturing overhead costs to its products: Halifax also developed the followin
> The mayor of Gotham City is dissatisfied with the rising costs and deteriorating quality of the services provided by the city’s municipal workers, particularly in the transportation department: paving roads, repairing potholes, and cleaning the streets.
> Consider the case of the Cott Corporation, a Canadian private-label producer of high-quality cola beverages. Cott is attempting to get grocery retailers to stock its cola beverages as a lower price alternative to the more well-known brands of Coca-Cola a
> An article in the Wall Street Journal by Neal Templin and Joseph B. White (June 23, 1993) reported on the major changes occurring at General Motors. Its new chief executive officer, John Smith, had been installed after the board of directors requested th
> Towerton Financial Services13 Towerton Financial Services, a brokerage firm, started with a focus on stock trading and mutual funds. As the business grew, Towerton diversified into two new product lines, investment account management and financial plann
> Sippican Corporation (B)12 Refer to Case 5-36, the Sippican Corporation (A) case, which required time-drivenABC analysis. Sippican’s senior executive committee met to consider the implications from its time-driven ABC model. Frankly al
> The manager of a large semiconductor production department expressed his disdain for the cost information he was presently given: Cost variances are useless to me.2 I don’t want to ever have to look at a cost variance, monthly or weekly. Daily, I look at
> The Redwood City plant of Crimson Components Company makes two types of rotators for automobile engines: R361 and R572. The old cost accounting system at the plant traced support costs to four cost pools: Pool S1 included service activity costs related
> How is overhead cost estimated for individual jobs?
> How are indirect cost rates determined?
> What are predetermined indirect cost rates commonly called in practice?
> Provide several examples of cost objects.
> What does the term conversion costs mean?
> What are indirect cost pools?
> Define direct cost and indirect cost and provide an example of each.
> Compare the defining characteristic and cost behavior of a consumable (flexible) resource to those of a capacity-related resource.
> How do the cost flows in a retail organization or service organization differ from those in a manufacturing organization?
> Refer to the Madison Dairy ice cream plant example described in this chapter. Required (a) Suppose that production-related computer resource expenses of $18,000 per month have been inadvertently overlooked for inclusion in the cost system. Explain how t
> Describe the flow of costs from raw materials to cost of goods sold in a manufacturing organization.
> (Appendix) What is the difference between production departments and service departments?
> What are the similarities and differences between job order costing and multistage process costing systems?
> What is the basic procedure for determining product costs in continuous processing plants?
> How is practical capacity computed for machines and labor?
> How might computing the cost driver rate by using the planned level of the cost driver lead to a death spiral?
> What are the three options for dealing with the difference between actual and applied capacity (overhead) costs?

