Question: Use the data to a. find the
Use the data to
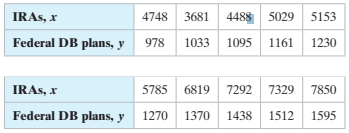
a. find the coefficient of determination r2 and interpret the result, and
b. find the standard error of estimate se and interpret the result
The table shows the total assets (in billions of dollars) of individual retirement accounts (IRAs) and federal defined benefit (DB) plans for ten years. The equation of the regression line is y Ì‚= 0.140x + 453.959.
Transcribed Image Text:
IRAS, x 4748 3681 4488 5029 5153 Federal DB plans, y 978 1033 1095 1161 1230 IRAS, x 5785 6819 7292 7329 7850 Federal DB plans, y 1270 1370 1438 1512 1595
> A random sample of 400 voters in a certain city are asked if they favor an additional 4% gasoline sales tax to provide badly needed revenues for street repairs. If more than 220 but fewer than 260 favor the sales tax, we shall conclude that 60% of the vo
> Repeat Exercise 10.8 but assume that 70 patients are given the mussel extract and the critical region is defined to be x < 24, where x is the number of osteoarthritic patients who receive relief. Exercise 10.8: In Relief from Arthritis published by Thor
> Repeat Exercise 10.9 but assume that 100 spots are treated and the critical region is defined to be x > 82, where x is the number of spots removed. Exercise 10.9: A dry cleaning establishment claims that a new spot remover will remove more than 70% of t
> Suppose that an allergist wishes to test the hypothesis that at least 30% of the public is allergic to some cheese products. Explain how the allergist could commit (a) a type I error; (b) a type II error.
> z-Value for Testing p1−p2 = d0: To test the null hypothesis H0 that p1−p2 = d0, where d0 ≠0, we base our decision on which is a value of a random variable whose distribution approximates the standa
> Studies show that the concentration of PCBs is much higher in malignant breast tissue than in normal breast tissue. If a study of 50 women with breast cancer reveals an average PCB concentration of 22.8 × 10⁻⁴ gram, with a standard deviation of 4.8 × 10−
> The thrust of an engine (y) is a function of exhaust temperature (x) in â—¦ F when other important variables are held constant. Consider the following data. (a) Plot the data. (b) Fit a simple linear regression to the data and plot th
> The following data show the numbers of defects in 100,000 lines of code in a particular type of software program developed in the United States and Japan. Is there enough evidence to claim that there is a significant difference between the programs devel
> In a study conducted by the Water Resources Center and analyzed by the Statistics Consulting Center at Virginia Tech, two different wastewater treatment plants are compared. Plant A is located where the median household income is below $22,000 a year, an
> In a study conducted by the Department of Mechanical Engineering and analyzed by the Statistics Consulting Center at Virginia Tech, steel rods supplied by two different companies were compared. Ten sample springs were made out of the steel rods supplied
> A study was conducted at the Department of Health and Physical Education at Virginia Tech to determine if 8 weeks of training truly reduces the cholesterol levels of the participants. A treatment group consisting of 15 people was given lectures twice a w
> A study was conducted at the Virginia-Maryland Regional College of Veterinary Medicine Equine Center to determine if the performance of a certain type of surgery on young horses had any effect on certain kinds of blood cell types in the animal. Fluid sam
> A study was made to determine whether there is a difference between the proportions of parents in the states of Maryland (MD), Virginia (VA), Georgia (GA), and Alabama (AL) who favor placing Bibles in the elementary schools. The responses of 100 parents
> If one can containing 500 nuts is selected at random from each of three different distributors of mixed nuts and there are, respectively, 345, 313, and 359 peanuts in each of the cans, can we conclude at the 0.01 level of significance that the mixed nut
> State the null and alternative hypotheses to be used in testing the following claims, and determine generally where the critical region is located: (a) At most, 20% of next year’s wheat crop will be exported to the Soviet Union. (b) On the average, Ameri
> In a study analyzed by the Statistics Consulting Center at Virginia Tech, a group of subjects was asked to complete a certain task on the computer. The response measured was the time to completion. The purpose of the experiment was to test a set of facil
> Consider the situation of Exercise 10.54 on page 360. Oxygen consumption in mL/kg/min, was also measured. It is conjectured that oxygen consumption should be higher in an environment relatively free of CO. Do a significance test and discuss the conject
> The following data are the selling prices z of a certain make and model of used car w years old. Fit a curve of the form μz|w = γδw by means of the nonlinear sample regression equation ˆz = cdw. w (
> A study was conducted at Virginia Tech to determine if certain static arm-strength measures have an influence on the “dynamic lift” characteristics of an individual. Twenty-five individuals were subjected to strength t
> The equation used to predict the net sales (in millions of dollars) for a fiscal year for a clothing retailer is y = 23,769 + 9.18x1 - 8.41x2 where x1 is the number of stores open at the end of the fiscal year and x2 is the average square footage per sto
> Use the data to a. find the coefficient of determination r2 and interpret the result, and b. find the standard error of estimate se and interpret the result The table shows the percentage of employment in STEM (science, technology, engineering, and mat
> Use the data to a. find the coefficient of determination r2 and interpret the result, and b. find the standard error of estimate se and interpret the result The table shows the heights (in feet) and trunk diameters (in inches) of eight trees. The equat
> Use the data to a. find the coefficient of determination r2 and interpret the result, and b. find the standard error of estimate se and interpret the result The table shows the number of goals allowed and the total points earned (2 points for a win and
> Use the data to a. find the coefficient of determination r2 and interpret the result, and b. find the standard error of estimate se and interpret the result The table shows the median annual earnings (in dollars) of male and female workers from 10 stat
> Use the data to a. find the coefficient of determination r2 and interpret the result, and b. find the standard error of estimate se and interpret the result The numbers of initial public offerings of stock issued and the total proceeds of these offeri
> Match the description in the left column with its symbol(s) in the right column. The y-value of a data point corresponding to xi a. y ̂i b. yi c. b d. (x, y) e. m f. y
> Use the multiple regression equation to predict the y-values for the values of the independent variables. An equation that can be used to predict fuel economy (in miles per gallon) for automobiles is y ̂= 41.3 - 0.004x1 - 0.0049x2 where x1 is the engine
> Match the regression equation with the appropriate graph. y Ì‚= -0.705x + 27.214 а. b. 30 30 25 25 20 20 15 15 10 10 5 5 +++++ ++x 5 10 15 20 25 30 35 40 + 2 4 6 8 10 C. d. y 140 70- 120 60 100 50 80 40 60 30 40 20 20- 10 10 20 30 40 50 5
> Use the data to a. find the coefficient of determination r2 and interpret the result, and b. find the standard error of estimate se and interpret the result. The table shows the cooking areas (in square inches) of 18 gas grills and their prices (in dol
> Use the data to a. find the coefficient of determination r2 and interpret the result, and b. find the standard error of estimate se and interpret the result. The table shows the combined city and highway fuel efficiency (in miles per gallon gasoline eq
> Match the regression equation with the appropriate graph. y Ì‚= 2.125x + 9.588 а. b. 30 30 25 25 20 20 15 15 10 10 5 5 +++++ ++x 5 10 15 20 25 30 35 40 + 2 4 6 8 10 C. d. y 140 70- 120 60 100 50 80 40 60 30 40 20 20- 10 10 20 30 40 50 5 1
> Match the regression equation with the appropriate graph. y Ì‚= 2.115x + 21.958 а. b. 30 30 25 25 20 20 15 15 10 10 5 5 +++++ ++x 5 10 15 20 25 30 35 40 + 2 4 6 8 10 C. d. y 140 70- 120 60 100 50 80 40 60 30 40 20 20- 10 10 20 30 40 50 5
> Match the regression equation with the appropriate graph. y Ì‚= -1.361x + 21.952 а. b. 30 30 25 25 20 20 15 15 10 10 5 5 +++++ ++x 5 10 15 20 25 30 35 40 + 2 4 6 8 10 C. d. y 140 70- 120 60 100 50 80 40 60 30 40 20 20- 10 10 20 30 40 50
> Match the description in the left column with its symbol(s) in the right column. Slope a. y ̂i b. yi c. b d. (x, y) e. m f. y
> Match the description in the left column with its symbol(s) in the right column. The point a regression line always passes through a. y ̂i b. yi c. b d. (x, y) e. m f. y
> Match the description in the left column with its symbol(s) in the right column. The mean of the y-values a. y ̂i b. yi c. b d. (x, y) e. m f. y
> a. identify the claim and state H0 and Ha, b. find the critical value(s) and identify the rejection region(s), c. find the standardized test statistic x2, d. decide whether to reject or fail to reject the null hypothesis, and e. interpret the decisio
> Determine whether a normal sampling distribution can be used to approximate the binomial distribution. If it can, test the claim. Claim: p ≥ 0.04; α = 0.10 Sample statistics: p ̂= 0.03, n = 30
> Determine whether a normal sampling distribution can be used to approximate the binomial distribution. If it can, test the claim. Claim: p = 0.65; α = 0.03 Sample statistics: p ̂= 0.76, n = 116
> Determine whether a normal sampling distribution can be used to approximate the binomial distribution. If it can, test the claim. Claim: p = 0.15; α = 0.05 Sample statistics: (p ) ̂= 0.09, n = 40
> Use the multiple regression equation to predict the y-values for the values of the independent variables. The equation used to predict the weight of an elephant (in kilograms) is y ̂= -4016 + 11.5x1 + 7.55x2 + 12.5x3 where x1 represents the girth of the
> Use the multiple regression equation to predict the y-values for the values of the independent variables. The volume (in cubic feet) of a black cherry tree can be modeled by the equation y ̂= -52.2 + 0.3x1 + 4.5x2 where x1 is the tree’s height (in feet)
> Use the multiple regression equation to predict the y-values for the values of the independent variables. The equation used to predict the annual sorghum yield (in bushels per acre) is y ̂= 80.1 - 20.2x1 + 21.2x2 where x1 is the number of acres planted (
> Use the multiple regression equation to predict the y-values for the values of the independent variables. The equation used to predict the annual cauliflower yield (in pounds per acre) is y ̂= 24,791 + 4.508x1 - 4.723x2 where x1 is the number of acres pl
> Match the description in the left column with its symbol(s) in the right column. The y-value for a point on the regression line corresponding to xi a. y ̂i b. yi c. b d. (x, y) e. m f. y
> A researcher collects the data shown below and concludes that there is a significant relationship between the amount of radio advertising time (in minutes per week) and the weekly sales of a product (in hundreds of dollars). Find the standard error of e
> Use the data to a. find the coefficient of determination r2 and interpret the result, and b. find the standard error of estimate se and interpret the result The table shows the numbers of new-vehicle sales (in thousands) in the United States for Ford a
> Match the description in the left column with its symbol(s) in the right column. y-intercept a. y ̂i b. yi c. b d. (x, y) e. m f. y
> The regression equation for the Old Faithful data is y ̂= 12.481x + 33.683. Use this to predict the time until the next eruption for each eruption duration. (Recall from Section 9.1, Example 6, that x and y have a significant linear correlation.) 1. 2 mi
> Use the data to a. find the coefficient of determination r2 and interpret the result, and b. find the standard error of estimate se and interpret the result The table shows the amounts of crude oil (in thousands of barrels per day) produced by the Unit
> Find the critical values x_L^2 and x_R^2 for a two-tailed test when n = 51 and α = 0.01.
> Find the critical value x_0^2 for a left-tailed test when n = 30 and α = 0.05
> Find the critical value x_0^2 for a right-tailed test when n = 18 and α = 0.01.
> Use the data to a. find the coefficient of determination r2 and interpret the result, and b. find the standard error of estimate se and interpret the result The U.S. voting age populations (in millions) and the number of ballots cast (in millions) for
> The table shows the metacarpal bone lengths (in centimeters) and the heights (in centimeters) of 12 adults. The equation of the regression line is y Ì‚= 1.707x + 94.380. a. Find the coefficient of determination r2 and interpret the results
> Determine whether or not the vector field is conservative. If it is conservative, find a function f such that F = ∇f. F (x, y, z) = eyz i + xzeyz j + xyeyz k
> Determine whether or not the vector field is conservative. If it is conservative, find a function f such that F = ∇f. F (x, y, z) = i + sin z j + y cos z k
> Verify Green’s Theorem by using a computer algebra system to evaluate both the line integral and the double integral. P (x, y) = x3y4, Q (x, y) = x5y4, C consists of the line segment from (- π/2, 0) to ( π/2, 0) followed by the arc of the curve y = cos
> (a). Define the gradient vector ∇f for a function f of two or three variables. (b). Express Du f in terms of ∇f. (c). Explain the geometric significance of the gradient.
> Determine whether or not the vector field is conservative. If it is conservative, find a function f such that F = ∆f. F (x, y, z) = y2z3 i + 2xyz3 j + 3xy2z2 k
> Let f be a scalar field and F a vector field. State whether each expression is meaningful. If not, explain why. If so, state whether it is a scalar field or a vector field. (a). curl f (b). grad f (c). div F (d). curl (grad f) (e). grad F (f). grad (d
> The vector field F is shown in the xy-plane and looks the same in all other horizontal planes. (In other words, F is independent of z and its z-component is 0.) (a). Is div F positive, negative, or zero? Explain. (b). Determine whether curl F = 0. If n
> The vector field F is shown in the xy-plane and looks the same in all other horizontal planes. (In other words, F is independent of z and its z-component is 0.) (a). Is div F positive, negative, or zero? Explain. (b). Determine whether curl F = 0. If n
> Verify that Green’s Theorem is true for the line integral ∫C xy2 dx - x2 y dy, where C consists of the parabola y = x2 from (-1, 1) to (1, 1) and the line segment from (1, 1) to (-1, 1).
> Show that F is a conservative vector field. Then find a function f such that F = ∇f. F(x, y) = (1 + xy)e" i + (e' + x*e")j
> Suppose F is a vector field on R3. (a). Define curl F. (b). Define div F. (c). If F is a velocity field in fluid flow, what are the physical interpretations of curl F and div F?
> Find the area of the part of the surface z = x2 + 2y that lies above the triangle with vertices (0, 0), (1, 0), and (1, 2).
> Find the work done by the force field F (x, y, z) = z i + x j + y k in moving a particle from the point (3, 0, 0) to the point (0, π/2, 3) along (a). a straight line (b). the helix x = 3 cos t, y = t, z = 3 sin t
> If f is a harmonic function, that is, ∇2 f = 0, show that the line integral ∫ fy dx - fx dy is independent of path in any simple region D.
> If f and t are twice differentiable functions, show that ∇2(f g) = f ∇2g + g ∇2 f + 2 ∇f ∙ ∇g
> If C is any piecewise-smooth simple closed plane curve and f and t are differentiable functions, show that ∫C f (x) dx + g (y) dy = 0
> A spring with a mass of 2 kg has damping constant 16, and a force of 12.8 N keeps the spring stretched 0.2 m beyond its natural length. Find the position of the mass at time t if it starts at the equilibrium position with a velocity of 2.4 m/s.
> A series circuit contains a resistor with R = 40 V, an inductor with L = 2 H, a capacitor with C = 0.0025 F, and a 12-V battery. The initial charge is Q = 0.01 C and the initial current is 0. Find the charge at time t.
> Use power series to solve the differential equation y'' – xy' - 2y = 0
> Use power series to solve the initial-value problem y'' + xy' + y = 0 y (0) = 0 y'(0) = 1
> Solve the boundary-value problem, if possible. y'' + 4y' + 29y = 0, y (0) = 1, y (π) = -e-2 π
> (a). Write the definition of the line integral of a scalar function f along a smooth curve C with respect to arc length. (b). How do you evaluate such a line integral? (c). Write expressions for the mass and center of mass of a thin wire shaped like a cu
> Solve the boundary-value problem, if possible. y'' + 4y' + 29y = 0, y (0) = 1, y (π) = -1
> Solve the initial-value problem. 9y'' + y = 3x + e-x, y (0) = 1, y'(0) = 2
> Solve the initial-value problem. y'' - 5y' + 4y = 0, y (0) = 0, y'(0) = 1
> Solve the initial-value problem. y'' - 6y' + 25y = 0, y (0) = 2, y'(0) = 1
> Solve the initial-value problem. y'' + 6y' = 0, y (1) = 3, y'(1) = 12
> Solve the differential equation. d2y/dx2 + y = csc x, 0 < x < π/2
> Solve the differential equation. d2y/dx2 – dy/dx - 6y = 1 + e-2x
> Solve the differential equation. d2y/dx2 + 4y = sin 2x
> Solve the differential equation. d2y/dx2 - 2 dy/dx + y = x cos x
> Solve the differential equation. d2y/dx2 + dy/dx - 2y = x2
> What is a vector field? Give three examples that have physical meaning.
> Prove the following identity: ∇ (F ∙ G) = (F ∙ ∇) G + (G ∙ ∇) F + F × curl G + G × curl F
> Solve the differential equation. y'' + 8y' + 16y = 0
> Let C be a simple closed piecewise-smooth space curve that lies in a plane with unit normal vector n = 〈a, b, c〉 and has positive orientation with respect to n. Show that the plane area enclosed by C is } 6г — су)
> Evaluate the line integral. ∫C x ds, C is the arc of the parabola y = x2 from (0, 0) to (1, 1)
> Solve the differential equation. 4y'' - y = 0
> Solve the differential equation. d2y/dx2 - 4 dy/dx + 5y = e2x
> Solve the differential equation. y'' + 3y = 0
> Write expressions for the area enclosed by a curve C in terms of line integrals around C.
> State Green’s Theorem.
> Solve the differential equation. 3y'' + 4y' - 3y = 0
> State the Fundamental Theorem for Line Integrals.
> The figure depicts the sequence of events in each cylinder of a four-cylinder internal combustion engine. Each piston moves up and down and is connected by a pivoted arm to a rotating crankshaft. Let P (t) and V (t) be the pressure and volume within a cy

