Question: Using table 9.1, Determine the most
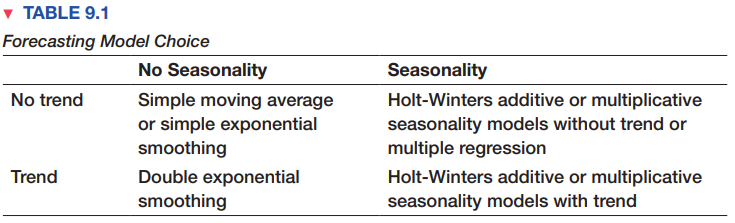
Using table 9.1, Determine the most appropriate forecasting technique for the data in the Excel file Mortgage Rates and implement the model.
Data from Table 9.1:
> The demand for organic chicken meat is quite sensitive to price. Typically, there is an inverse relationship between its demand and price—when price decreases, demand increases and vice versa. The price of 1 pound of organic chicken selling at a major U.
> ElectroMart wants to identify a location for a warehouse that will ship to five retail stores. The coordinates and annual number of truckloads are given here. Develop a model to find the best location, assuming that straight-line distances can be used be
> A franchise of a chain of Mexican restaurants wants to determine the best location to attract customers from three suburban neighborhoods. The coordinates of the three suburban neighborhoods are as follows: The population of Adams is four times as large
> The Bose Theater, a community playhouse, needs to determine the lowest-cost production budget for an upcoming show. Specifically, they have to determine which set pieces to construct and which, if any, set pieces to rent from another local theater at a p
> Experiment with the portfolio allocation model to attempt to find the best solution that maximizes the expected annual return and meets the total weighted risk constraint.
> Jennifer Bellin has been put in charge of planning her company’s annual leadership conference. The dates of the conference have been determined by her company’s executive team. The table that follows contains informati
> Adam is 24 years old and has a 401(k) plan through his employer, a large financial institution. His company matches 50% of his contributions up to 6% of his salary. He currently contributes the maximum amount he can. In his 401(k), he has three funds. In
> Few companies take the time to estimate the value of a good customer (and often spend little effort to keep one). Suppose that a customer at a restaurant spends, on average, R per visit and comes F times each year (for example, if a customer purchases on
> The board of directors of Bolt Electric Vehicles (BEV) is considering replacing its original model, the BEV Neo, with a new model, the BEV-Alpha, which they feel will appeal to the younger demographic. The company will produce the approved model for the
> The wedding banquet prices at a famous hotel in Singapore continue to increase on a yearly basis. The booking volume this year is estimated to be at 3,000 tables (for 10 persons per table) and is projected to grow at a rate of 2.50% per year. The booki
> An auditor found an expense receipt for $179.24 without a name. Write a left table lookup function that would identify the sales rep in the Travel Expenses database.
> With the growth of digital photography, a young entrepreneur is considering establishing a new business, Wild World Photography. She estimates that the average number of safari trail bookings per year is 19. One of the key variables in developing her
> J&G Bank receives an average of 30,000 credit card applications each month. Approximately 60% of them are approved. Each customer charges an average of $2,000 to his or her credit card each month. Approximately 85% pay off their balances in full, and the
> Cinéma Le Méliès is a small movie theatre in Grenoble, France. After the release of a widely anticipated Marvel movie, like the Avengers: Endgame, the number of adult and children’s tickets sold at the theatre is 55,000 and 20,000, respectively. Adult ti
> A stockbroker calls on potential clients from referrals. For each call, there is a 20% chance that the client will decide to invest with the stockbroker’s firm. Forty percent of those interested are found not to be qualified, based on t
> A bi-monthly Sunday bazaar is held at a local maretplace in London, England. The expected crowd is 4,500. The average expenditure estimate is £25 per person. Entry coupons sell for £10 each, and the bazaar’s profit is 90% of the gate and concession sales
> Intel, the largest semiconductor manufacturing company in the world, sells two major types of computer chips, type A and type B. The sales of these two chips are dependent of each other (in economics, we call these substitutable products because if the p
> Develop a spreadsheet model to determine how much a person or a couple can afford to spend on a house.11 Lender guidelines suggest that the allowable monthly housing expenditure should be no more than 28% of monthly gross income. From this, you must subt
> A famous fashion boutique in Shanghai, China, is planning its pricing for a dress that can be worn on Christmas day as well as the Chinese New Year. The product will be sold for ¥100 in the boutique at the beginning of December and will sell through Chri
> Develop a spreadsheet for calculating the total revenue for the Intel scenario. Design it such that the price-demand function parameters are easy to change.
> The monthly demand for a digital camera is sensitive to price: Find the most appropriate trendline to explain the relationship between demand and price, and develop a model for the monthly revenue.
> In the Factvalue database, you need to find the country with a birth rate of 29.43 and identify the country’s death rate. Write functions for a left table lookup to answer these queries.
> The People’s Choice Bank is a small community bank that has three local branches, in Blue Ash, Delhi, and Anderson Hills. The Excel file People’s Choice Bank is a database of major account transactions for the month of August. 1. Note that it is difficul
> Economists believe that housing starts depend on interest rates and demographic factors such as population size, family income, and the age of the home buying population. In addition, interest rates depend on inflation, Federal Reserve policies, and gove
> Construct an influence diagram for the portfolio allocation model in Example 11.15. Data from Example 11.15:
> A manufacturer of kitchen appliances is preparing to set the price on a new blender. Demand is thought to depend on the price and is represented by the model D = 2,900 - 2P The accounting department estimates that the total cost can be represented by C =
> Use discriminant analysis to classify the new records in the Excel file Train Journey Decisions using only hourly passenger and adult rate as input variables.
> Using the approach described, classify first record in the worksheet Records to Classify in the Excel file Train Journey Decisions by using the k-NN algorithm for k = 1 to 5.
> Apply single linkage cluster analysis to the first five records in the Excel file Sales Data, using the variables Percent Gross Profit, Industry Code, and Competitive Rating, and draw a dendogram illustrating the clustering process.
> Using only Credit Score, Years of Credit History, Revolving Balance, and Revolving Utilization, apply single linkage cluster analysis to the first six records in the Excel file Credit Approval Decisions and draw a dendogram illustrating the clustering pr
> For the Excel file Total Population, find a normalized distance matrix between Arkansas, Delaware, South Carolina, and South Dakota states. Apply single linkage clustering to these states and draw a dendogram illustrating the clustering process.
> For the three clusters identified in Table 10.3, find the average and standard deviations of each numerical variable for the schools in each cluster and compare them with the average and standard deviation for the entire data set. Does the clustering sho
> For the Excel file Pharmaceuticals, normalize each column of the numerical data (i.e., compute a Z-score for each of the values) and then compute the Euclidean distances between the following pharmaceutical companies: ABT, CHTT and MRX.
> Use INDEX and MATCH functions to fill in a table that extracts the amounts shipped between each pair of cities in the Excel file General Appliance Corporation, which shows the solution to an optimization model that finds the minimum cost and amounts ship
> Identify the leading and lagging measures for the variables provided in the Excel file Eraser. Find the correlation matrix and propose a cause-and-effect model using the strongest correlations.
> The Excel file Automobile Options 2 provides data on options ordered together for a particular model of automobile. Consider the following rules: Rule 1: If Fastest Engine, then Traction Control. Rule 2: If Faster Engine and 16-inch Wheels, then 3 Year W
> The Excel file Auto Options provides data on options ordered together for a particular automobile model. By examining the correlation matrix, suggest some Associations.
> Extract the records and code the non-numerical data Company in the Excel file Train Journey Decisions. Apply the discriminant analysis to classify the occupied seats for the train passengers in the Records to Classify worksheet.
> Compute the Euclidean distance between the following set of points: a. (1.06, 9.2) and (0.89, 10.3) b. (1.6, 0.628, 9.077) and (2.2, 1.555, 5.088)
> The Excel file Stock Prices provides data for four stocks and the stock exchange average over a 12 day period. a. Use Excel’s Data Analysis Exponential Smoothing tool to forecast each of the stock prices using simple exponential smoothing with a smoothin
> The Excel file Closing Stock Prices provides data for four stocks and the Dow Jones Industrial Average over a one-month period. a. Develop a spreadsheet for forecasting each of the stock prices and the DJIA using a simple two period and three-period movi
> The Excel file New Registered Users provides data on new registrations to an App on a monthly basis for four years. Compare the 3- and 12-month moving average forecasts using the MAD criterion. Explain which model yields better results and why.
> For the data in the Excel file Airport Passengers, do the following: a. Develop a spreadsheet for forecasting the number of airport passengers using a simple three-period moving average. b. Compute MAD, MSE, and MAPE error measures.
> Use http://www.fao.org/faostat/en/#data to extract an annual dataset for any topic of your interest that would aid in constructing a statistical forecasting model analysis. Download the relevant dataset into an Excel workbook, develop a line chart for th
> For this exercise, use the Wikipedia database. Use MATCH and/or INDEX functions to find the following: a. The row numbers corresponding to the first and last instance of name Affaire_Réveillon in column B (be sure column B is sorted by order number). b.
> For each of the time series in the following Excel files, construct a line chart of the data and identify the characteristics of the time series (that is, random, stationary, trend, seasonal, or cyclical). a. Closing Stock Prices b. Unemployment Rates c.
> Using Excel’s Moving Average tool for the data in the Excel file Occupancy, identify the moving trend for each of the hotels, motels, backpacker hostels, and holiday parks.
> Using Table 9.1, determine the most appropriate forecasting technique for the data in the Excel file Treasury Yield Rates and implement the model. Data from Table 9.1:
> Using table 9.1, Determine the most appropriate forecasting technique for the data in the Excel file Prime Rate and implement the model. Data from Table 9.1:
> Using Table 9.1, Determine the most appropriate forecasting technique for the data in the Excel file DJIA December Close and implement the model. Data from Table 9.1:
> The Excel file CD Interest Rates provides annual average interest rates on six-month certificate of deposits. Compare the Holt-Winters additive and multiplicative models using = 0.7, = 0.3, = 0.1, and a season of six years. Try to fine-tune the par
> Modify the Excel file Holt-Winters Additive Model for Seasonality and Trend for the New Car Sales data to implement the Holt-Winters multiplicative seasonality model with trend. Try to find the best combination of , , and to minimize MSE.
> Experiment with the Holt-Winters Additive Model for Seasonality and Trend spread sheet model to find the best combination of , , and to minimize MSE.
> Modify the Excel file Holt-Winters Additive Model for Seasonality to implement the Holt-Winters multiplicative seasonality model with no trend.
> Enhance the Yield Rates database file to perform a database query that finds the rate associated with any date and term. (This is a challenging question because you will not be able to use the term headers in a MATCH function. Hint: Add a row that assign
> Experiment with the Holt-Winters Additive Model for Seasonality spreadsheet to find the best combination of and to minimize MAD.
> Develop a multiple regression model with categorical variables that incorporate seasonality for forecasting for the data in the Excel file Tourists Arrival.
> Develop a multiple regression model with categorical variables that incorporate seasonality for forecasting 2010 housing starts using the 2008 and 2009 data in the Excel file Housing Starts.
> Develop a multiple regression model with categorical variables that incorporate seasonality for forecasting sales using the last three years of data in the Excel file Auto Sales.
> Develop a multiple linear regression model with categorical variables that incorporate seasonality for forecasting the deaths caused by accidents in the United States. Use the data for years 1976 and 1977 in the Excel file Accident Deaths. Use the model
> Consider the data in the Excel file Internet Users. Use simple linear regression to forecast the data. What would be the forecast for the next three years?
> Consider the prices for the Stock Exchange in the Excel file Stock Prices. Use simple linear regression to forecast the data. What would be the forecasts for the next three days?
> For the coal production example using double exponential smoothing, experiment with the spreadsheet model to find the best values of and that minimize MAD.
> For the data in the Excel file Airport Passengers, do the following: a. Develop a spreadsheet for forecasting the number of airport passengers using simple exponential smoothing with smoothing constants from 0.1 to 0.9 in increments of 0.1. b. Using MAD,
> The managing director of a consulting group has the following monthly data on total overhead costs and professional labor hours to bill to clients: a. Develop a simple linear regression model between billable hours and overhead costs. b. Interpret the co
> Enhance the Sales Transactions database file to perform a database query that finds the transaction code and amount associated with any customer ID input. Apply your results to customer ID 10029.
> Using the results of fitting the Home Market Value regression line in Example 8.4, compute the errors associated with each observation using formula) and construct a frequency distribution and histogram.
> Use the data in the Excel file MBA Motivation and Salary Expectations to determine how well a linear function models the relationship between pre- and post-MBA salaries. Compare it to a third-order polynomial. Would the polynomial model have a logical ex
> Using the data in the Excel file Kidney, determine the relationship between frailty rates in people with chronic kidney disease and the age of a person by constructing a scatter chart for the data. Find the best-fitting function using the Trendline tool.
> A product manufacturer wishes to determine the relationship between the shelf space of the product and its sales. Past data indicates the following sales and shelf space in its stores: Using these data points, apply simple linear regression and examine t
> For the Excel file Job Satisfaction, develop a regression model for overall satisfaction as a function of years of service and department that has the largest R2. Which department, if any, has the highest impact on satisfaction?
> For the Car Sales data described in Problem 35, develop a regression model for selling price as a function of horsepower and manufacture year, incorporating an interaction term. What would be the predicted price for a car manufactured in either 2002 or
> A leading car manufacturer tracks the data of its used cars for resale. The Excel file Car Sales contains information on the selling price of the car, fuel type (diesel or petrol), horsepower (HP), and manufacture year. a. Develop a multiple linear regre
> A researcher is analyzing the body fat percentage based on the measurements of triceps, thigh, and mid-arm of a person (in inches). The data is recorded in the Excel file Body Fat Percentage. a. Use the Correlation tool to develop the correlation matrix
> The Excel file Women Height Data provides information on women’s height, their mother’s height, their father’s height, amount of protein intake (per day), and the hours of exercise (per day) for a select sample of women. Use the Correlation tool to find
> Each worksheet in the Excel file LineFit Data contains a set of data that describes a functional relationship between the dependent variable y and the independent variable x. Construct a line chart of each data set and use the Trendline tool to determine
> An insurance company is estimating the risk model based on customer age is define as R = aebx where a is a fixed constant and b is a constant that depends on the customer age. They categorize the age into 5 categories as age < 10 with b = 0.05, 10 < age
> The Excel file Credit Approval Decisions provides information on credit history for a sample of banking customers. Use regression analysis to identify the best model for predicting the credit score as a function of the other numerical variables, using bo
> The Excel file Breakfast Foods provides a variety of nutritional information about 67 breakfast food items in supermarkets in different parts of the world. Use regression analysis to find the best model that explains the relationship between calories and
> Use the data in the Excel file Job Satisfaction to find the best multiple regression model to predict the overall satisfaction as a function of the other variables. What managerial implications does your result have?
> Use the data in the Excel file EU Cost of Living Adjustments to find the best multiple regression model to predict the salary as a function of the adjusted cost of living rates. What would the comparable salary be for a country in the European Union with
> Using the data in the Excel file Credit Card Spending, develop a multiple linear regression model for estimating the average credit card expenditure as a function of both the income and family size. Predict the average expense of a family that has two me
> Use the data in the Excel file Neighborhoods to find a multiple regression model to predict the total sales as a function of all the other given variables. State the model and explain R2, Significance F, and p-values.
> Use the data in the Excel file Canned Food to find a multiple regression model to predict the total sales as a function of all the other given variables. State the model and explain R2, Significance F, and p-values.
> Using the data in the Excel file Home Market Value, develop a multiple linear regression model for estimating the market value as a function of both the age and size of the house. State the model and explain R2, Significance F, and p-values.
> The Excel file World Tour Sales provides data on sales (£) and the number of radio, TV, and newspaper ads promoting the world tour for a group of countries. Develop simple linear regression models for predicting sales as a function of the number of each
> A consumer products company has collected some data relating to the advertising costs and sales of one of its products: What type of model would best represent the data? Use the Trendline tool to find the best among the options provided.
> In a toy manufacturing company, the manufacturer needs to pay rent (p) each month and monthly electricity (q). To produce each toy, the company incurs costs for plastic (r) and for cloth (s). The variables p, q, r, and s are positive constants. Given the
> Use the results (Weddings) to analyze the residuals to determine if the assumptions underlying the regression analysis are valid. In addition, use the standard residuals to determine if any possible outliers exist.
> Use the results (Student Grades) to analyze the residuals to determine if the assumptions underlying the regression analysis are valid. In addition, use the standard residuals to determine if any possible outliers exist.
> Use the results (Horsepower versus Gasoline) to analyze the residuals to determine if the assumptions underlying the regression analysis are valid. In addition, use the standard residuals to determine if any possible outliers exist.
> Use the results for Problem 10 (Demographics) to analyze the residuals to determine if the assumptions underlying the regression analysis are valid. In addition, use the standard residuals to determine if any possible outliers exist. Data from Problem 1
> Using the Excel file Weddings, apply the Excel Regression tool using the wedding cost as the dependent variable and the couple’s income as the independent variable, only for those weddings paid for by the bride and groom. Interpret all key regression res
> Using the Excel file Weddings, apply the Regression tool using the wedding cost as the dependent variable and attendance as the independent variable. a. What is the regression model? b. Interpret all key regression results, hypothesis tests, and confiden
> Using the data in the Excel file Student Grades, apply the Excel Regression tool using the midterm grade as the independent variable and the final exam grade as the dependent variable. Interpret all key regression results, hypothesis tests, and confidenc
> The Excel file Horsepower versus Gasoline provides data on the amount of gasoline used per 100 miles by different brands of cars along with their horsepower. a. Construct a scatter diagram for gasoline used per 100 miles and horsepower in the given Excel
> Using the data in the Excel file Kidney, apply the Excel Regression tool using kidney frailty rates and age of a person as the variables. Interpret all key regression results, hypothesis tests, and confidence intervals in the output.
> According to a magazine, people read an average of more than three books in a month. A survey of 20 random individuals found that the mean number of books they read was 2.9 with a standard deviation of 1.23. a. To test the magazine’s claim, what should t
> The yearly government tax revenue (in $ millions) depends on customer income, business profits, and capital gains defined as tax = -2.556 + 3.799 *income + 1.583 * profit + 0.739 * capital. a. Interpret the numbers in this model. b. What is the governmen
> An analyst at a business school in France is assessing students’ performance. Historical records of applicants suggest that the mean score obtained by students attending the school is 350. The business school administration wants to know whether the perf

