Question: Examine the following visualization, adapted from a
Examine the following visualization, adapted from a management consulting white paper.
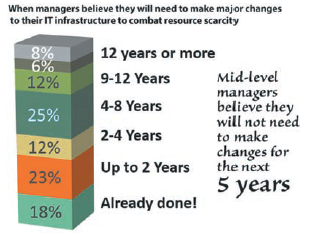
a. Describe at least one good feature of this visual display.
b. Describe at least one bad feature of this visual display.
c. Redraw the graph, by using the Exhibit 2.1 guidelines.
> The following is a set of data for a population with N = 10: 7 5 6 6 6 4 8 6 9 3 a. Compute the population mean. b. Compute the population standard deviation.
> The following is a set of data for a population with N = 10: 7 5 11 8 3 6 2 1 9 8 a. Compute the population mean. b. Compute the population standard deviation.
> A bank branch located in a commercial district of a city has the business objective of developing an improved process for serving customers during the noon-to-1:00 p.m. lunch period. The waiting time, in minutes, is defined as the time the customer enter
> The file CD Rate contains the yields for one-year CDs and five-year CDs, for 39 banks in the United States, as of January 9, 2017. Source: Data extracted from www.Bankrate.com, January 9, 2017. For each type of account: a. Compute the first quartile (Q1)
> The annual NFL Super Bowl is the most widely watched sporting event in the United States each year. In recent years, there has been a great deal of interest in the ads that appear during the game. These ads vary in length with most lasting 30 seconds or
> The file HotelAway contains the average room price (in US$) paid by various nationalities while traveling abroad (away from their home country) in 2016: 124 101 115 126 114 112 138 85 138 96 130 116 Source: Data extracted from hpi.hotels.com/. a. Compute
> The file MobileCommerce contains the following mobile commerce penetration values, the percentage of the country population that bought something online via a mobile phone in the past month, for twenty-eight of the world’s economies: 23 27 26 25 40 19 26
> The file AccountingPartners contains the number of partners in a cohort of rising accounting firms that have been tagged as “firms to watch.” The firms have the following number of partners: 37 41 26 14 22 29 36 11 16 29 30 20 20 20 26 21 17 21 14 28 24
> Under what circumstances does the sampling distribution of the proportion approximately follow the normal distribution?
> The following is a set of data from a sample of n = 5: 7 -5 -8 7 9 a. Compute the first quartile (Q1), the third quartile (Q3), and the interquartile range. b. List the five-number summary. c. Construct a boxplot and describe its shape. d. Compare your a
> The following is a set of data from a sample of n = 5: 7 4 9 8 2 a. Compute the first quartile (Q1), the third quartile (Q3), and the interquartile range. b. List the five-number summary. c. Construct a boxplot and describe its shape. d. Compare your ans
> The following is a set of data from a sample of n = 6: 7 4 9 7 3 12 a. Compute the first quartile (Q1), the third quartile (Q3), and the interquartile range. b. List the five-number summary. c. Construct a boxplot and describe its shape. d. Compare your
> The following is a set of data from a sample of n = 7: 12 7 4 9 0 7 3 a. Compute the first quartile (Q1), the third quartile (Q3), and the interquartile range. b. List the five-number summary. c. Construct a boxplot and describe its shape. d. Compare you
> Using the three-year return percentage variable in Retirement Funds: a. Construct a table that computes the mean for each combination of type, risk, and rating. b. Construct a table that computes the standard deviation for each combination of type, ris
> Using the three-year return percentage variable in Retirement Funds: a. Construct a table that computes the mean for each combination of market cap, risk, and rating. b. Construct a table that computes the standard deviation for each combination of mar
> Using the three-year return percentage variable in Retirement Funds: a. Construct a table that computes the mean for each combination of type, market cap, and rating. b. Construct a table that computes the standard deviation for each combination of typ
> Using the three-year return percentage variable in Retirement Funds: a. Construct a table that computes the mean for each combination of type, market cap, and risk. b. Construct a table that computes the standard deviation for each combination of type,
> In 2013 through 2016, the value of precious metals fluctuated dramatically. The following data (stored in Metals ) represent the total rate of return (in percentage) for platinum, gold, and silver from 2013 through 2016: a. Compute the geometric mean r
> The file Indices contains the total rate of return percentage for the Dow Jones Industrial Average (DJIA), the Standard & Poor’s 500 (S&P 500), and the technology-heavy NASDAQ Composite (NASDAQ) from 2013 through 2016. These dat
> What is the difference between a population distribution and a sampling distribution?
> Facebook’s stock price in 2015 increased by 34.15%, and in 2016, it increased by 9.93%. Source: Data extracted from finance.yahoo.com, January 9, 2017. a. Compute the geometric mean rate of return per year for the twoyear period 2015–2016. b. If you purc
> General Electric (GE) is one of the world’s largest companies; it develops, manufactures, and markets a wide range of products, including medical diagnostic imaging devices, jet engines, lighting products, and chemicals. In 2015, the stock price rose 23.
> Suppose that another bank branch, located in a residential area, is also concerned with the noon-to-1:00 p.m. lunch hour. The waiting time, in minutes, collected from a sample of 15 customers during this hour, are stored in Bank2 : 9.66 5.90 8.02 5.79 8.
> A bank branch located in a commercial district of a city has the business objective of developing an improved process for serving customers during the noon-to-1:00 p.m. lunch period. The waiting time, in minutes, is defined as the time the customer enter
> The file HotelAway contains the average room price (in US$) paid by various nationalities while traveling abroad (away from their home country) in 2016: 124 101 115 126 114 112 138 85 138 96 130 116 132 Source: Data extracted from hpi.hotels.com/. a. Com
> Is there a difference in the variation of the yields of different types of investments? The file CD Rate contains the yields for oneyear certificates of deposit (CDs) and five-year CDs for 39 banks listed for West Palm Beach, Florida on January 9, 2017.
> The file MobileCommerce contains the following mobile commerce penetration values, the percentage of the country population that bought something online via a mobile phone in the past month, for 28 of the world’s economies: 23 27 26 25 40 19 26 36 23 33
> The file AccountingPartners contains the number of partners in a cohort of rising accounting firms that have been tagged as “firms to watch.” The firms have the following numbers of partners: 37 41 26 14 22 29 36 11 16 29 30 20 20 20 26 21 17 21 14 28 24
> The annual NFL Super Bowl is the most widely watched sporting event in the United States each year. In recent years, there has been a great deal of interest in the ads that appear during the game. These ads vary in length with most lasting 30 seconds or
> The file AirportRating contains the rating of large and medium size airports in the United States and Canada. Source: Data extracted from N. Trejos, “Portland, Indianapolis Top Airport Rankings, USA Today, December 16, 2016, p. 4B. For large and medium
> Why does the sampling distribution of the mean follow a normal distribution for a large enough sample size, even though the population may not be normally distributed?
> The file MobileSpeed contains the overall download and upload speeds in mbps for nine carriers in the United States. Source: Data extracted from “Best Mobile Network 2016”, bit.ly/1KGPrMm, accessed November 10, 2016.
> According to the U.S. Census Bureau (census.gov), in 2016, the median sales price of new houses was $315,500 and the mean sales price was $370,800. a. Interpret the median sales price. b. Interpret the mean sales price. c. Discuss the shape of the distri
> The operations manager of a plant that manufactures tires wants to compare the actual inner diameters of two grades of tires, each of which is expected to be 575 millimeters. A sample of five tires of each grade was selected, and the results representing
> Wired, a magazine that delivers a glimpse into the future of business, culture, innovation, and science, reported the following summary for the household incomes of its two types of subscribers, the print reader and the digital reader. Source: Data ext
> Suppose that the rate of return for a particular stock during the past two years was 20% for the first year and -30% for the second year. Compute the geometric rate of return per year.
> Suppose that the rate of return for a particular stock during the past two years was 10% for the first year and 30% for the second year. Compute the geometric rate of return per year. (Note: A rate of return of 10% is recorded as 0.10, and a rate of retu
> The following set of data is from a sample of n = 5: 7 -5 -8 7 9 a. Compute the mean, median, and mode. b. Compute the range, variance, standard deviation, and coefficient of variation. c. Compute the Z scores. Are there any outliers? d. Describe the sha
> The following set of data is from a sample of n = 7: 12 7 4 9 0 7 3 a. Compute the mean, median, and mode. b. Compute the range, variance, standard deviation, and coefficient of variation. c. Compute the Z scores. Are there any outliers? d. Describe the
> The following set of data is from a sample of n = 6: 7 4 9 7 3 12 a. Compute the mean, median, and mode. b. Compute the range, variance, standard deviation, and coefficient of variation. c. Compute the Z scores. Are there any outliers? d. Describe the sh
> The following set of data is from a sample of n = 5: 7 4 9 8 2 a. Compute the mean, median, and mode. b. Compute the range, variance, standard deviation, and coefficient of variation. c. Compute the Z scores. Are there any outliers? d. Describe the shape
> Why does the standard error of the mean decrease as the sample size, n, increases?
> Compare and contrast the bar chart for categorical data with the histogram for numerical data.
> What are the advantages and disadvantages of using a bar chart, a pie chart, a doughnut chart, and a Pareto chart?
> Why would you construct a summary table?
> How do histograms and polygons differ in construction and use?
> Figures 2.5 and 2.6 show a bar chart and a pie chart for the risk level for the retirement fund data (see pages 55–56). a. Create an exploded pie chart, a doughnut chart, a cone chart, and a pyramid chart that show the risk level of retirement funds. b.
> Figure 2.4 shows a bar chart and a pie chart for what devices millennials used to watch movies/TV shows (see page 54). a. Create an exploded pie chart, a cone chart, or a pyramid chart that shows how people paid for purchases and other transactions. b. W
> For each of the following variables, determine whether the variable is categorical or numerical and determine its measurement scale. If the variable is numerical, determine whether the variable is discrete or continuous. a. Number of cellphones in the h
> Examine the visualization on page 81, adapted from one that appeared in the post “Who Are the Comic Book Fans on Facebook?” on February 2, 2013, as reported by graphicspolicy.com. a. Describe at least one good feature
> Examine the following visualization, adapted from one that appeared in a post in a digital marketing blog. a. Describe at least one good feature of this visual display. b. Describe at least one bad feature of this visual display. c. Redraw the graph, u
> Why is the sample mean an unbiased estimator of the population mean?
> The time it takes to download a video from the Internet is measured. a. Explain why the download time is a continuous numerical variable. b. Explain why the download time is a ratio-scaled variable.
> U.S. businesses are listed by size: small, medium, and large. Explain why business size is an example of an ordinal-scaled variable.
> The file Natural Gas includes the monthly average commercial price for natural gas (dollars per thousand cubic feet) in the United States from January 1, 2008, to December 2016. Source: Data extracted from “U.S. Natural Gas Prices,” bit.ly/2oZIQ5Z, March
> The data in NewHomeSales includes the median sales price of new single-family houses sold in the United States recorded at the end of each month from January 2000 through December 2016. Source: Data extracted from bit.ly/2eEcIBR, March 19, 2017. a. Cons
> In the sample of 479 retirement funds ( Retirement Funds ), what characteristics are associated with the funds that have the lowest five-year return?
> Using the sample of retirement funds stored in Retirement Funds: a. Construct one chart that visualizes 10YrReturn and 1YrReturn by Market Cap. b. Construct one chart that visualizes 5YrReturn and 1YrReturn by Market Cap. c. How does the patterns to t
> In the sample of 479 retirement funds ( Retirement Funds ), which funds in the sample have the lowest five-year return?
> Using the sample of retirement funds stored in Retirement Funds: a. Construct a chart that visualizes SD and Assets by Risk Level. b. Construct a chart that visualizes SD and Assets by Fund Type. Rescale the Assets axis, if necessary, to see more detai
> In the sample of 479 retirement funds ( Retirement Funds ), what are the attributes of the fund with the highest five-year return?
> Using the sample of retirement funds stored in Retirement Funds: a. Construct a table that tallies type, market cap, risk, and rating. b. What conclusions can you reach concerning differences among the types of funds based on market cap categories, ris
> An IAB study on the state of original digital video showed that original data video is becoming increasingly popular. Original digital video is defined as professionally produced video only for ad-supported online distribution and viewing (not TV). Accor
> Using the sample of retirement funds stored in Retirement Funds: a. Construct a table that tallies Fund Type, Risk Level and Star Rating. b. What conclusions can you reach concerning differences among the types of retirement funds, based on the risk le
> Using the sample of retirement funds stored in Retirement Funds: a. Construct a table that tallies, Market Cap, Risk Level, and Star Rating. b. What conclusions can you reach concerning differences among the funds based on Market Cap (small, mid-cap, and
> Using the sample of retirement funds stored in Retirement Funds: a. Construct a table that tallies Fund Type, Market Cap, and Star Rating. b. What conclusions can you reach concerning differences among the types of retirement funds (growth and value), ba
> The Super Bowl is a big viewing event watched by close to 200 million Americans that is also a big event for advertisers. The file SuperBowlAds contains the number of ads that ran between the opening kickoff and the final whistle and the total elapsed ru
> The file Movie Attendance16 contains the yearly movie attendance (in billions) from 2001 through 2016. a. Construct a time-series plot for the movie attendance (in billions). b. What pattern, if any, is present in the data?
> The file NewHomeSales contains the number of new homes sold (in thousands) and the median sales price of new single-family houses sold in the United States recorded at the end of each month from January 2000 through December 2016. Source: Data extracted
> How have stocks performed in the past? The following table presents the data stored in Stock Performance and shows the performance of a broad measure of stocks (by percentage) for each decade from the 1830s through the 2000s: a. Construct a time-series
> A Pew Research Center survey found a noticeable rise in smartphone ownership and Internet usage in emerging and developing nations. Once online, adults in these nations are hungry for social interaction. The file GlobalIntenetUsage contains the level of
> The file MobileSpeed contains the overall download and upload speeds in mbps for nine carriers in the United States. Source: Data extracted from “Best Mobile Network 2016”, bit.ly/1KGPrMm, accessed November 10, 2016. a. Do you think that carriers with
> Data were collected on the typical cost of dining at American- cuisine restaurants within a 1-mile walking distance of a hotel located in a large city. The file Bundle contains the typical cost (a per transaction cost in $) as well as a Bundle score, a m
> The topic of global warming increasingly appears in the news. It has the potential to impact companies’ operations through changes in governmental regulations, new reporting requirements, necessary operational changes, and so on. The Institute of Managem
> The following is a series of annual sales (in $millions) over an 11-year period (2007 to 2017): Year: 2007 2008 2009 2010 2011 2012 2013 2014 2015 2016 2017 Sales: 13.0 17.0 19.0 20.0 20.5 20.5 20.5 20.0 19.0 17.0 13.0 a. Construct a time-series plot. b.
> The following is a set of data from a sample of n = 11 items: X: 7 5 8 3 6 0 2 4 9 5 8 Y: 1 5 4 9 8 0 6 2 7 5 4 a. Construct a scatter plot. b. Is there a relationship between X and Y? Explain.
> The data stored in Drink represents the amount of soft drink in a sample of fifty 2-liter bottles. a. Construct a histogram and a percentage polygon. b. Construct a cumulative percentage polygon. c. On the basis of the results in (a) and (b), does the am
> The file Bulbs contains the life (in hours) of a sample of forty 6-watt light emitting diode (LED) light bulbs produced by Manufacturer A and a sample of forty 6-watt light emitting diode (LED) light bulbs produced by Manufacturer B. Use the following c
> The financial services call center in Problem 2.44 also monitors call duration, which is the amount of time spent speaking to customers on the phone. The file CallDuration contains the following data for time, in seconds, spent by agents talking to 50 cu
> Call centers today play an important role in managing dayto- day business communications with customers. Call centers must be monitored with a comprehensive set of metrics so that businesses can better understand the overall performance of those centers.
> One operation of a mill is to cut pieces of steel into parts that will later be used as the frame for front seats in an automobile. The steel is cut with a diamond saw and requires the resulting parts to be within {0.005 inch of the length specified by t
> How do the average credit scores of people living in various cities differ? The file Credit Scores contains an ordered array of the average credit scores of 2,570 American cities. Source: Data extracted from “Study shows cities with highest and lowest cr
> How much time do Americans living in cities spend commuting to work each week? The data in the file CommutingTime include this cost for 30 cities. Source: Data extracted from “The High Cost of Congestion,” NYC Economic Brief, March 2015, p. 3. For the ti
> The following histogram and cumulative percentage polygon visualize the data about the property taxes on a $176K home for the 50 states and the District of Columbia, stored in Property Taxes . What conclusions can you reach concerning the property tax
> According to the MSCI 2016 Survey of Women on Boards, women hold 20% of director seats on U.S. corporate boards. This study also reports that 34% of U.S. companies have three or more female board directors. Source: Data extracted from “The Tipping Point:
> As player salaries have increased, the cost of attending baseball games has increased dramatically. The following histogram visualizes the total cost (in $) for two tickets, two beers, two hot dogs, and parking for one vehicle at each of the 30 Major Lea
> The file Utility contains the following data about the cost of electricity during July of a recent year for a random sample of 50 one- bedroom apartments in a large city: 96 171 202 178 147 102 153 197 127 82 157 185 90 116 172 111 148 213 130 165 141 1
> The file MobileSpeed contains the overall download and upload speeds in mbps for nine carriers in the United States. Source: Data extracted from “Best Mobile Network 2016”, bit.ly/1KGPrMm, accessed November 10, 2016. a. Construct an ordered array. b. C
> The file NBACost contains the total cost (in $) for four tickets purchased on the secondary market, two beers, two soft drinks, four hot dogs, and one parking space at each of the 30 National Basketball Association arenas during a recent season. Source:
> The following is a stem-and-leaf display representing the amount of gasoline purchased, in gallons (with leaves in tenths of gallons), for a sample of 25 cars that use a particular service station on the New Jersey Turnpike: a. Construct an ordered arr
> Construct an ordered array, given the following stem-and-leaf display from a sample of n = 7 midterm exam scores in information systems:
> Construct a stem-and-leaf display, given the following data from a sample of midterm exam scores in finance:
> Do social recommendations increase ad effectiveness? A study of online video viewers compared viewers who arrived at an advertising video for a particular brand by following a social media recommendation link to viewers who arrived at the same video by w
> A study of selected Kickstarter projects showed that overall a majority were successful, achieving their goal and raising, at a minimum, the targeted amounts. In an effort to identify project types that influence success, selected projects were subdivide
> A survey of 1,520 American adults asked “Do you feel overloaded with too much information?” The results indicate that 23% of females feel information overload compared to 17% of males. The results are: a. Construct a
> The goal of corporate sustainability is to manage the environmental, economic, and social effects of a corporation’s operations so it is profitable over the long-term while acting in a responsible manner to society. An international study by Unilever rev
> Timetric’s 2016 survey of insurance professionals explores the use of technology in the industry. The file Technologies contains the responses to the question that asked what technologies these professionals expected to be most used by
> The following table indicates the percentage of residential electricity consumption in the United States, in a recent year organized by type of use. a. Construct a bar chart, a pie chart, and a Pareto chart. b. Which graphical method do you think is be
> The Consumer Financial Protection Bureau reports on consumer financial product and service complaint submissions by state, category, and company. The following table, stored in Financial Complaints1 , represents complaints received from Louisiana consume
> The Energy Information Administration reported the following sources of electricity in the United States in 2016: a. Construct a Pareto chart. b. What percentage of power is derived from coal, nuclear power, or natural gas? c. Construct a pie chart. d.

