Question: How do college students spend their day?
How do college students spend their day? The 2016 American Time Use Survey for college students found the following results:
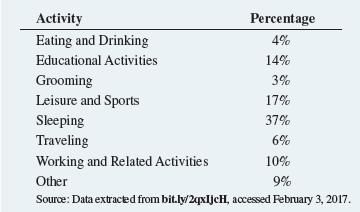
a. Construct a bar chart, a pie or doughnut chart, and a Pareto chart.
b. Which graphical method do you think is best for portraying these data?
c. What conclusions can you reach concerning how college students spend their day?
> Why is the sample mean an unbiased estimator of the population mean?
> The time it takes to download a video from the Internet is measured. a. Explain why the download time is a continuous numerical variable. b. Explain why the download time is a ratio-scaled variable.
> U.S. businesses are listed by size: small, medium, and large. Explain why business size is an example of an ordinal-scaled variable.
> The file Natural Gas includes the monthly average commercial price for natural gas (dollars per thousand cubic feet) in the United States from January 1, 2008, to December 2016. Source: Data extracted from “U.S. Natural Gas Prices,” bit.ly/2oZIQ5Z, March
> The data in NewHomeSales includes the median sales price of new single-family houses sold in the United States recorded at the end of each month from January 2000 through December 2016. Source: Data extracted from bit.ly/2eEcIBR, March 19, 2017. a. Cons
> In the sample of 479 retirement funds ( Retirement Funds ), what characteristics are associated with the funds that have the lowest five-year return?
> Using the sample of retirement funds stored in Retirement Funds: a. Construct one chart that visualizes 10YrReturn and 1YrReturn by Market Cap. b. Construct one chart that visualizes 5YrReturn and 1YrReturn by Market Cap. c. How does the patterns to t
> In the sample of 479 retirement funds ( Retirement Funds ), which funds in the sample have the lowest five-year return?
> Using the sample of retirement funds stored in Retirement Funds: a. Construct a chart that visualizes SD and Assets by Risk Level. b. Construct a chart that visualizes SD and Assets by Fund Type. Rescale the Assets axis, if necessary, to see more detai
> In the sample of 479 retirement funds ( Retirement Funds ), what are the attributes of the fund with the highest five-year return?
> Using the sample of retirement funds stored in Retirement Funds: a. Construct a table that tallies type, market cap, risk, and rating. b. What conclusions can you reach concerning differences among the types of funds based on market cap categories, ris
> An IAB study on the state of original digital video showed that original data video is becoming increasingly popular. Original digital video is defined as professionally produced video only for ad-supported online distribution and viewing (not TV). Accor
> Using the sample of retirement funds stored in Retirement Funds: a. Construct a table that tallies Fund Type, Risk Level and Star Rating. b. What conclusions can you reach concerning differences among the types of retirement funds, based on the risk le
> Using the sample of retirement funds stored in Retirement Funds: a. Construct a table that tallies, Market Cap, Risk Level, and Star Rating. b. What conclusions can you reach concerning differences among the funds based on Market Cap (small, mid-cap, and
> Using the sample of retirement funds stored in Retirement Funds: a. Construct a table that tallies Fund Type, Market Cap, and Star Rating. b. What conclusions can you reach concerning differences among the types of retirement funds (growth and value), ba
> The Super Bowl is a big viewing event watched by close to 200 million Americans that is also a big event for advertisers. The file SuperBowlAds contains the number of ads that ran between the opening kickoff and the final whistle and the total elapsed ru
> The file Movie Attendance16 contains the yearly movie attendance (in billions) from 2001 through 2016. a. Construct a time-series plot for the movie attendance (in billions). b. What pattern, if any, is present in the data?
> The file NewHomeSales contains the number of new homes sold (in thousands) and the median sales price of new single-family houses sold in the United States recorded at the end of each month from January 2000 through December 2016. Source: Data extracted
> How have stocks performed in the past? The following table presents the data stored in Stock Performance and shows the performance of a broad measure of stocks (by percentage) for each decade from the 1830s through the 2000s: a. Construct a time-series
> A Pew Research Center survey found a noticeable rise in smartphone ownership and Internet usage in emerging and developing nations. Once online, adults in these nations are hungry for social interaction. The file GlobalIntenetUsage contains the level of
> The file MobileSpeed contains the overall download and upload speeds in mbps for nine carriers in the United States. Source: Data extracted from “Best Mobile Network 2016”, bit.ly/1KGPrMm, accessed November 10, 2016. a. Do you think that carriers with
> Data were collected on the typical cost of dining at American- cuisine restaurants within a 1-mile walking distance of a hotel located in a large city. The file Bundle contains the typical cost (a per transaction cost in $) as well as a Bundle score, a m
> The topic of global warming increasingly appears in the news. It has the potential to impact companies’ operations through changes in governmental regulations, new reporting requirements, necessary operational changes, and so on. The Institute of Managem
> The following is a series of annual sales (in $millions) over an 11-year period (2007 to 2017): Year: 2007 2008 2009 2010 2011 2012 2013 2014 2015 2016 2017 Sales: 13.0 17.0 19.0 20.0 20.5 20.5 20.5 20.0 19.0 17.0 13.0 a. Construct a time-series plot. b.
> The following is a set of data from a sample of n = 11 items: X: 7 5 8 3 6 0 2 4 9 5 8 Y: 1 5 4 9 8 0 6 2 7 5 4 a. Construct a scatter plot. b. Is there a relationship between X and Y? Explain.
> The data stored in Drink represents the amount of soft drink in a sample of fifty 2-liter bottles. a. Construct a histogram and a percentage polygon. b. Construct a cumulative percentage polygon. c. On the basis of the results in (a) and (b), does the am
> The file Bulbs contains the life (in hours) of a sample of forty 6-watt light emitting diode (LED) light bulbs produced by Manufacturer A and a sample of forty 6-watt light emitting diode (LED) light bulbs produced by Manufacturer B. Use the following c
> The financial services call center in Problem 2.44 also monitors call duration, which is the amount of time spent speaking to customers on the phone. The file CallDuration contains the following data for time, in seconds, spent by agents talking to 50 cu
> Call centers today play an important role in managing dayto- day business communications with customers. Call centers must be monitored with a comprehensive set of metrics so that businesses can better understand the overall performance of those centers.
> One operation of a mill is to cut pieces of steel into parts that will later be used as the frame for front seats in an automobile. The steel is cut with a diamond saw and requires the resulting parts to be within {0.005 inch of the length specified by t
> How do the average credit scores of people living in various cities differ? The file Credit Scores contains an ordered array of the average credit scores of 2,570 American cities. Source: Data extracted from “Study shows cities with highest and lowest cr
> How much time do Americans living in cities spend commuting to work each week? The data in the file CommutingTime include this cost for 30 cities. Source: Data extracted from “The High Cost of Congestion,” NYC Economic Brief, March 2015, p. 3. For the ti
> The following histogram and cumulative percentage polygon visualize the data about the property taxes on a $176K home for the 50 states and the District of Columbia, stored in Property Taxes . What conclusions can you reach concerning the property tax
> According to the MSCI 2016 Survey of Women on Boards, women hold 20% of director seats on U.S. corporate boards. This study also reports that 34% of U.S. companies have three or more female board directors. Source: Data extracted from “The Tipping Point:
> As player salaries have increased, the cost of attending baseball games has increased dramatically. The following histogram visualizes the total cost (in $) for two tickets, two beers, two hot dogs, and parking for one vehicle at each of the 30 Major Lea
> The file Utility contains the following data about the cost of electricity during July of a recent year for a random sample of 50 one- bedroom apartments in a large city: 96 171 202 178 147 102 153 197 127 82 157 185 90 116 172 111 148 213 130 165 141 1
> The file MobileSpeed contains the overall download and upload speeds in mbps for nine carriers in the United States. Source: Data extracted from “Best Mobile Network 2016”, bit.ly/1KGPrMm, accessed November 10, 2016. a. Construct an ordered array. b. C
> The file NBACost contains the total cost (in $) for four tickets purchased on the secondary market, two beers, two soft drinks, four hot dogs, and one parking space at each of the 30 National Basketball Association arenas during a recent season. Source:
> The following is a stem-and-leaf display representing the amount of gasoline purchased, in gallons (with leaves in tenths of gallons), for a sample of 25 cars that use a particular service station on the New Jersey Turnpike: a. Construct an ordered arr
> Construct an ordered array, given the following stem-and-leaf display from a sample of n = 7 midterm exam scores in information systems:
> Construct a stem-and-leaf display, given the following data from a sample of midterm exam scores in finance:
> Do social recommendations increase ad effectiveness? A study of online video viewers compared viewers who arrived at an advertising video for a particular brand by following a social media recommendation link to viewers who arrived at the same video by w
> A study of selected Kickstarter projects showed that overall a majority were successful, achieving their goal and raising, at a minimum, the targeted amounts. In an effort to identify project types that influence success, selected projects were subdivide
> A survey of 1,520 American adults asked “Do you feel overloaded with too much information?” The results indicate that 23% of females feel information overload compared to 17% of males. The results are: a. Construct a
> The goal of corporate sustainability is to manage the environmental, economic, and social effects of a corporation’s operations so it is profitable over the long-term while acting in a responsible manner to society. An international study by Unilever rev
> Timetric’s 2016 survey of insurance professionals explores the use of technology in the industry. The file Technologies contains the responses to the question that asked what technologies these professionals expected to be most used by
> The following table indicates the percentage of residential electricity consumption in the United States, in a recent year organized by type of use. a. Construct a bar chart, a pie chart, and a Pareto chart. b. Which graphical method do you think is be
> The Consumer Financial Protection Bureau reports on consumer financial product and service complaint submissions by state, category, and company. The following table, stored in Financial Complaints1 , represents complaints received from Louisiana consume
> The Energy Information Administration reported the following sources of electricity in the United States in 2016: a. Construct a Pareto chart. b. What percentage of power is derived from coal, nuclear power, or natural gas? c. Construct a pie chart. d.
> A survey of online shoppers revealed that in 2015 they bought more of their purchases online than in stores. The data in Online Shopping reveals how their purchases were made. a. Construct a bar chart, a pie or doughnut chart, and a Pareto chart. b. Whic
> The file Drink contains the following data for the amount of soft drink (in liters) in a sample of fifty 2-liter bottles: 2.109 2.086 2.066 2.075 2.065 2.057 2.052 2.044 2.036 2.038 2.031 2.029 2.025 2.029 2.023 2.020 2.015 2.014 2.013 2.014 2.012 2.012
> The file Bulbs contains the life (in hours) of a sample of forty 6-watt light emitting diode (LED) light bulbs produced by Manufacturer A and a sample of forty 6-watt light emitting diode (LED) light bulbs produced by Manufacturer B. a. Construct a frequ
> The financial services call center in Problem 2.20 also monitors call duration, the amount of time spent speaking to customers on the phone. The file CallDuration contains the following data for time, in seconds, spent by agents talking to 50 customers:
> Call centers today play an important role in managing dayto- day business communications with customers. Call centers must be monitored with a comprehensive set of metrics so that businesses can better understand the overall performance of those centers.
> What do millennials around the world want in a job? A Deloitte survey of millennials on work-life challenges found that millennials are looking for stability in an uncertain world, with 65% of millennials preferring a permanent, full-time job rather than
> One operation of a mill is to cut pieces of steel into parts that will later be used as the frame for front seats in an automobile. The steel is cut with a diamond saw and requires the resulting parts to be within {0.005 inch of the length specified by t
> How do the average credit scores of people living in different American cities differ? The data in Credit Scores is an ordered array of the average credit scores of 2,570 American cities. Source: Data extracted from www.bizjournals.com/sanantonionews/20
> How much time do commuters living in or near cities spend commuting to work each week? The file Commuting Time contains the average weekly commuting time in 30 U.S. cities. Source: Data extracted from Office of the New York City Comptroller, “NYC Econom
> The file Utility contains the following data about the cost of electricity (in $) during July 2017 for a random sample of 50 one-bedroom apartments in a large city. 96 171 202 178 147 102 153 197 127 82 157 185 90 116 172 111 148 213 130 165 141 149 206
> The file NBACost contains the total cost ($) for four tickets purchased on the secondary market, two beers, two soft drinks, two hot dogs, and one parking space at each of the 30 National Basketball Association arenas during a recent season. These costs
> Data was collected on salaries of compliance specialists in corporate accounting firms. The salaries ranged from $61,000 to $261,000. a. If these salaries were grouped into six class intervals, indicate the class boundaries. b. What class interval width
> Planning and preparing for the unexpected, especially in response to a security incident, is one of the greatest challenges faced by information technology professionals today. An incident is described as any violation of policy, law, or unacceptable act
> Construct an ordered array, given the following data from a sample of midterm exam scores in marketing: 88 78 78 73 91 78 85
> Construct an ordered array, given the following data from a sample of n = 7 midterm exam scores in accounting: 68 94 63 75 71 88 64
> Do social recommendations increase ad effectiveness? A study of online video viewers compared viewers who arrived at an advertising video for a particular brand by following a social media recommendation link to viewers who arrived at the same video by w
> You plan to conduct a marketing experiment in which students are to taste one of two different brands of soft drink. Their task is to correctly identify the brand tasted. You select a random sample of 200 students and assume that the students have no abi
> A study of selected Kickstarter projects showed that overall a majority were successful, achieving their goal and raising, at a minimum, the targeted amounts. In an effort to identify project types that influence success, selected projects were subdivide
> A survey of 1,520 Americans adults asked “Do you feel Overloaded with too much information?” The results indicate that 23% of females feel information overload compared to 17% of males. The results are: a. Construct
> Timetric’s 2016 survey of insurance professionals explores the use of technology in the industry. The file Technologies contains the responses to the question that asked what technologies these professionals expected to be most used by
> This table represents the summer power-generating capacity by energy source in the United States as of July 2016. What conclusions can you reach about the source of energy in July 2016?
> In addition to the impact of Big Data, what disruptive technology capability do executives anticipate will have the greatest impact on their firm over the next decade? A survey of 50 Fortune 1000 executives revealed the following: What conclusions can
> The Consumer Financial Protection Bureau reports on consumer financial product and service complaint submissions by state, category, and company. The following table, stored in FinancialComplaints1 , represents complaints received from Louisiana consumer
> The following table, stored in Smartphone Sales , represents the annual market share of smartphones, by type, for the years 2011, 2012, 2013, 2014, and 2015. Source: Data extracted from www.gartner.com/newsroom/id/3215217. a. What conclusions can you r
> The following data represent the responses to two questions asked in a survey of 40 college students majoring in business: What is your gender? (M = male; F = female) and What is your major? (A = Accounting; C = Computer Information Systems; a. Tally t
> A categorical variable has three categories, with the following frequencies of occurrence: a. Compute the percentage of values in each category. b. What conclusions can you reach concerning the categories?
> Four different beverages are sold at a fast-food restaurant: soft drinks, tea, coffee, and bottled water. a. Explain why the type of beverage sold is an example of a categorical variable. b. Explain why the type of beverage is an example of a nominal-s
> A political pollster is conducting an analysis of sample results in order to make predictions on election night. Assuming a two-candidate election, if a specific candidate receives at least 55% of the vote in the sample, that candidate will be forecast a
> Social media provides an enormous amount of data about the activities and habits of people using social platforms like Facebook and Twitter. The belief is that mining that data provides a treasure trove for those who seek to quantify and predict future h
> Three professors examined awareness of four widely disseminated retirement rules among employees at the University of Utah. These rules provide simple answers to questions about retirement planning (R. N. Mayer, C. D. Zick, and M. Glaittle, “Public Aware
> Download and examine Zarca Interactive’s “Sample Survey for Associations/Sample Questions for Surveys for Associations,” available at bit.ly/2p5HlGO. a. Give an example of a categorical variable included in the survey. b. Give an example of a numerical v
> The American Community Survey (www.census.gov/acs) provides data every year about communities in the United States. Addresses are randomly selected and respondents are required to supply answers to a series of questions. a. Describe a variable for which
> A recent PwC survey of 1,379 CEOs from a wide range of industries representing a mix of company sizes from Asia, Europe, and the Americas indicated that CEOs are firmly convinced that it is harder to gain and retain people’s trust in an increasingly digi
> The Gallup organization releases the results of recent polls on its website, www.gallup.com. Visit this site and read an article of interest. a. Describe the population of interest. b. Describe the sample that was collected. c. Describe a parameter of in
> Results of a 2017 Computer Services, Inc. (CSI) survey of a sample of 163 bank executives reveal insights on banking priorities among financial institutions (goo.gl/mniYMM). As financial institutions begin planning for a new year, of utmost importance is
> Visit the official website for Microsoft Excel, products .office.com/excel or Minitab (www.minitab.com) or JMP (www .jmp.com). Review the features of the program you chose and then state the ways the program could be useful in statistical analysis.
> A survey indicates that the vast majority of college students own their own smartphones. What information would you want to know before you accepted the results of this survey?
> A hotel management company runs 10 hotels in a resort area. The hotels have a mix of pricing—some hotels have budget-priced rooms, some have moderate-priced rooms, and some have deluxe-priced rooms. Data are collected that indicate the number of rooms th
> The following data represent the responses (Y for yes and N for no) from a sample of 40 college students to the question “Do you currently own shares in any stocks?” N N Y N N Y N Y N Y N N Y N Y Y N N N Y N Y N N N N Y N N Y Y N N N Y N N Y N N a. Deter
> An amusement park company owns three hotels on an adjoining site. A guest relations manager wants to study the time it takes for shuttle buses to travel from each of the hotels to the amusement park entrance. Data were collected on a particular day that
> The amount of monthly data usage by a sample of 10 cellphone users (in MB) was: 0.4, 2.7MB, 5.6, 4.3, 11.4, 26.8, 1.6, 1,079, 8.3, 4.2 Are there any potential irregularities in the data?
> The cellphone brands owned by a sample of 20 respondents were: Apple, Samsung, Appel, Nokia, Blackberry, HTC, Apple, Samsung, HTC, LG, Blueberry, Samsung, Samsung, APPLE, Motorola, Apple, Samsun, Apple, Samsung a. Clean these data and identify any irregu
> Suppose that 10,000 customers in a retailer’s customer database are categorized by three customer types: 3,500 prospective buyers, 4,500 first time buyers, and 2,000 repeat (loyal) buyers. A sample of 1,000 customers is needed. a. What type of sampling s
> Pre-numbered sales invoices are kept in a sales journal. The invoices are numbered from 0001 to 5000. a. Beginning in row 16, column 01, and proceeding horizontally in a table of random numbers (Table E.1), select a simple random sample of 50 invoice num
> The registrar of a university with a population of N = 4,000 full-time students is asked by the president to conduct a survey to measure satisfaction with the quality of life on campus. The following table contains a breakdown of the 4,000 registered ful
> A population has four members (called A, B, C, and D). You would like to select a random sample of n = 2, which you decide to do in the following way: Flip a coin; if it is heads, the sample will be items A and B; if it is tails, the sample will be items
> You want to select a random sample of n = 1 from a population of three items (which are called A, B, and C). The rule for selecting the sample is as follows: Flip a coin; if it is heads, pick item A; if it is tails, flip the coin again; this time, if it
> For a study that consists of personal interviews with participants (rather than mail or phone surveys), explain why simple random sampling might be less practical than some other sampling methods.
> Given a population of N = 93, starting in row 29, column 01 of the table of random numbers (Table E.1), and reading across the row, select a sample of N = 15 a. without replacement. b. with replacement.
> A random sample of 50 households was selected for a phone (landline and cellphone) survey. The key question asked was, “Do you or any member of your household own an Apple product (iPhone, iPod, iPad, or Mac computer)?” Of the 50 respondents, 20 said yes
> For a population of N = 902, verify that by starting in row 05, column 01 of the table of random numbers (Table E.1), you need only six rows to select a sample of N = 60 without replacement.

